Introduction
Voltage sags, short-duration reductions in supply voltage, pose significant challenges to electrical and electronic equipment, leading to malfunctions, shutdowns, and substantial economic losses across industries.
The IEEE Std 1668-2017, titled “Recommended Practice for Voltage Sag and Short Interruption Ride-Through Testing for End-Use Electrical Equipment Rated Less than 1000 V,” provides a standardized framework for assessing and improving equipment resilience to voltage sags.
SEMI F47, titled “Specification for Semiconductor Processing Equipment Voltage Sag Immunity,” is a critical industry standard developed to ensure the resilience of semiconductor manufacturing equipment against voltage sags.
Power Monitors’ PQCanvass web application has an analytics report that allows customers to check if data they’ve recorded is within voltage sag specifications.
This whitepaper aims to:
- Provide an overview of Voltage Sags and IEEE Std 1668-2017.
- Provide an overview of SEMI F47-0706 and its relationship to IEEE Std 1668-2017.
- Highlight both standards’ significance for manufacturers, utilities, and end users.
- Describe how to execute the Voltage Sags analytics report in PQCanvass.
IEEE Std 1668-2017
Overview
IEEE Std 1668-2017, published by the IEEE Standards Association, defines testing protocols for assessing equipment performance under voltage sags and short interruptions (<1 minute) in low-voltage systems (<1000 V). It applies to single-phase, two-phase, and three-phase equipment across industries.
The standard characterizes sags by magnitude (e.g., 50%, 70% residual voltage), duration (e.g., 0.2–2 seconds), and phase relationships, using real-world data to set realistic test points. For example, equipment must withstand 50% voltage for 0.2 seconds without failure.
Benefits and Applications
The standard’s testing procedures outline equipment setups, controlled sag simulation, and certification reporting to ensure consistent evaluation. For voltage sag analysis, IEEE 1668 standardizes sag classification, enabling precise identification of magnitude, duration, and impact.
It supports power quality studies by providing data-driven criteria to assess equipment performance against sag conditions. This helps stakeholders identify vulnerabilities, evaluate mitigation needs (e.g., UPS systems), and align equipment with real-world electrical environments, minimizing downtime and costs.
SEMI F47-0706
Overview
Published by Semiconductor Equipment and Materials International (SEMI), the SEMI F47-0706 standard defines test protocols for assessing voltage sag immunity in semiconductor processing equipment on low-voltage systems. It covers single-phase, two-phase, and three-phase equipment in fabrication facilities, specifying sag magnitude (e.g., 50%, 70%, 80% residual voltage) and duration (0.05–1 second) based on real-world data.
SEMI F47-0706 outlines testing procedures for sag simulation and performance evaluation, standardizing sag classification to identify vulnerabilities. It sets immunity requirements, like withstanding 50% voltage sags for 0.2 seconds, aiding manufacturers in designing reliable equipment and supporting power quality studies with mitigation strategies like UPS systems.
Benefits and Applications
SEMI F47-0706 is instrumental for semiconductor manufacturers, equipment suppliers, and facility managers. It drives the design of robust equipment, ensuring uninterrupted production and minimizing costly wafer defects. Utilities and consultants use the standard to conduct power quality audits, identifying sag-prone areas in fabs.
By meeting SEMI F47-0706 requirements, equipment suppliers enhance market competitiveness, while fabs achieve higher operational reliability. Despite challenges like testing costs, SEMI F47-0706 remains a cornerstone for improving power quality in the semiconductor industry, complementing standards like IEEE 1668-2017.
Analysis in PQ Canvass
Overview
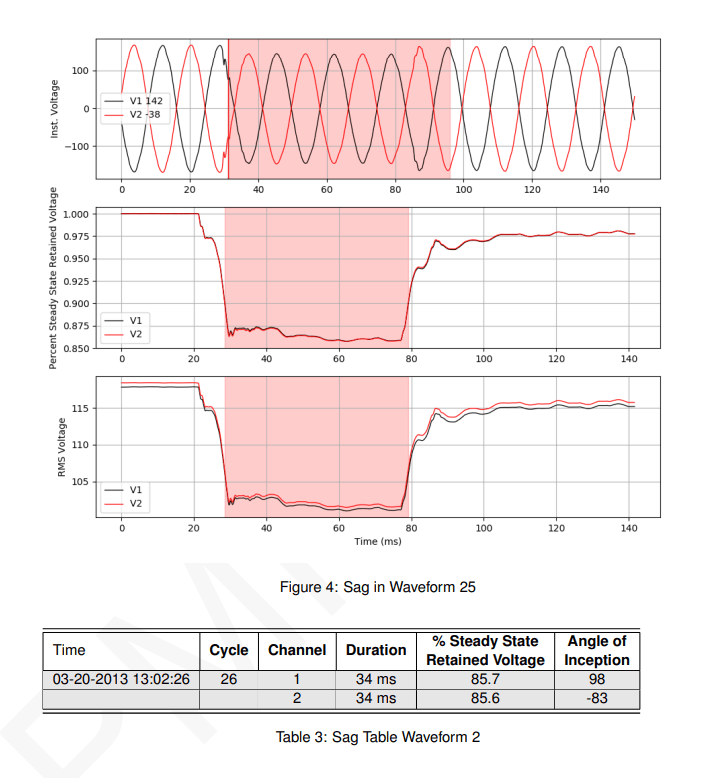
Voltage Sag analysis in PQCanvass targets detection of short-duration reductions in RMS voltage, typically lasting from a half-cycle up to a minute. These are classified by both magnitude and duration, as prescribed in IEEE Std 1668-2017 and further evaluated against SEMI F47-0706 ride-through criteria. Every sag event is logged with a timestamp, retained voltage, duration, and inception angle.
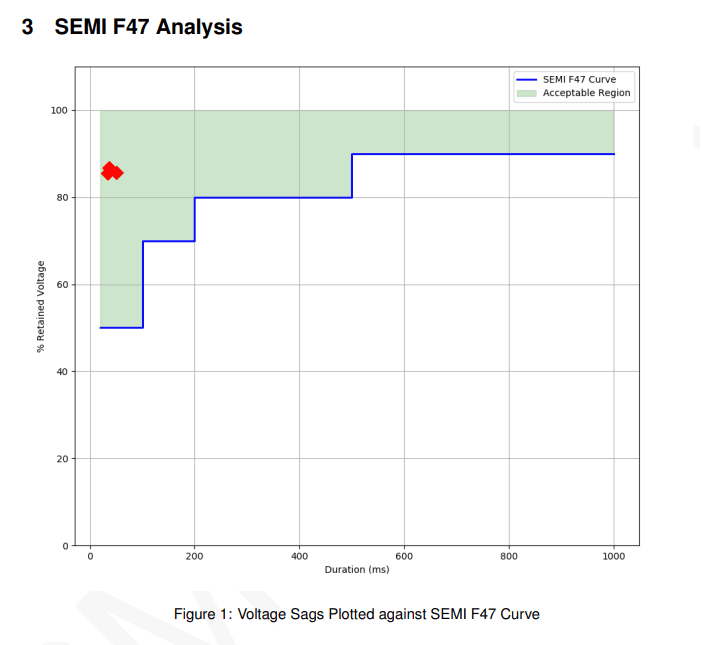
SEMI F47-0706 compliance is assessed by plotting each sag on the standard curve; events falling beneath the curve are considered non-compliant for sensitive semiconductor or automated industrial loads. Additionally, PQCanvass overlays RMS current data to help engineers discern whether the sag is externally imposed or induced by onsite load transitions, such as motor starts or arc loads. Sags linked to customer processes can then be mitigated with load sequencing or ride-through devices, while externally sourced events may warrant upstream utility investigation.
Running the Voltage Sags Report
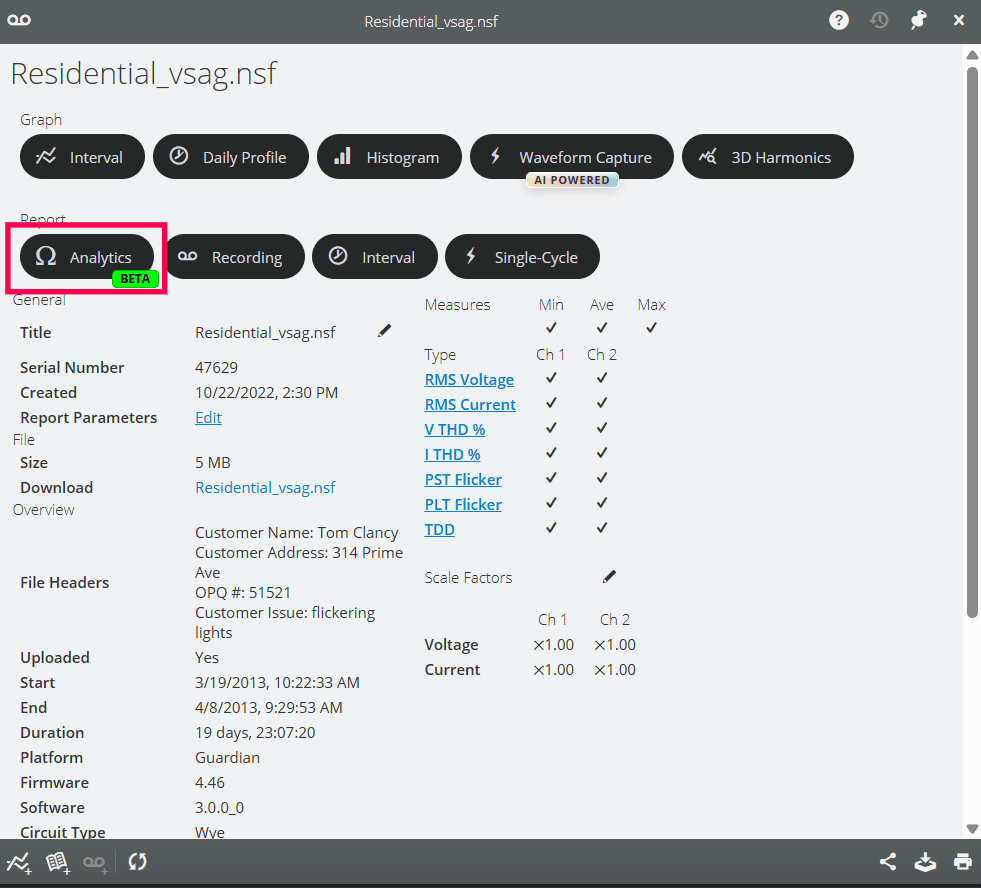
To generate a Voltage Sags report in PQCanvass, first select the recording you want to analyze. Then select the ‘Analytics’ report button, as shown in Figure 2.
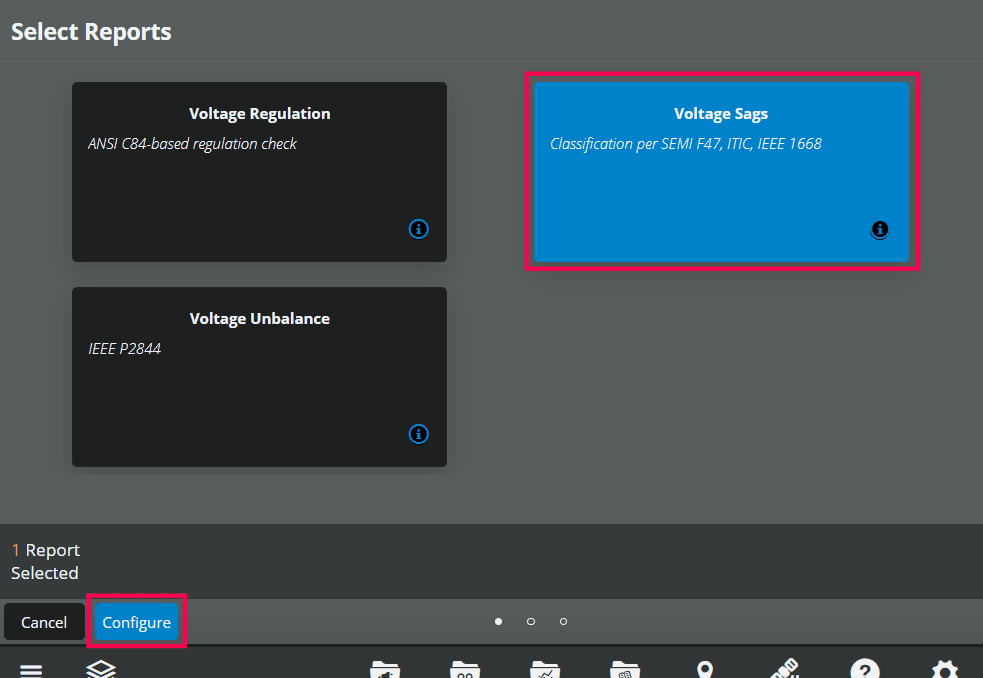
Select the ‘Voltage Sags’ report and then select the ‘Configure’ button, as shown in Figure 3.
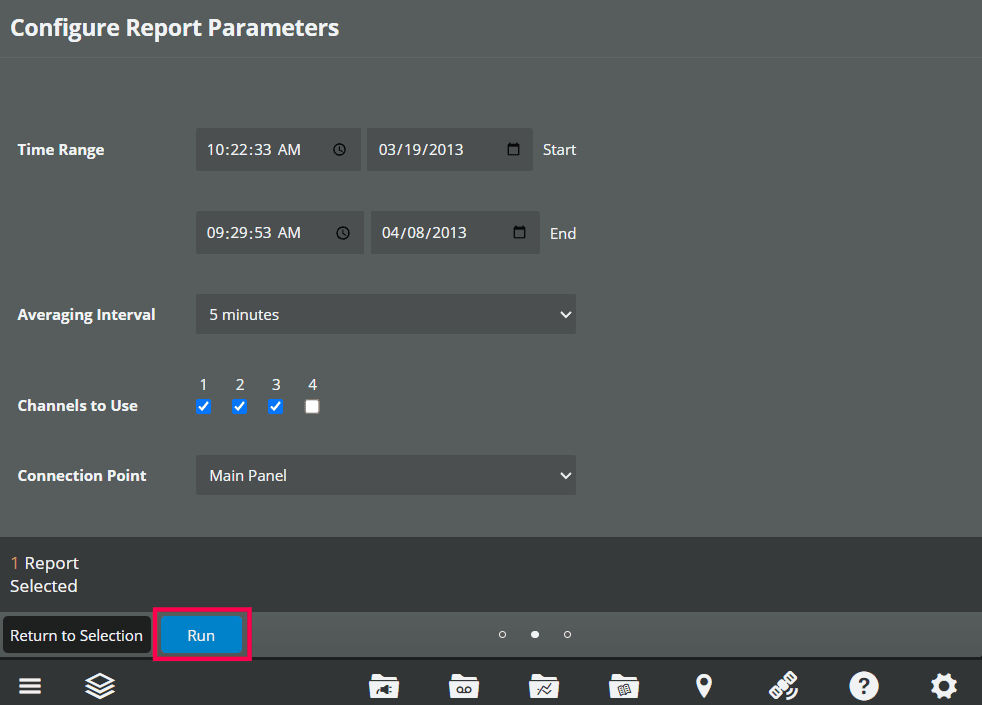
Configure the parameters for the report and then select the ‘Run’ button.
- Time Range: Recording data will only be analyzed within the start and end times.
- Averaging Interval: Data points will be averaged from the recorded interval to the specified interval.
- Channels to Use: Select which recorded channels to analyze.
- Connection Point: Where was the recorder connected?
The report takes a little while to run, and you can choose to wait for it to complete, or you can navigate away while it runs in the background. A notification will pop up when the report is ready. Selecting the link in the notification will open the report. Reports can always be found by navigating to the ‘Reports’ list, using the navigation on the bottom bar.
Viewing the Voltage Sags Report
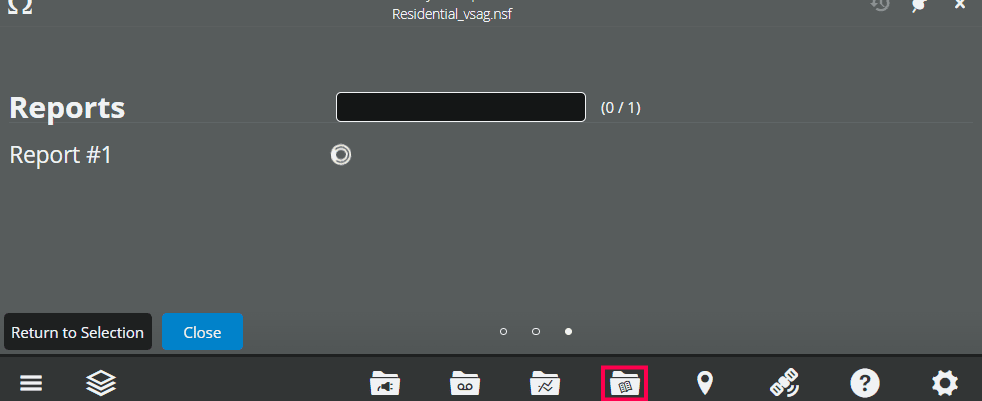
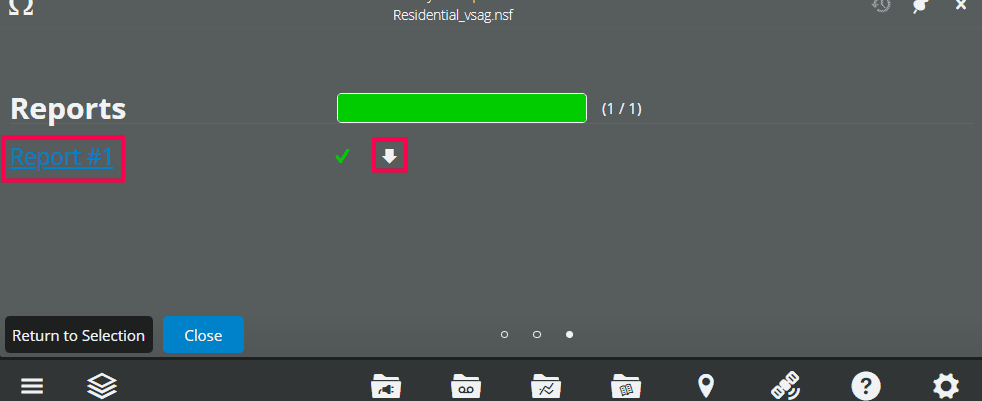
Once the report is completed, you can simply click on the link to open the report, or click on the download arrow to download the report as a PDF.
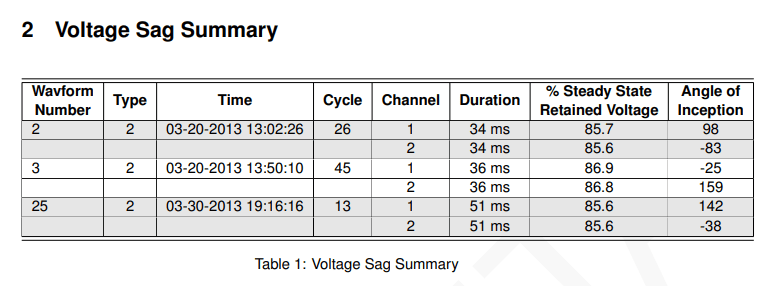
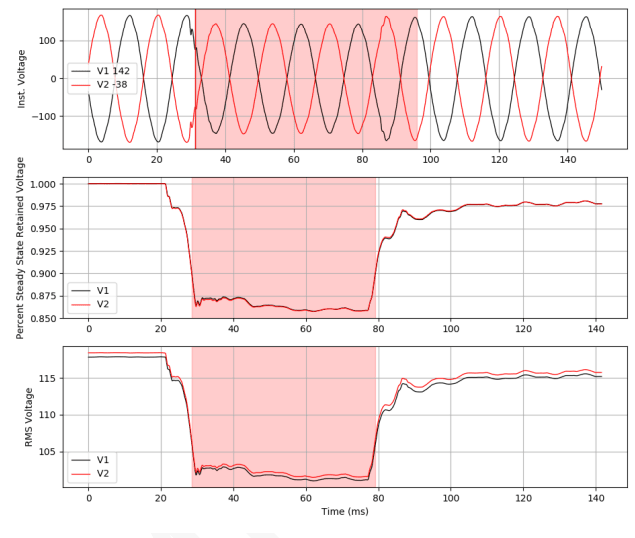
In the report you can find useful data, such as the Voltage Sag Summary in Figure 7, the Voltage Sag Analysis in Figure 1, and the SEMI F47 Analysis in Figure 8.
Conclusion
Voltage sags disrupt industrial and semiconductor operations, causing equipment failures and economic losses. IEEE Std 1668-2017 and SEMI F47-0706 provide standardized testing for equipment resilience, with IEEE 1668-2017 addressing broad low-voltage systems and SEMI F47-0706 focusing on semiconductor fabrication.
These standards enhance power quality by standardizing sag analysis and guiding mitigation. PQ Canvass’ Voltage Sags analytic report leverages these standards, plotting sag events to identify non-compliance and helping in distinguishing between external and onsite causes. This enables targeted solutions like UPS systems or load sequencing, reducing downtime and costs across industries.
