Abstract
Voltage regulation—the ability to maintain steady‑state RMS voltage within acceptable bounds—affects equipment performance, protection, and customer experience. Distributed energy resources (DER) add complexity via bidirectional power flow and daytime voltage rise that must be managed without violating standards and overvoltaging equipment.
ANSI C84.1‑2020 is the reference for steady‑state service and utilization voltage bands (Range A preferred; Range B tolerable). Annex D of ANSI C84.1 is informative on DER‑related voltage rise.
PQ Canvass includes a Voltage Regulation report that evaluates recorded RMS voltage against ANSI C84.1 at the selected connection point. The report assembles a summary, time‑in‑tolerance, excursion plots/tables, daily profiles, percentile histograms, and observations.
This whitepaper aims to:
- Summarize ANSI C84.1 with service vs. utilization context and common program practice.
- Highlight the standards’ significance for utilities and end users.
- Show how to configure and run the Voltage Regulation report in PQ Canvass.
- A walkthrough of the report contents and how to best interpret the results.
Standards Overview (ANSI C84.1)
ANSI C84.1 is the U.S. reference for steady‑state voltage performance. It defines acceptable voltage bands at both the service point and at utilization equipment, giving utilities and end users a common basis for planning, evaluation, and corrective action.
The standard distinguishes two operating bands. Range A is the preferred band for normal conditions (±5% at the service point; −10%/+5% for utilization). The standard uses the phrase ‘most of the time’ but does not quantify it; programs commonly adopt criteria (e.g., 95% in‑band) to operationalize compliance.
Range B permits limited excursions beyond Range A and recognizes real‑world variability; operation should be infrequent and not sustained. For LV service, Range B limits are approximately +5.8% to −8.3%; for utilization, Range B is approximately +5.8% to −13.3% relative to nominal. Duration/frequency allowances are set by the utility or program.
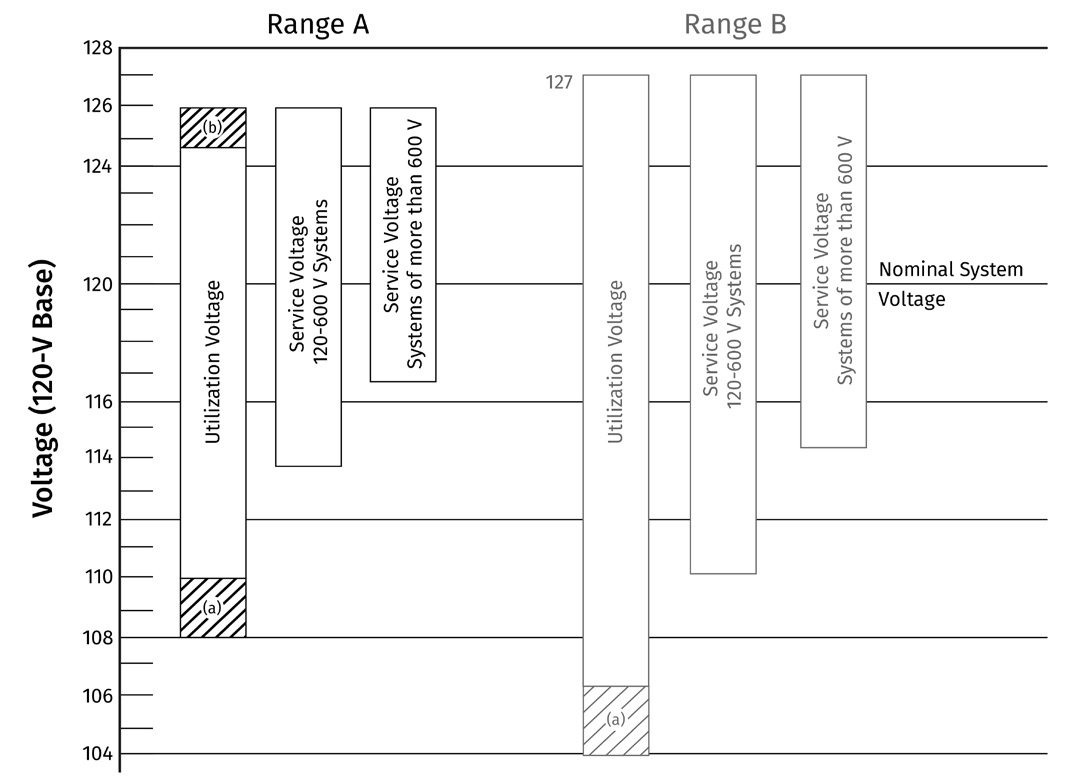
The standard also makes a distinction between service and utilization voltage. Service voltage applies at the service entrance or point of common coupling on the delivery side. Utilization voltage applies at equipment terminals on the load side and inherently reflects voltage drop through customer conductors and transformers. Selecting the appropriate context is essential to assign responsibility correctly and to interpret compliance against the proper limits.
Where distributed energy resources are interconnected, ANSI C84.1 remains the baseline for steady‑state service and utilization voltage bands; Annex D in ANSI C84.1‑2020 is informative (discusses DER‑related voltage rise) and does not change the PCC/POI bands. DER ride‑through, Volt/VAR/Volt‑Watt behavior, and reconnection criteria derive from IEEE 1547‑2018 as adopted by interconnection rules; evaluate DER‑influenced voltage against those program criteria in addition to the ANSI bands, especially where export‑induced rise is expected and coordination with regulator/inverter settings is required.
In practice, recurrent operation in Range B often points to regulator tap settings, line‑drop compensation parameters, capacitor control, feeder loading, or Volt/VAR interactions, including those driven by DER that merit review.
Benefits and Applications
ANSI C84.1 provides a common yardstick for steady‑state voltage quality. Expressing performance as time within Range A and the incidence of Range B operation lets utilities and customers set targets, compare feeders and time periods, and document compliance without prescribing device settings.
The service versus utilization distinction ties measurements to responsibility, separating delivery performance at the service point from downstream voltage drop at equipment.
In practice, these bands guide day‑to‑day engineering. Utilities use them to tune regulator setpoints and line‑drop compensation, schedule capacitor banks, size conductors and transformers, and plan seasonal operating modes. The same metrics support complaint resolution and regulatory reporting: measured results can confirm delivery‑side compliance or reveal persistent bias/variability that warrant reinforcement or reconfiguration.
Running the Voltage Regulation Report in PQ Canvass
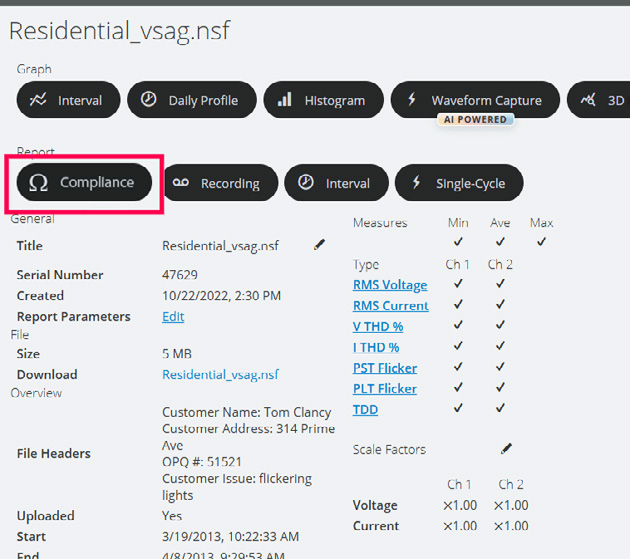
To generate a Voltage Regulation report in PQ Canvass, first select the recording you want to analyze. Then select the ‘Compliance’ report button, as shown in Figure 2.
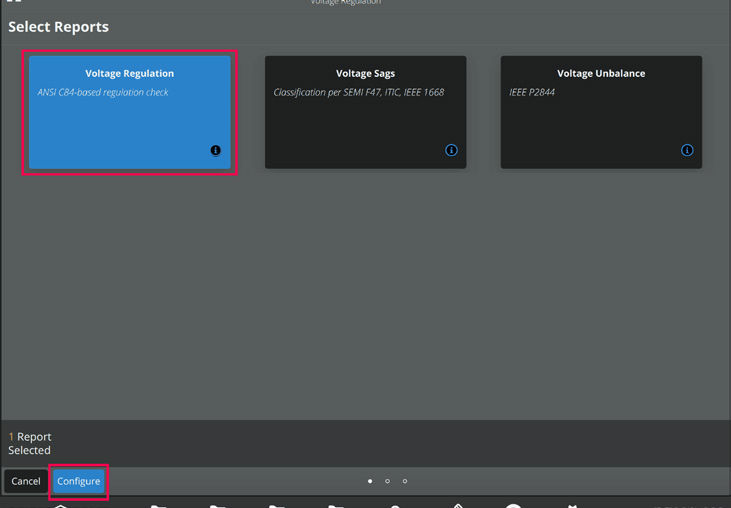
Select the ‘Voltage Regulation’ report, then select the ‘Configure’ button, as shown in Figure 3.
Configure the parameters for the report and then select the ‘Run’ button.
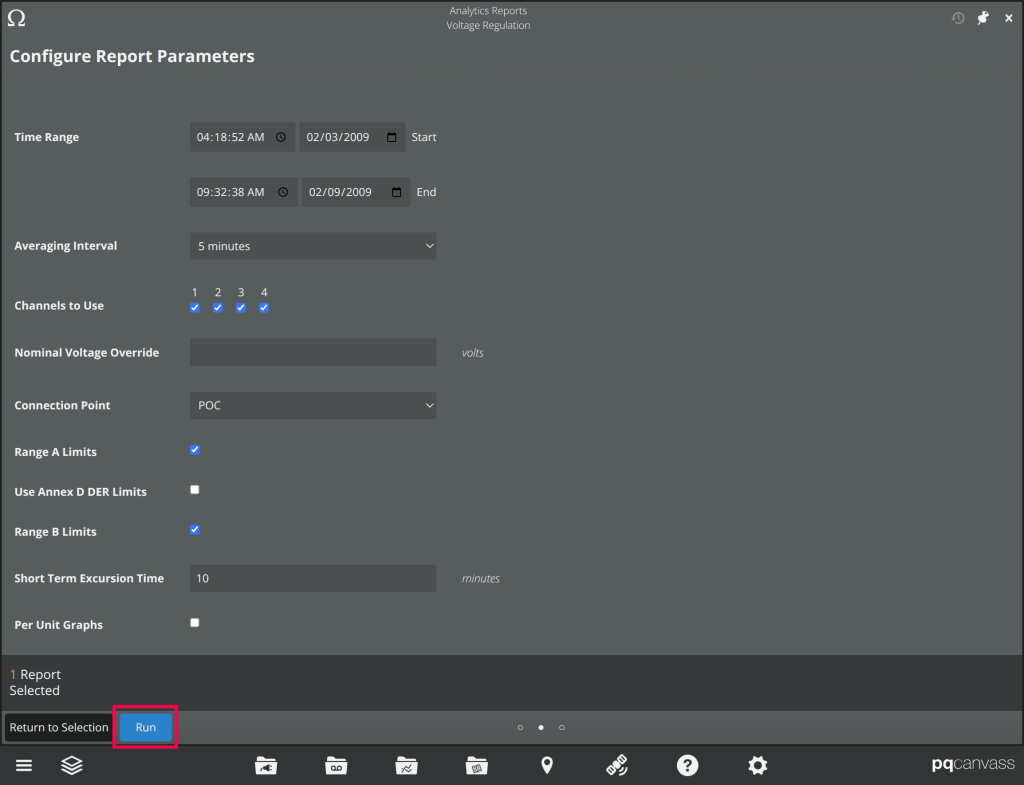
Figure 4. Voltage Regulation Report Parameters
Report Parameters
Time Range: The analysis is limited to the selected start and end timestamps and ignores data outside that window.
Averaging Interval: RMS data is re‑averaged to the selected interval to establish a steady‑state basis for comparison; longer intervals reduce noise but can mask brief deviations.
Channels to Use: Select which channels are analyzed and reported; combined results apply a conservative rule where any channel out of tolerance marks the system out of tolerance for that period.
Nominal Voltage Override: Nominal is auto‑detected from recorded steady‑state data unless overridden; interruptions are excluded from that estimate.
Connection Point: Choose where the measurement is referenced (e.g., POC, PCC, Main Panel) so the evaluation aligns with the appropriate ANSI C84.1 context for service or utilization voltage.
Range A Limits: Enable evaluation against the preferred steady‑state band; short‑term excursions outside Range A are detected and summarized per channel and in the combined view.
Use Annex D DER Limits: Applies a DER‑aware envelope (based on IEEE 1547‑2018 program criteria) in addition to ANSI C84.1 Range A evaluation, distinguishing expected DER‑induced voltage rise from problematic excursions.
Range B Limits: Enables evaluation for sustained deviations using the broader band; results are reported per channel and in the combined view.
Short Term Excursion Time: Set the minimum duration that distinguishes a sustained Range B excursion from a brief deviation; events shorter than this threshold are excluded from Range B counts.
Per Unit Graphs: Render plots in per‑unit relative to nominal.
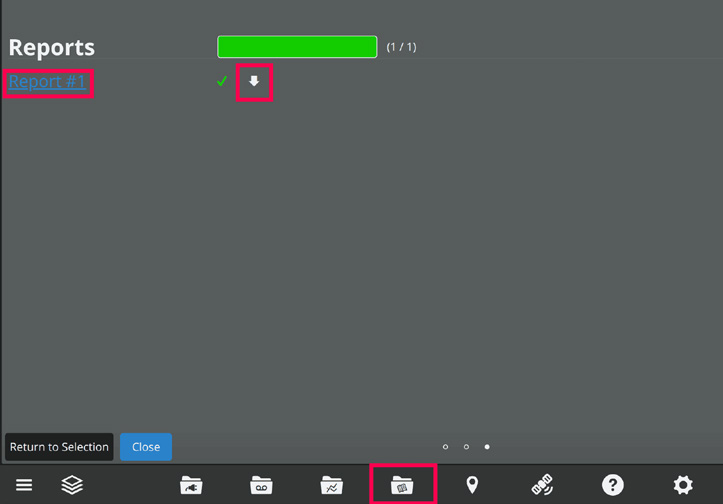
After you click ‘Run’, the analysis may take a few minutes. You can remain on the page or navigate elsewhere; processing continues in the background. When the report is ready, a notification will appear. Selecting the link in the notification will open the report. Reports can always be found by navigating to the ‘Reports’ list, using the navigation on the bottom bar.
Interpreting the Voltage Regulation Report
The Summary establishes context for the analysis window, averaging interval, connection point, nominal handling, and which bands were applied. Treat it as the ground truth for how limits were derived; it tells you what you’re looking at and why the subsequent results use those thresholds.
Range A Results present per‑channel percent time in and out of tolerance, with mean and median values as a quick sanity check on central tendency. The combined Range A table applies a conservative rule: if any channel is out of tolerance, the system is considered out for that period. Use the per‑channel rows to localize which channel drives the combined result; use the combined row to judge operational impact.
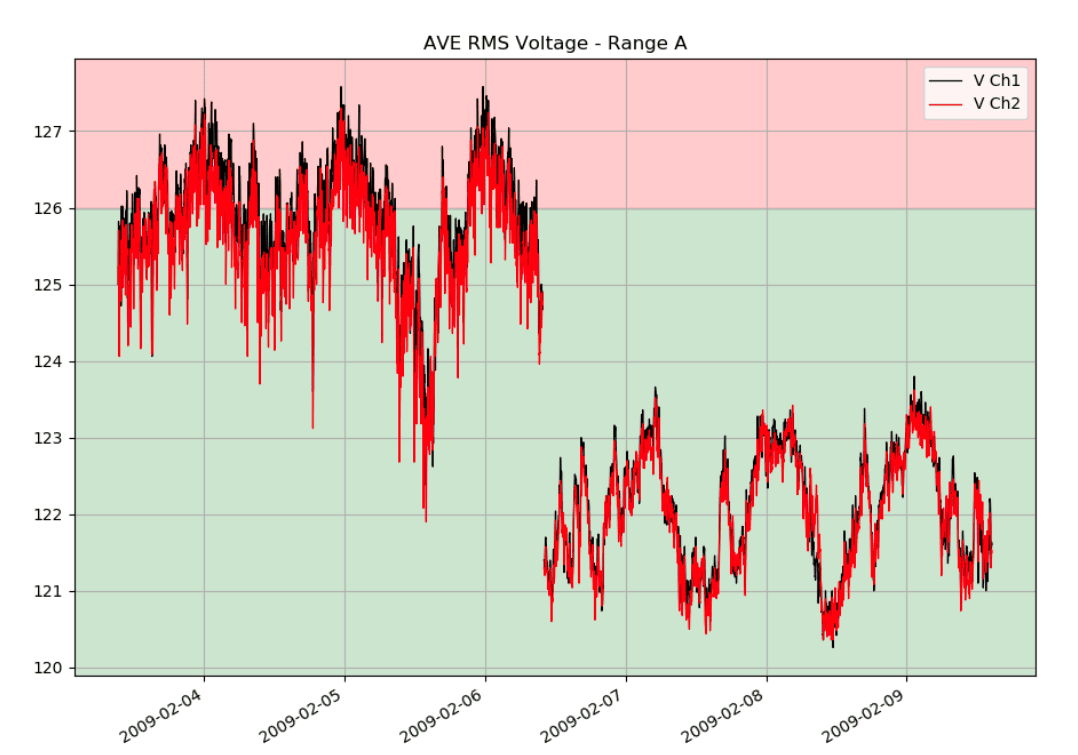
The Range A Excursion Graph overlays excursions on the averaged RMS trace for all channels. Look for clustering by time of day or load condition—patterns here often correlate with regulator tap operations, capacitor switching, or feeder loading. The Range A Key Statistics that follow list individual events with start, end, and duration; scan for repetition and duration trends to separate isolated outliers from recurring behavior.
Range B Results mirror the Range A presentation but apply the sustained‑deviation criterion. The combined Range B row is particularly useful for documenting whether any channel experienced unacceptable sustained operation. The Range B Excursion Graph and Key Statistics make it easy to see whether excursions are sporadic or persist long enough to warrant corrective action.
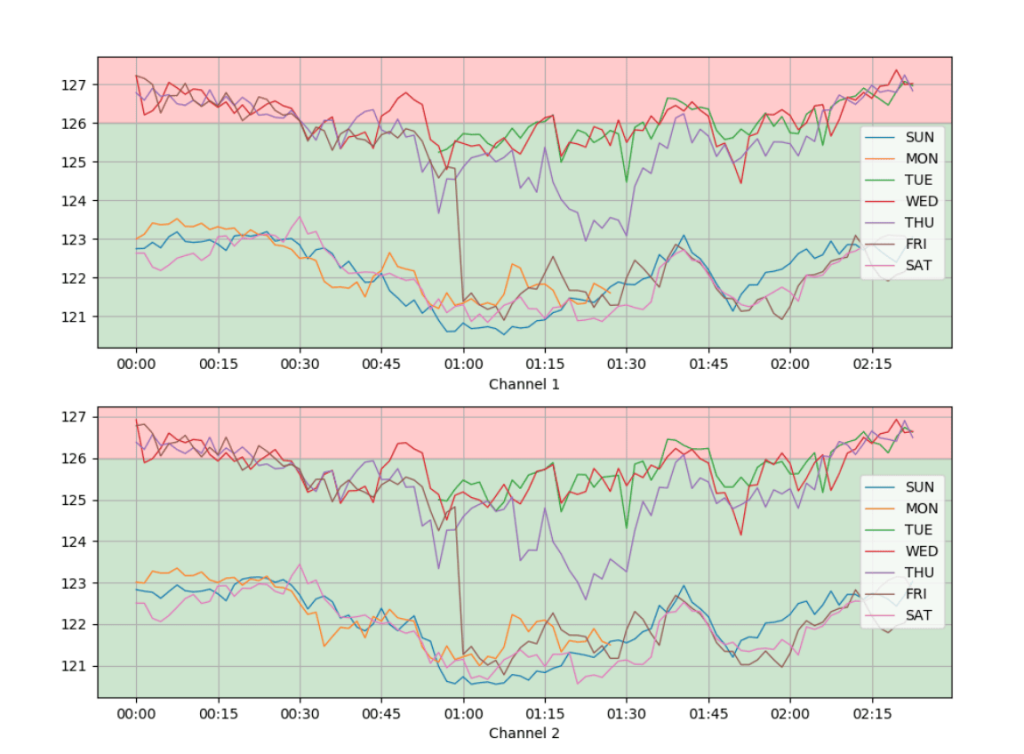
Daily Profiles aggregate values into fixed time‑of‑day bins to reveal systematic behavior. Consistent shoulders or valleys across days typically indicate scheduled operations or predictable loading patterns. Use this view to target time‑bound investigations and controller settings.
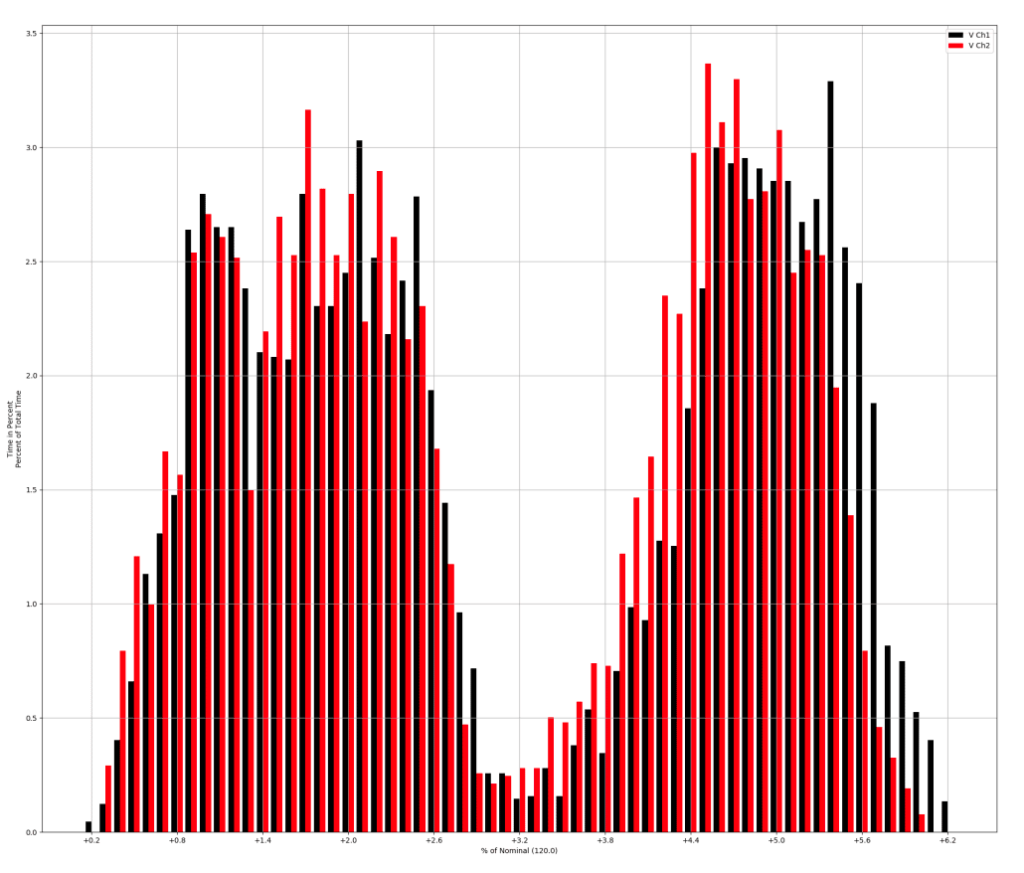
Percentile Histograms show how tightly voltages cluster around nominal. A narrow, centered distribution indicates robust regulation; skewed or fat‑tailed distributions suggest either chronic bias (tap setpoint, LDC) or variability (cycling loads, DER interactions). Tails extending beyond the applied bands quantify how much of the dataset pressures the limits.
The Observations section summarizes the findings. Treat it as a concise narrative: confirmation of compliance, identification of channels or time windows that merit attention, and suggested next steps for tuning voltage regulation equipment or investigating site conditions.
Conclusion
This paper introduced the Voltage Regulation compliance report in PQ Canvass. It provides a standards‑based assessment of steady‑state voltage against ANSI C84.1, separating short‑term deviations (Range A) from sustained conditions (Range B) and respecting the distinction between service and utilization voltage; while DER‑specific limits are available when interconnection rules apply.
Results are presented in a compact package including per‑channel and combined time‑in‑tolerance tables, excursion plots, daily profiles, percentile histograms, and observations. The combined view reflects operational impact when any channel is out of tolerance, while per‑channel results localize which channel drives the condition.
