Abstract
The Boomerang voltage sensor and Canvass software are essential pieces in a successful Voltage Optimization system, providing the long-term reporting needed for verification and system tuning, while also providing real-time voltage measurements for dynamic voltage control to meet regulatory service voltage requirements and insure maximal settlement credits.
Key VO/CVR Requirements
The VO/CVR (Voltage Optimization/Conservation Voltage Reduction) concept is to tightly regulate the voltage delivered to customers, and to keep that voltage close to the regulatory minimum level. Instead of relying on a ±5% range, and assuming customers close to a regulator will be on the high end, and customers at the end of a line will be on the low end, a CVR system will attempt to keep all customers within 1 or 2% of the minimum. The lower voltage reduces the total kWh required, compared to the power that would have been required at full voltage. Demonstrating regulatory compliance and real energy reduction requires specific data reporting, and maximizing the energy savings requires a responsive, tune, real-time CVR system with voltage sensors, regulators, and software to implement the control scheme and maintain historical voltage data.
A critical parameter for optimal CVR is setting the response time of the system. This requires profiling voltage patterns at key locations. The typical response time to tap changes and regulator steps, daily voltage profiles, and frequency and depth of voltage sags are all important to characterize before and during a CVR rollout. In order to tune parameters that operate on a minute-level timescale, second-level data is required.
The PMI Boomerang and Canvass system provides the measurement, polling, CVR-tuning data analysis, and storage abilities needed for a regulatory-compliant CVR program. The Boomerang is the cellular-based measurement device, providing voltage (and optionally current and power) readings on a 1 second basis through DNP3 to a SCADA master. In parallel, it feeds all data to PMI’s cloud-based Canvass data storage and analysis system. Canvass receives and stores continuous 24×7 1-second data from each Boomerang, and provides a web-based graphical interface for analyzing or exporting the data.
Boomerang
The Boomerang operates on the very edge of the CVR system – at the transformer secondary, measuring service voltage. CVR systems require near real-time voltage readings, and these should be electrically as close as possible to critical monitoring points. At a minimum, devices should be located at the end of each feeder or control zone, and at the substation. An additional measurement point just after a mid-feeder regulator is also helpful in optimizing CVR performance. By responding within seconds to smoothed voltage changes, the steady-state average can be kept above 114V as much as possible without shorter-term undervoltage conditions.
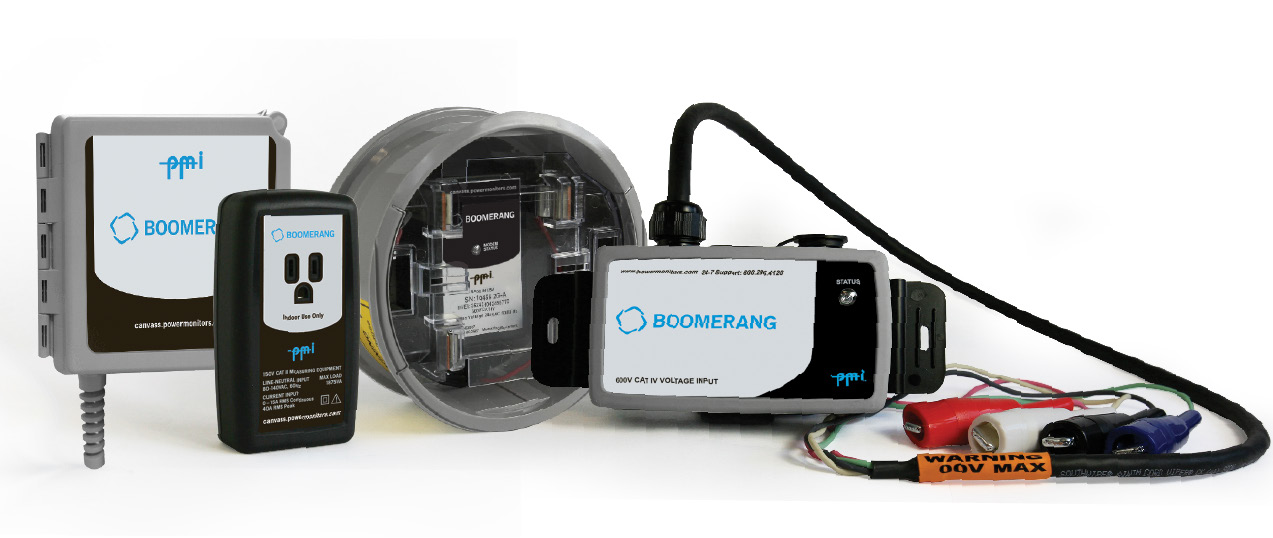
The different Boomerang form factors (Figure 1) allow for installation in any location type. Advantages for monitoring at the meter base are that the service voltage drop is included, and this is the point where the regulatory minimum voltage applies. Advantages for the transformer secondary are that installation is less disruptive (no outage to the customer), and voltage readings are more representative of distribution bus voltage. The Boomerang is available in meter base and pole-mounted versions (and even a 120V plug-in version), so the choice should be based on system model requirements and measurement goals. For transformer secondary monitoring, fixed voltage offsets may be used to adjust for a typical or near-worst-case service voltage drop, or the drop may be modeled as part of the system model if the CVR program is that detailed.
Boomerang Hardware
The Boomerang provides voltage measurements to ANSI C12.20 Class .5 accuracy. This accuracy is maintained over the full outdoor temperature range. To insure longevity, there are no batteries in the Boomerang – supercapacitors are used to provide up to 2 minutes of runtime during an outage. This time is used to send an alert to Canvass, and also to a SCADA system via unsolicited report by exception. The use of supercapacitors gives the Boomerang an expected outdoor operational lifetime of over 10 years.
Each Boomerang includes an integral cell modem and antenna – no separate cell module or external antenna is required. This provides for a very low-profile, unobtrusive form factor and quick installation, especially important in residential locations. All communications are via TCP/UDP through a cell carrier network. Private and public networking options are available; both can be securely attached to Canvass and a SCADA system.
Boomerang Operation
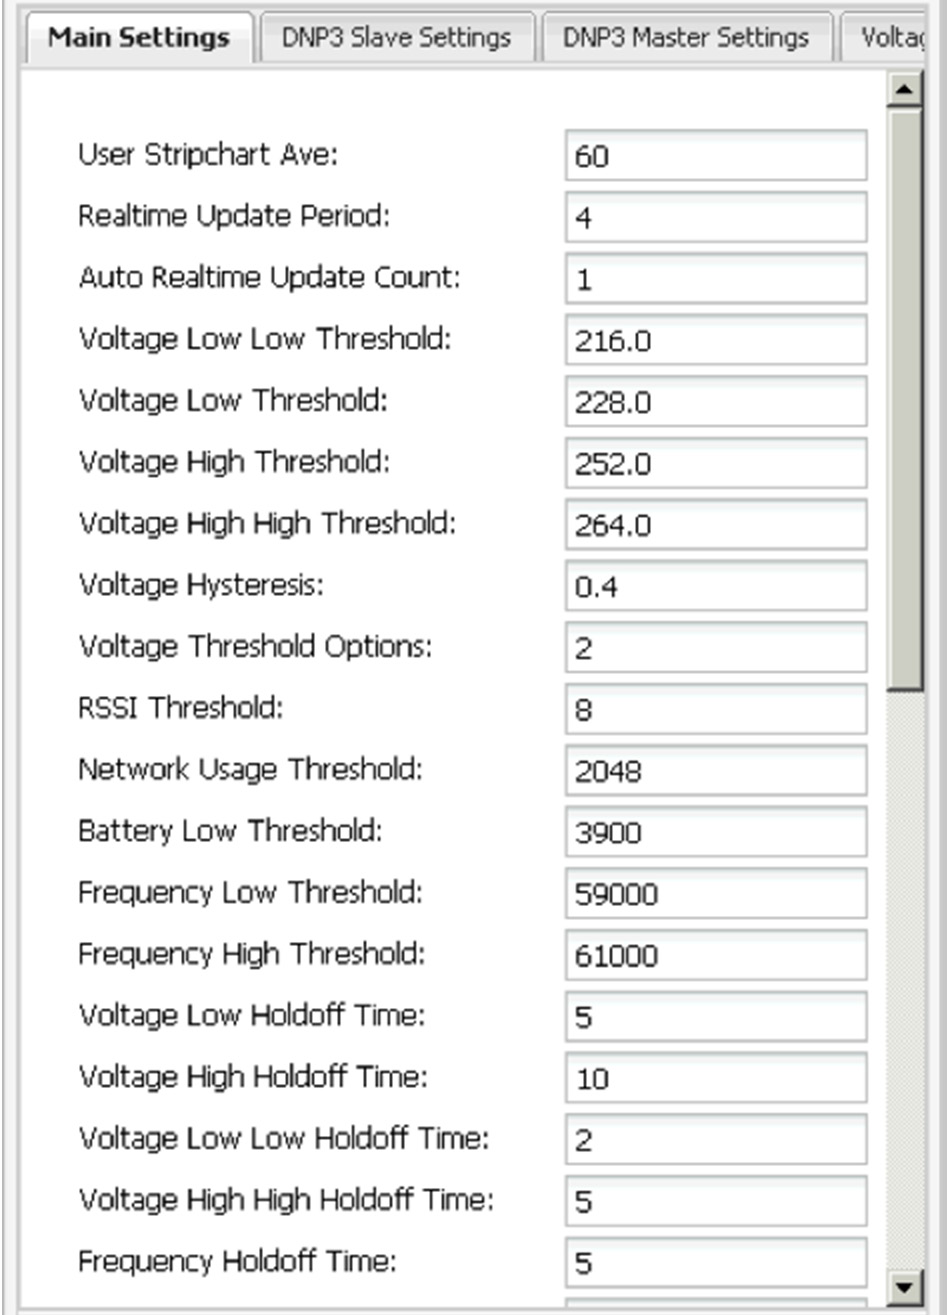
The Boomerang measures voltage (and optionally current and power) each second. It includes a full DNP3 interface, allowing polling for 1 second readings by a SCADA system. With frequent polling (every few minutes, or even once a minute or faster) this information is enough for a CVR system to operate effectively. However, the most effective use of the Boomerang is through the triggered alert system. The Boomerang includes a sophisticated threshold and triggering system, fine-tuned for CVR systems. By making full use of the triggered Boomerang voltage alerts, polling can be minimized, and the Boomerangs can use a very low-rate cell data plan, mostly reporting by exception. The Boomerang settings are shown in Figure 2.
Boomerang Triggering
The Boomerang includes four voltage triggers: lowlow, low, high and highhigh. The lowlow and low triggers operate below the nominal, and fire if the voltage falls below them. The high and highhigh thresholds fire if the voltage rises above the nominal past the thresholds. An adjustable hysteresis is available to avoid chattering, if the voltage is hovering right on a threshold. In addition, a minimum trigger time can be set so that the trigger condition must persist for a minimum time before the trigger actually fires. If the voltage returns to nominal before the minimum time expires, the trigger is not met, and a further crossing restarts the timer from zero.
The most important option for voltage triggering is the averaging window. The Boomerang measures raw RMS voltage with a 1 second RMS period. This raw measurement is usually too fast for a CVR system – the goal is to respond to changes in steady-state voltage, not short-term sags or dips. To smooth out sags and dips, an adjustable averaging window is used to produce an averaged voltage. Typically several minutes long, this sliding window is used to produce a new running average volts reading every second. This preserves the real-time aspect of the reading, but also still utilizing an averaging window for smoother voltage values.
Typical settings for a CVR system (assuming a 120V basis) are 112V, 115V, 123V, and 125V for the lowlow, low, high, and highhigh values. The low and high thresholds can be used for switching decisions, and the lowlow and highhigh values for alerts based on outer limits of desirable voltage under CVR. A 0.4V hysteresis and 5 second minimum trigger time are effective at preventing nuisance triggers.
The averaging window period can be tricky to set. If set too short, voltage regulators may adjust too often, or even before the system has finished responding to previous operations and settled to a new steady-state value. If set too long, voltage adjustments may be delayed, leaving customers with low voltage for many minutes while the system slowly discovers the true line voltage. A value between 3 and 6 minutes is generally a good starting point. Canvass can be used to explore different averaging periods very easily. Since all 1 second values are stored, Canvass can recompute the data with any averaging time, and graph the results. The triggering mechanism can be used to control DNP3 unsolicited report by exception (URBE). With this enabled, the Boomerang can be polled on a much slower basis (e.g. once per hour or even several hours), relying on the Boomerang to report in as soon as a voltage threshold is crossed. This method can dramatically reduce cell data usage – polling once every 5 minutes can range from 5 to 15 MB/month, while URBE mode can be as little as 1 MB/month.
Both the fast one second RMS voltage and slower, averaged voltage reading are available through DNP3, so the CVR system may use either. Another option for both voltage readings is the precision, expressed as the number of decimal places. The Boomerang itself measures to the nearest 0.1V, designed to produce enough resolution to detect single tap changes in a typical voltage regulator or tap-changer. However, with a long averaging window, it’s possible for the exact same voltage reading to be returned several times in a row. Some SCADA systems are designed to assume a “stuck” sensor if the same reading is returned twice in a row, and take the sensor offline. To get around this “feature”, the Boomerang can be set to return two or three decimals of resolution. Although the Boomerang is only specified to 0.1V resolution, the extra two digits are helpful to avoid being declared “stuck” by a SCADA master. An adjustable scale factor may also be set in the Boomerang, to normalize all readings to a common basis (e.g. 120V), even if some are on 240V systems.
Boomerang Unsolicited Report by Exception
Another CVR-specific feature of the Boomerang is periodic URBE. Some CVR systems require more frequent voltage readings during certain periods – e.g. during peak demand windows, or after a voltage regulator has switched. Since most CVR systems are dependent on the SCADA system for data, it’s up to the SCADA system to poll when the CVR program needs data. However, most SCADA systems were not designed for the needs of CVR data collection, and aren’t able to adjust polling cycles based on time of day, or device operations. To get around the SCADA limitations, the Boomerang includes an automatic periodic URBE feature. If a voltage threshold is crossed, the Boomerang will send the normal DNP3 URBE, indicating a voltage excursion. This URBE will trigger a series of new URBEs on a periodic basis, for an adjustable time period. For example, the Boomerang could be set to generate a new URBE every 30 seconds for the next 15 minutes if a threshold is crossed. This data could pass through the SCADA system into the CVR program, thus meeting the CVR data requirement, without any extra polling from the SCADA master. This auto-periodic URBE corresponds to Burst mode when using the Boomerang with Canvass.
The Boomerang can also be configured to send periodic URBEs during a certain time window during the day. For example, if peak demand is from 2pm to 6pm, the Boomerang could send URBEs every 2 minutes during that window, and rely on much slower SCADA polling outside that interval.
In addition to the voltage triggering, the Boomerang includes counters that can be used for basic voltage characterization. A counter is included for each voltage threshold, and each second that the voltage exceeds a threshold increments the counter. Over time, these counters give a good indication of the percent time spent within the nominal band, and outside that band. Collected in aggregate over all Boomerangs, a system-wide view of steady-state voltage level can be gathered, even if no SCADA historian is present, and no CVR data stored.
Canvass
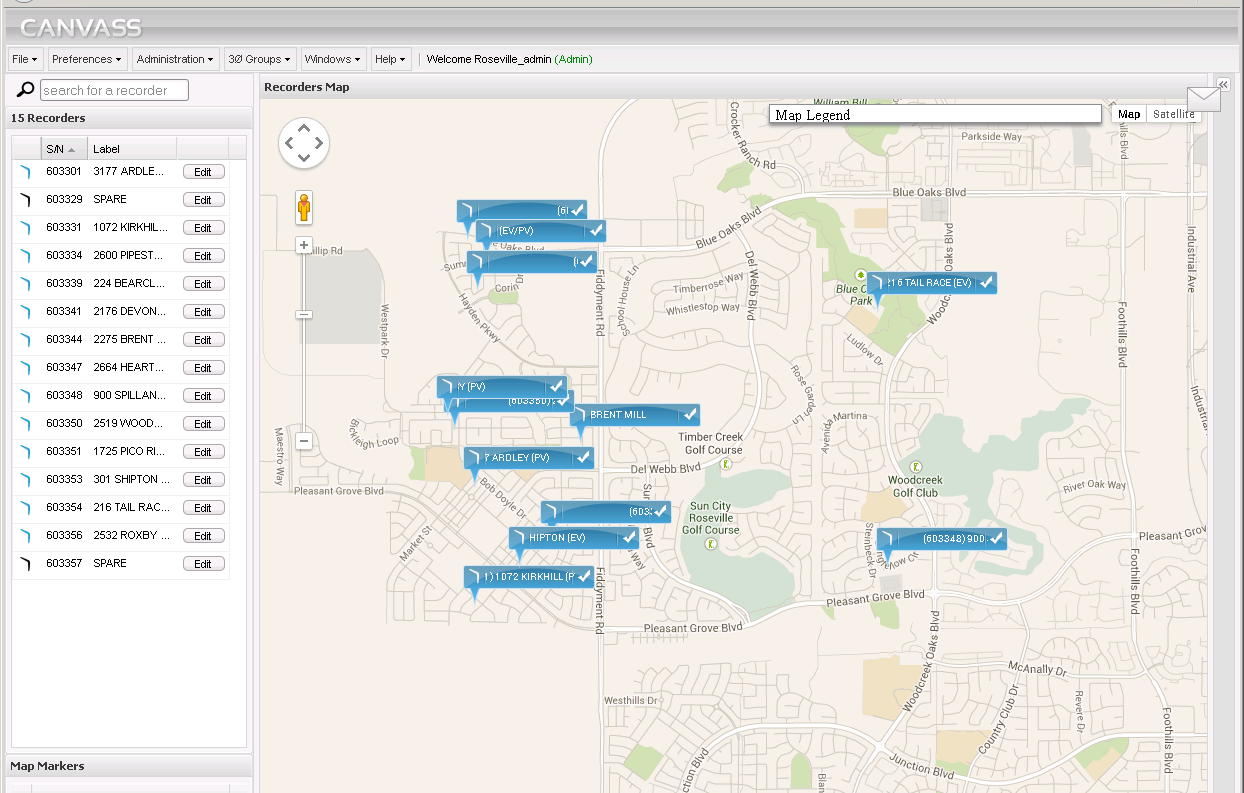
Canvass is PMI’s web-based data storage and analysis system. It stores all Boomerang data, processes alerts for email and SMS distribution, and presents a browser-based graphical interface for analyzing data (Figure 3). Canvass operation is in parallel with SCADA polling of the Boomerang, and is not directly involved in the real-time operation of a CVR system. Canvass’s strength is in profiling a distribution system, tuning CVR parameters, verifying compliance, and long term data storage.
System Profiling and CVR Tuning
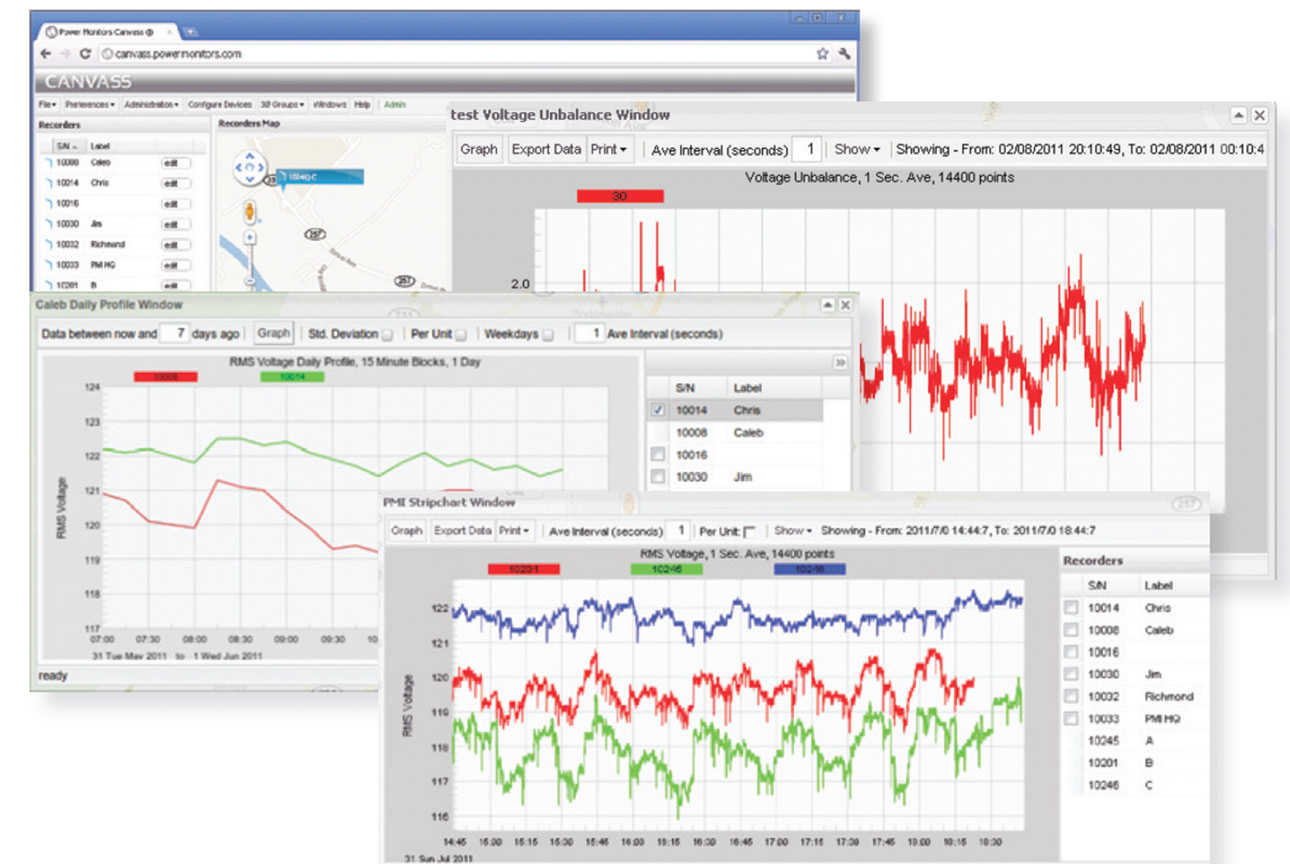
Canvass provides an excellent set of tools for understanding the existing voltage patterns on a distribution system – typical voltage drops, load patterns, voltage regulator operation and load response, etc. Stripchart, histogram, and daily profile graphs show up-to-the-minute incoming data, along with historical data going back years (Figure 4). Seasonal patterns are readily apparent with year-long stripcharts. The statistical analysis computed by Canvass from histogram data allows for an objective comparison of different locations or time periods. Baseline voltage values are easy to determine with monthly or yearly stripcharts and histograms.
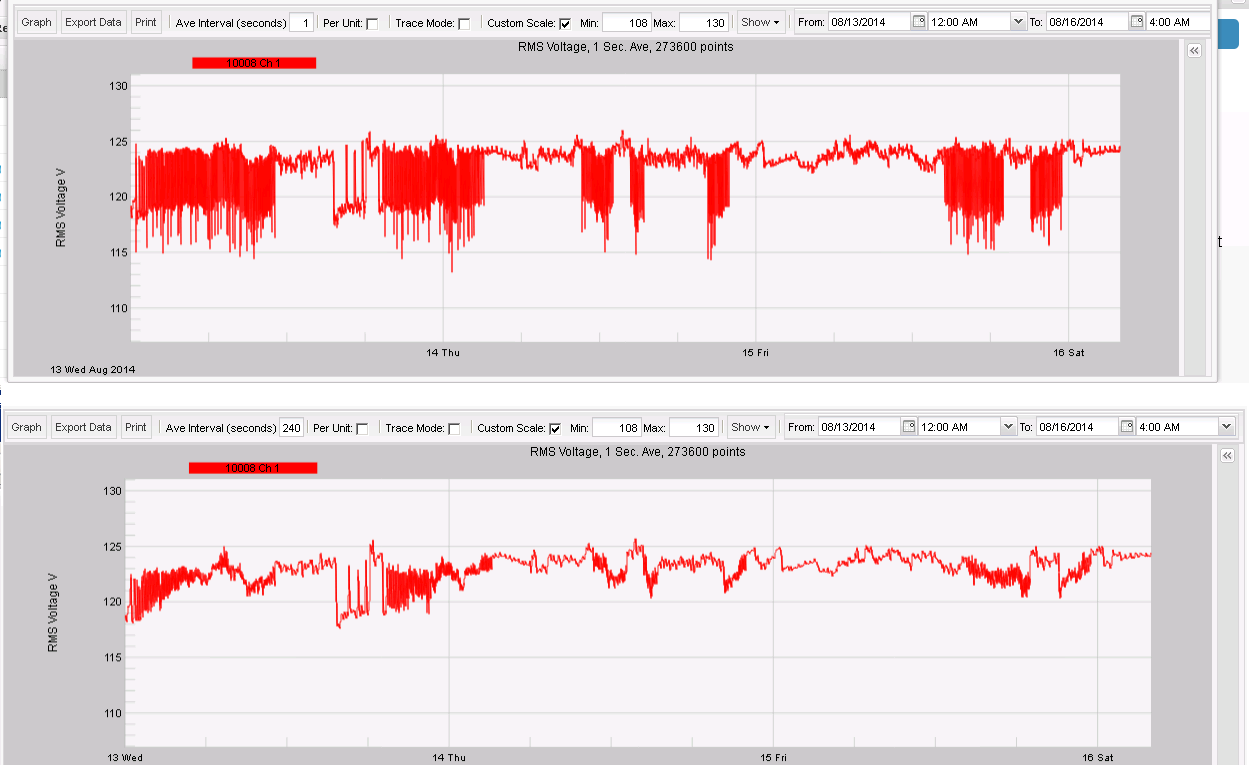
An essential parameter for a CVR system is the averaging window for voltage response. Responding to 1 hour spot voltage readings is much too slow, and responding to 1 second raw values is much too fast. The CVR software should be looking at a windowed, running average voltage, to avoid responding to momentary sags and localized current surges. This is especially important with residential end-of-line monitoring, where a heat pump or other large load may cause very frequent, but very short sags. A running average voltage, updated each second, smoothes out these sags, while still including their effect on the average service voltage. The sliding window method of averaging (vs. a block update once every few minutes) preserves the real-time response needed, and prevents abrupt step changes in readings. Figure 5 shows a 3 day period with raw 1-second readings, and the same time period with a 4-minute rolling average applied. The quick sags to 115V are eliminated, leaving a steady-state baseline low voltage of 118V, and above 120V most of the time.
Choosing the averaging window is an important task for optimizing a CVR system. The system should not respond to frequent voltage sags – this will result over-operating regulation equipment, increasing voltage flicker, and reduce system stability. Since Canvass contains every 1 second reading seen by every Boomerang, all data is present to experiment with different averaging window lengths. Stripcharts and histograms may be generated with different window sizes, to see how volatile the baseline voltage is in each location. The raw 1 second data without averaging can be used to check voltage regulator operation, and watch system voltage stabilization after a tap change. These behaviors are important to understand before fully automating a CVR program.
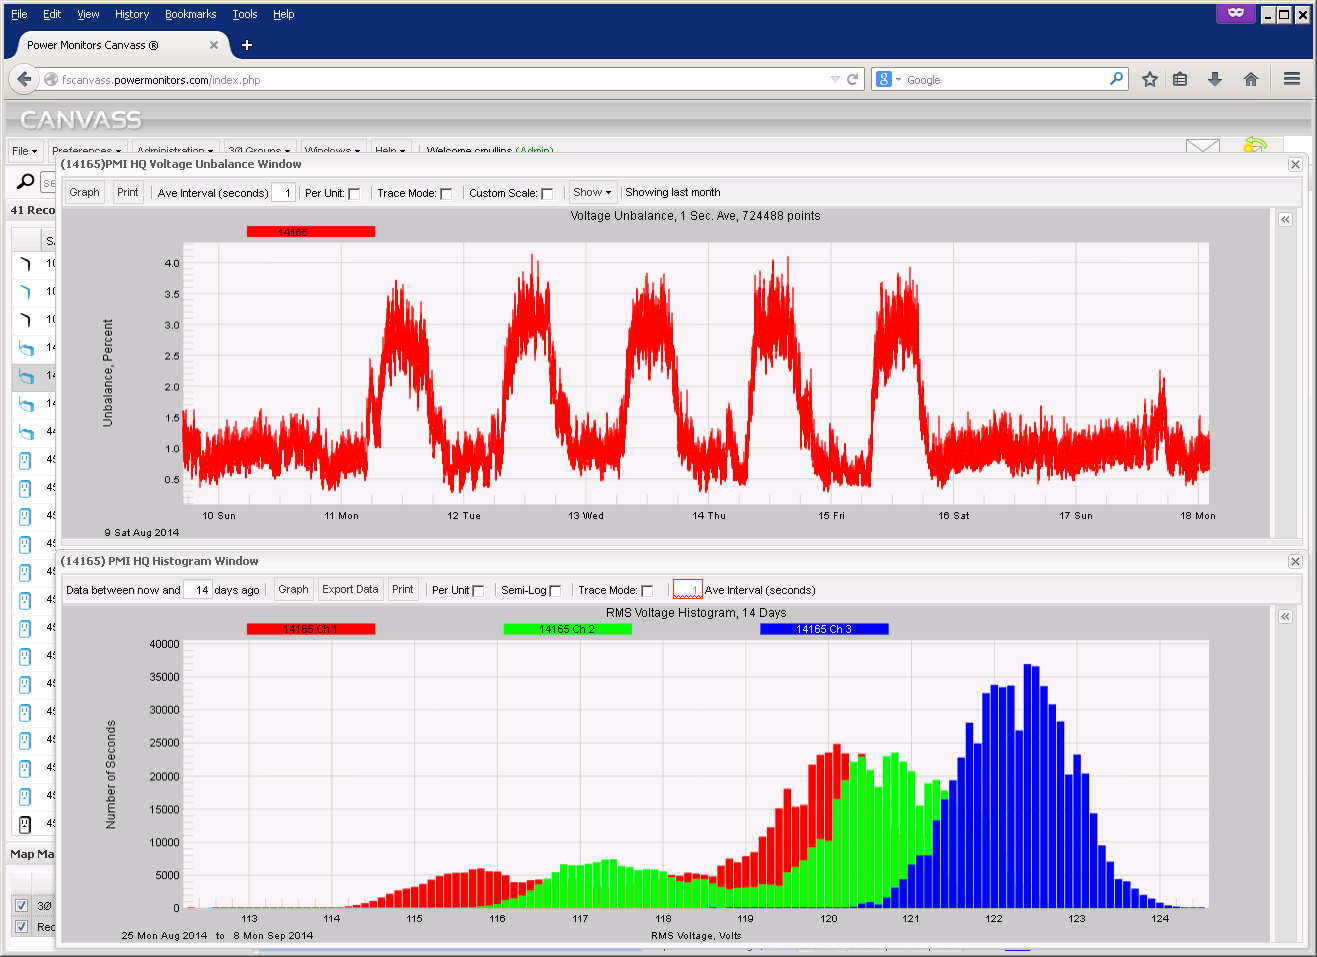
In Figure 6, a 3 phase installation is shown. In the top graph, voltage unbalance is computed by Canvass and graphed for a 1 week period. At this location, the voltage unbalance approaches 4% during the day, and falls to a more benign 1% at night and during the weekend. The histogram of the three phase voltages (lower graph) confirms the unbalance, and also shows that one phase has many fewer sags than the others (blue, compared to red and green). Commercial and industrial locations warrant 3-phase monitoring to insure that voltage unbalance does not become a problem during CVR operation. Voltage unbalance could be a problem even when all phases are over the regulatory minimum voltage.
Data Storage and Reporting
Long term reporting involves keeping at least representative periodic voltage readings for the entire voltage reduction period. This is a challenge for SCADA historian software, but easily handled by the Canvass web-based system. Canvass receives continuous 1 second voltage, current, and power readings from all Boomerangs every few minutes. These readings are stored in PMI’s cloud-based data warehouse. In addition, any trigger condition is reported immediately to Canvass from a Boomerang.
Canvass allows for an export of all 1 second data for each Boomerang into a standard CSV file format. An upcoming Canvass update will allow for custom averaging periods, and min/max/average report. For example, a weekly export could be configured to extract 1 hour average voltages for all Boomerangs into CSV format, and email the result, all automatically. This reporting allows for steady state voltage compliance reporting with hourly average data, while preserving the fine-grained second-by-second information for detailed analysis as needed. Storing the data in the PMI Canvass system removes the IT burden of managing a database, backups, and privacy issues from the utility.
Using Canvass for the hourly reporting requirement removes a significant burden from the SCADA system, or SCADA historian. Polled SCADA readings are likely to be much more frequent than once per hour (e.g. every few minutes, or much more often during voltage tap change operations). Aggregating these readings into regular 15 minute or hour averages require significant post-processing, especially with irregularly spaced incoming values.
Alerts
Canvass receives the new Boomerang status, and immediately sends out email and SMS messages notifications as programmed, with custom distribution lists programmable for each type of event (low voltage, outage, etc.), for each Boomerang. These alerts operate outside of the SCADA system, giving an “out-of-band” method for responding to problems and unusual situations. One suggested setup is to use SCADA URBEs for “normal” exceedances that the CVR system should respond too, and use Canvass alerts for severe problems that require human intervention (e.g. outage, severe under- or over-voltage).
AMI Systems
Although some AMI systems can provide hourly or in some cases 15 minute voltage readings, without finer time resolution through SCADA, CVR is at best non-optimal, and at worst, leaves some users under the regulatory voltage limit. One hour or 15 minute snapshots are useful for roughly judging the kWh savings, but not sufficient for actual control operations.
The data from an AMI system is often difficult to integrate into a SCADA program, and usually siloed into a proprietary system designed primarily for billing and customer service applications. This data may be extractable for reporting purposes, but few, if any, tools exist for analyzing AMI readings on an engineering basis. AMI data would have to be imported into Excel, MATLAB, or other analysis tool to characterize voltage profiles, etc., with whatever time resolution was available.
A further advantage of the Boomerang voltage sensor is the wide variety of form factors available. The Form 2S meter socket version is used in the same location as a traditional AMI revenue meter, but the Boomerang also includes pole-mounted single and 3-phase versions, and even a 120V receptacle form. This allows for consistent operation in 3 phase panels, substations, and points in the system with a utility outlet. The 120V plug-in form is especially useful for early stage experimentation, where it can be quickly moved from location to location to help find the most representative end-of-line, etc.
Conclusion
The Boomerang provides a complete DNP3 interface for seamless SCADA integration, while also working with the cloud-based Canvass system. The multiple Boomerang form factors, ease of use, and dual DNP3/Canvass operation makes it well suited for CVR voltage sensing. The one second data provides valuable detailed information anywhere in the distribution network, stored indefinitely in Canvass. This data can be used to meet reporting requirements, to fine-tune and monitor CVR performance, and to provide email/SMS alerts in case of problems.
