Abstract
In this white paper, I cover the new IEEE Std 519-2014 limits for voltage notching, how these limits are calculated, and how to use ProVision to make the notch measurements. IEEE Std 519-2014 was an upgrade from the previous IEEE 519 introduced in 1992 whose basic purpose was to develop guidelines for developing power systems that included linear and non-linear loads. This document defines limits of acceptable power quality dealing with the harmonics component to the end user. There are two distinct criteria associated with IEEE Std. 519. Most of the standard discusses nonlinear voltages and currents as seen in the frequency domain, mostly in terms of harmonics and interharmonics. A separate section is devoted to a waveform anomaly best analyzed in the time domain, specifically voltage notching. This section is reviewed here, along with the method for making IEEE Std 519 voltage notching measurements in ProVision.
Definition of Voltage Notching
As described by the IEEE, Voltage Notching is a recurring power quality disturbance lasting less than 1/2 cycle that occurs due to the normal operation of power devices such as rectifiers and other nonlinear devices, when the current is changed from one phase to another. With this type of load, current is only conducted during a relatively short portion of the 60 Hz sine wave; this portion is called the conduction angle. If the current is high enough to cause appreciable voltage drop during the conduction angle portion, the sinusoidal voltage waveform will be reduced over this portion, resulting in a “notched” shape. Most loads of this type draw current in every 60 Hz cycle, and thus the notch is relatively constant from cycle to cycle.
Since the notch repeats with a 60 Hz period, by definition it can also be represented in the frequency domain by a pattern of 60 Hz harmonics, so in theory it may be solely analyzed via harmonics. If the notch is identical in every cycle, then only harmonics are generated. Any variations in the notch from cycle to cycle also result in interharmonics. The specific and simple shape in the time domain make this type of distortion easier to quantify from the raw waveform. Some specific causes of notching are arc furnaces, motor speed controls and light dimmers which use thyristors, SCRs, and static power converters.
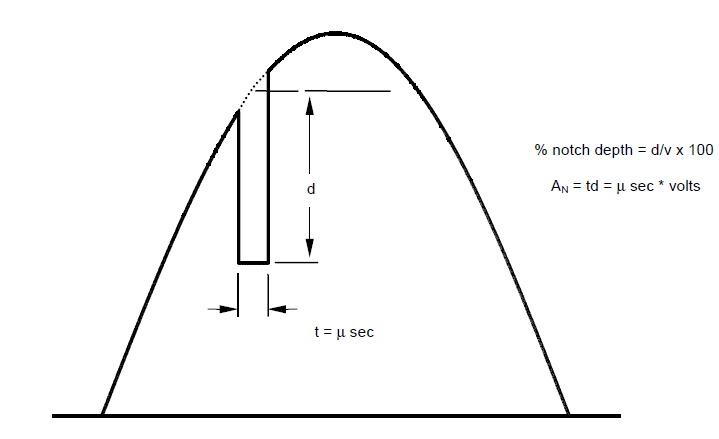
Two very important parameters dealing with notching is notch depth and notch area. Notch depth is defined as the average depth of the line voltage notch from the theoretical sine wave shape. Notch area is defined as the product of the notch depth, in volts, times the width of the notch measured in microseconds. This volt-seconds product represents the area of “missing” piece of the sine wave.
It is important to mention that voltage notches can introduce harmonic and non-harmonic frequencies that tend to be much higher than most other frequencies found on the typical power systems. This is due to the abrupt change in voltage at the beginning and end of the notch – these fast changes have energy at higher frequencies. These higher frequencies without the proper filtering can sometimes create radio frequency interference and can propagate and interfere with digital and analog electronics. In some cases, if the interference is large enough, it can lead to electronic equipment malfunctions. Sometimes voltage notching can create parallel resonances and can even lead to capacitor bank damage or failure. It is important to have a good way of monitoring voltage notching so to keep power quality issues under control.
The new recommended limits introduced by the IEEE in 2014 for notching are as follows in the table below. They are divided into three categories: Special applications, General system, and Dedicated system. Special Applications include hospitals and airports. Dedicated system refers to a situation where a source exclusively supplies a specific user or user load. General system covers most other situations.
| Dedicated Systemb | Special Applicationsa | General System | |
|---|---|---|---|
| Notch Depth | 10% | 20% | 50% |
| Notch Area (AN)c,d | 16400 | 22800 | 36500 |
a Special applications includes hospitals and airports.
b A dedicated system exclusively supplies a specific user or user load.
c In volt-microseconds at rated voltage and current.
d The values for AN have been developed for 480V systems. It is necessary to multiply the values given by V/480 for application at all other voltages.
Two types of limits are given: notch depth and notch area (shown in Figure 1). The notch depth is the average voltage difference between the actual and un-notched sine wave and is expressed as a percentage of the peak voltage. The notch area is the product of the notch depth in volts, and the duration in microseconds. Absolute volt-microsecond values are given, assuming a 480V nominal. The notch area limits must be scaled for other nominal voltages.
As shown the subscripts of table C-1, AN, notch area limit is equal to 22800 associated with a nominal line voltage of 480 volts. If for example the line voltage is 120 volts instead of 480 volts, then (120/480) or 0.25 x 22800 = 5700, so 5700 would be used for AN at 120 volts.
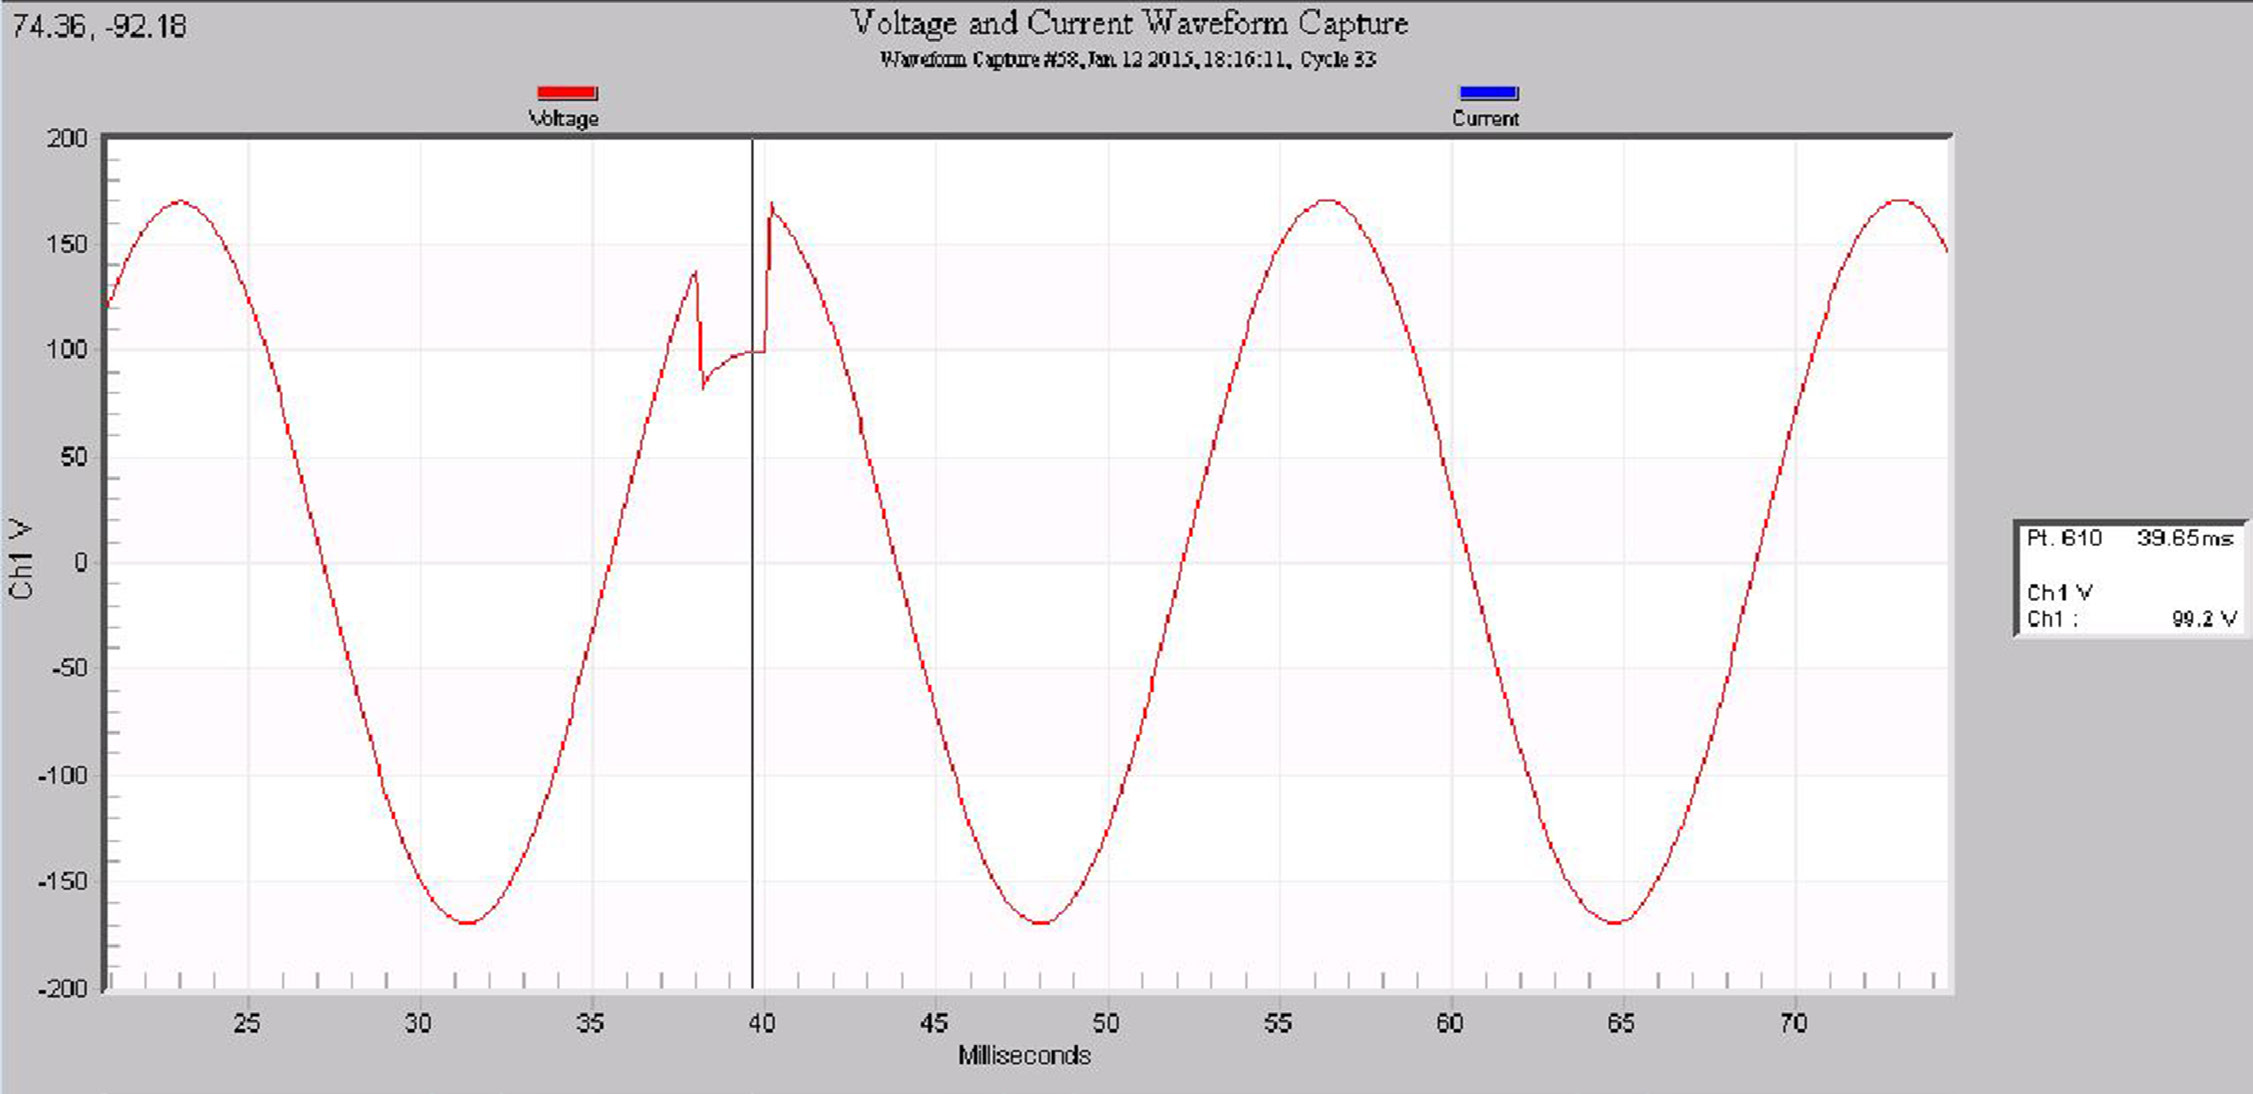
With ProVision, measurement of the notch parameters can be made directly using the Point Table from the captured waveform (see Figure 2). In this figure, a harmonic analysis gives a THD of 17%. A zoomed version is shown in Figure 3. Here, the point annotations are enabled, so that individual data points may be seen. Four measurements are needed – the two points just outside the notch, where the sine wave is “normal”, and the two points just inside the notch (all circled in blue in the figure). The two outermost points are used to calculate the average theoretical sine wave voltage. The two inner points are used to compute the notch width, and also the average notch voltage.
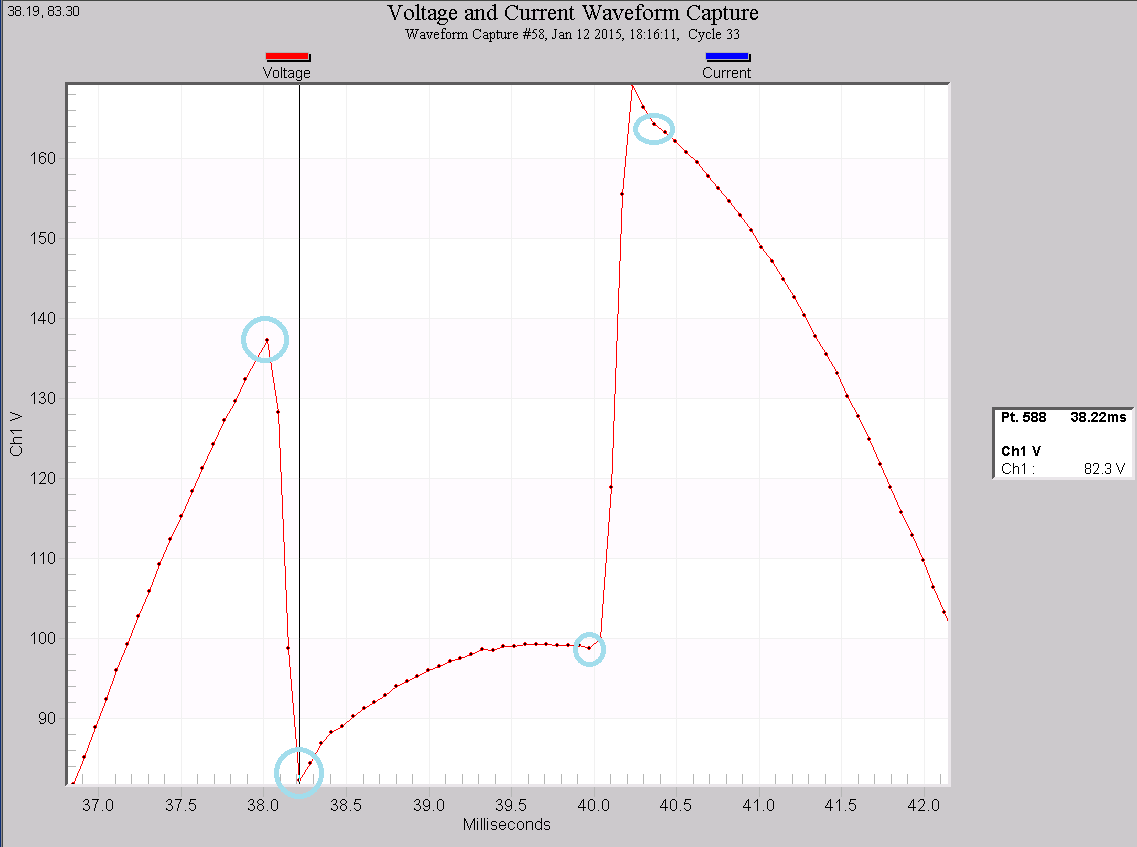
In this example, these four measurements were made right off the point table:
| Voltage | Time, ms |
|---|---|
| 137.3 | 38.02 |
| 82.3 | 38.22 |
| 98.7 | 39.97 |
| 164.2 | 40.36 |
The first and last point are the “normal” points on the sine wave. Averaging 137.3 and 164.2 volts gives 150.75 Volts for the sine voltage. Averaging 82.3 and 98.7 gives 90.5 Volts for the notch voltage. Subtracting results in a notch depth of 60V. With a 120V nominal (167V peak), that’s a 60/167 = 36% notch depth.
The notch width is 39.97−38.22 = 1.75 ms, or 1750 microseconds. The notch area is 60 x 1750 = 158,375, well outside the limit of 5700 for a 120V nominal. This notch exceeds the limits for both notch depth and notch area.
Capturing Voltage Notching
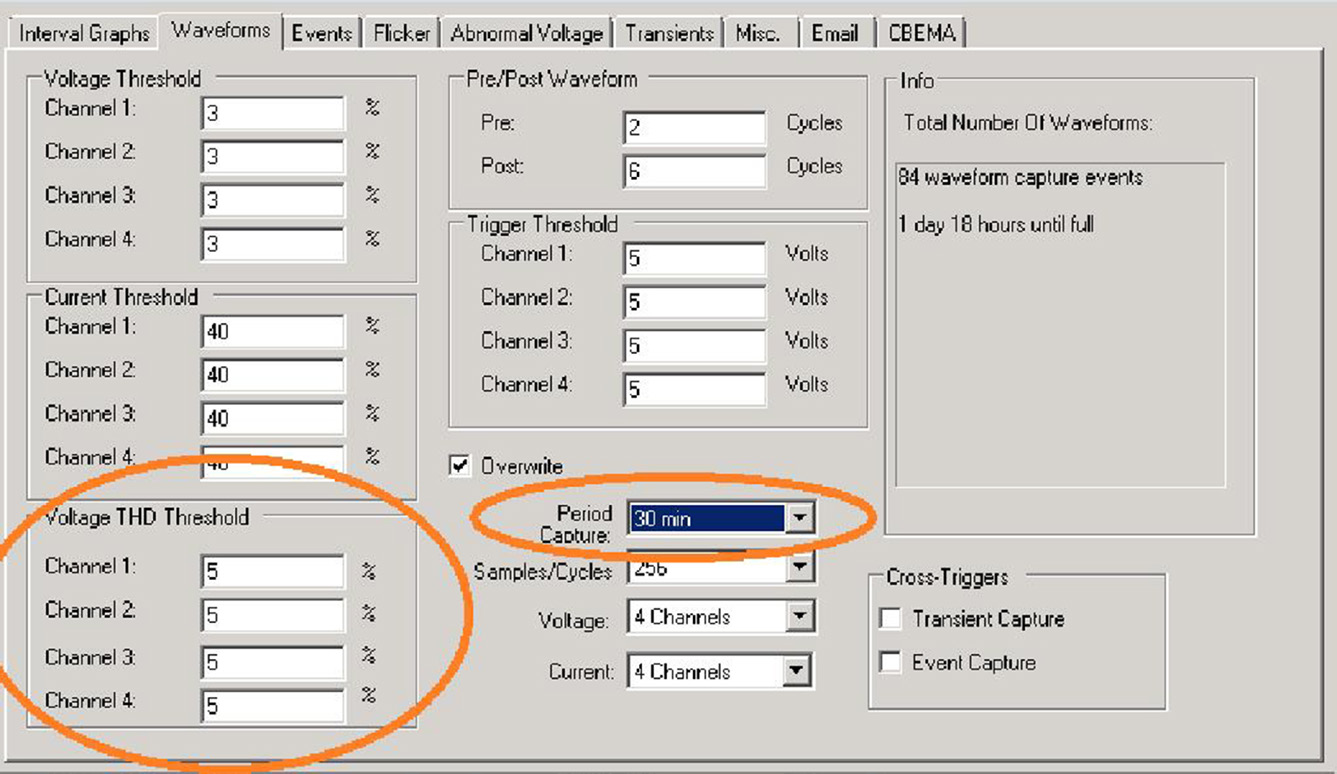
When a Revolution, Eagle, or Guardian is available, periodic triggering should be used. Periodic capture is very helpful for analyzing notching issues. When performing a recording with commutating loads, configure periodic capture to trigger evenly throughout the recording, so that sample waveforms from all parts of the day are available. This helps ensure that the worst-case notch condition (typically the heaviest loading) is caught, and may be analyzed. With a Revolution, THD triggering can also be used to trigger on waveshape changes, which will also capture a change in notching. The setup menu (Figure 4) for the waveform capture shows a good starting place of 5% Voltage THD Threshold and a Capture Period of 30 minutes.
Conclusion
PMI offers the ability in its recorders to enable the operator to record, measure and analyze power quality issues, such as voltage notching, allowing corrective measures to be taken when necessary to maintain a power quality which is in compliance with IEEE recommendations such as the IEEE-519-2014 standard. The latest IEEE Std. 519 gives specific limits for voltage notching, and these are easily analyzed in ProVision.
