Abstract
This white paper covers Out of Limits Reports, their main benefits, and how and when to use them. Out of Limits Reports offer a quick way to gauge power quality in a system because only the fluctuations that are outside of the selected thresholds are displayed. Out of Limits Reports are a type of Event Report and can provide data on either voltage or current. Using the Out-of Limits Report reduces the amount of data that need to be examined by pinpointing unusual occurrences during the recording period.
The primary use of these reports is to show voltage or current data points that fall outside of user-specified limits. Out of Limits Reports are generated solely from stripchart data; the max/min values are one cycle readings, while the average is over the main stripchart interval average. Max/min is good for catching sags and average is good for looking at steady-state voltage drift or problems.
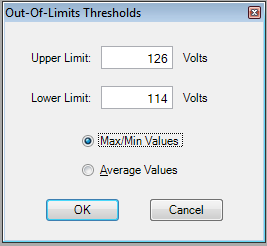
When you select one of these reports from the Reports Menu, a dialog box (Figure 1) appears asking you to specify high and low thresholds from which to define out of limits, and which values the thresholds apply to. For voltage, the report defaults to 126 and 114 volts and to use Average Values. The Current Report also defaults to Average Values. The default amps are based on the formula: (Current Range x 90) / 100 where Current Range is the value used in the recorder initialization. For example, on the 100A range, the default value would be 90 amps.
Provision will produce a report listing the time and date of any readings outside of the values of the specified thresholds. The data values that are outside of the selected thresholds are highlighted.
A stripchart can be correlated with the Out of Limits Report record by using the timestamp. The timestamp can then be used to find the same time period in the stripchart to find out what the readings were before and after the disturbance, giving some indication of the cause of the reading change.
Example
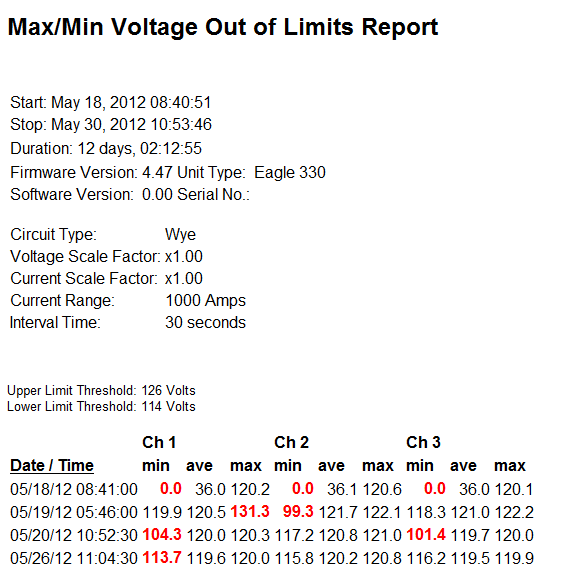
The example report output (Figure 2) shows a Voltage Out of Limits Report using default threshold selections. Only readings whose max or min voltage is outside of the thresholds are shown.
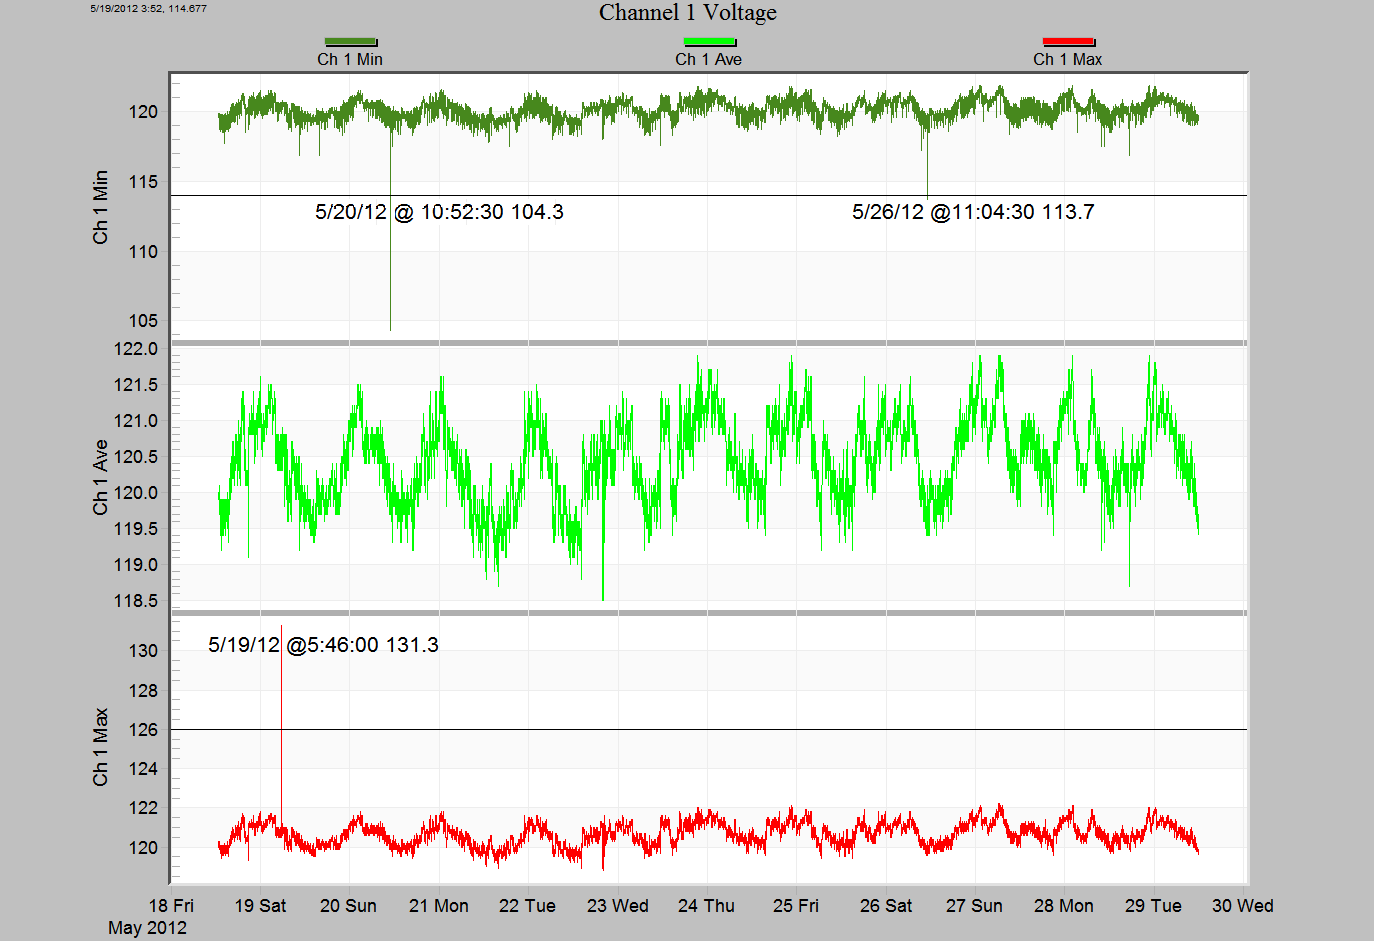
A way to see the reading around an area of interest is to run the Channel 1 Voltage Graph. This graph is found in the Graph menu under the RMS Interval, Channel Summary, Ch 1, Ch 1 Voltage. Like the Voltage Out of Limits report, the Channel 1 Voltage graph shows minimum, average, and maximum voltage but for one channel at a time.
You can add Horizontal Line Annotations at the threshold voltages. Figure 3 shows an example of the Ch 1 Voltage Graph with Horizontal Line Annotations that match the report in Figure 2. Notice that the average voltage crosses the annotated lines at the time indicated in the example report (Figure 2).
This example shows the Ch 1 Voltage Graph the graph can be run for any channel of interest in the recording.
Scale Factor
Sometimes one channel’s values are not in the same range as others causing all readings to be considered out of limits. For example, in a hot-leg delta, one channel’s nominal may be 208V, while the others are 120V. Setting a scale factor of 1/sqrt(3) = 0.577 on the high leg will normalize it to 120V. In this case using the Scale Factor utility can help. There are two ways to use scaling with the Out of Limits reports: change the scale of the channel to be in the range of the limits or set the scaling to 0 to eliminate the channel readings from being considered Out of Limits.
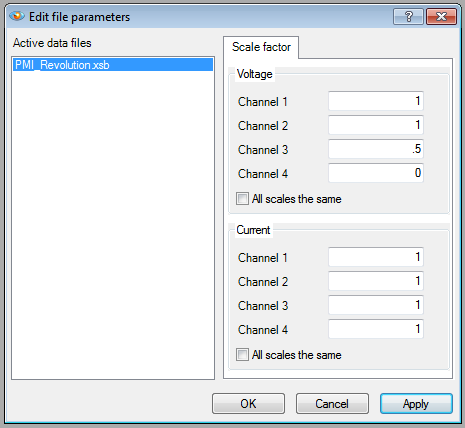
To use the scale factor utility, choose Scale Factor from the Tools menu. Provision will display a dialog box (Figure 4) asking for scaling for the recording by Channel for Voltage and Current. Any changes made to the scale factor are immediately applied to all the reports and graphs for the selected recording. Remember to undo the scaling if you do not want other reports and graphs affected.
Report Export
The Out of Limit reports can be exported in various formats such as Word and Excel. To export the report currently being reviewed, choose the export format from the Export Menu found under the File menu.
Conclusion
- The Out of Limits reports come in two varieties: Voltage and Current.
- The Out of Limits reports shows readings that are outside of user specified thresholds.
- These reports are two of the Event Reports that limit the reported reading to those of unusual occurrences thereby reducing the amount of data that needs to be looked at.
- The timestamp can be used to correlate the Out of Limit Reports with other reports and graphs.
- The Channel specific graph can be used in conjunction with the report to graph all readings. The Horizontal Line Annotations are useful when set to the selected thresholds.
- Scale Factors can be used with a recording to scale a channel to bring its normal values into the selected thresholds or to “zero out” an unneeded channel.
