Abstract
Loose neutrals represent one of the most hazardous and subtle single-phase service issues encountered by utility power quality (PQ) engineers. The condition arises when the neutral conductor connecting the center tap of a distribution transformer to the service entrance becomes resistive, unstable, or fully-open. When this occurs, the resulting unbalanced voltage that the customer receives can lead to erratic load operation, premature equipment failure, and in severe cases- fire or electrocution hazards. This paper describes the electrical mechanisms that cause loose neutrals, the visual signatures they produce, and detection methods. Using PQ Canvass you can take a deep dive into detecting loose neutrals with tools such as the loose neutral report, waveform capture, and particularly the RMS capture view to verify loose neutral conditions in the field.
Overview
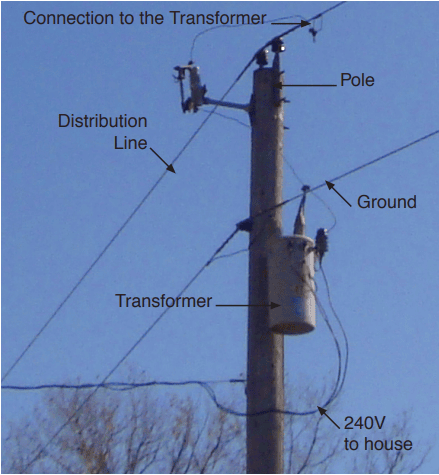
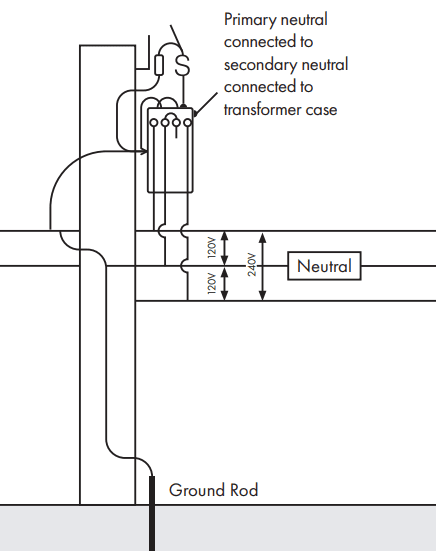
A residential split-phase 120/240v service is derived from a single-phase distribution transformer with a center-tapped secondary winding. The center tap is grounded and serves as the system neutral. Loads connected between either hot leg and the neutral operate at 120v, while 240v appliances span the two hot legs. Figure 1 shows and describes what this system looks like in the field and Figure 2 gives a schematic breakdown of the same system.
Defining Loose Neutral
In normal operation, each 120V load on a split-phase service shares the transformer’s center tap as a solid neutral reference. As shown in Figure 3, a 6 A computer load on one leg and a 4 A light load on the other results in a 2 A neutral current—the difference between the two legs. Each load sees a stable 120V, maintained by the low impedance of the transformer center tap acting as a fixed voltage divider.
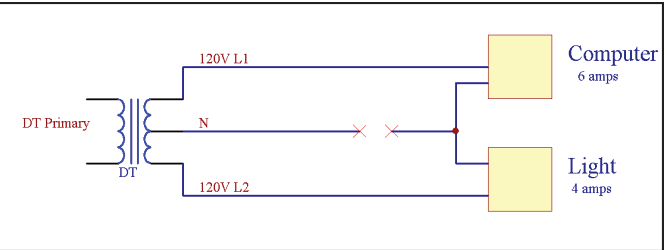
However, when the neutral becomes open (indicated by X marks in the figure), the return current has no direct path. The two loads become effectively wired in series across the full 240V winding. The center tap no longer sets the midpoint voltage, and instead, the voltage divides based on the relative impedances of the loads. In this case, the 6 A light receives approximately 144V, and the 4 A computer drops to about 96V. The current is the same through both loads, but the voltage is no longer balanced.
If the loads are close in size, the imbalance may be small and hard to detect. But with greater mismatch, voltage swings increase, causing symptoms or equipment damage. In many cases, these conditions are intermittent, making waveform and RMS data essential for diagnosis.
Identifying Loose Neutrals
In practice, many complaints from residential customers—such as flickering lights, frequent UPS activation, or premature failure of surge protectors—can be traced to a deteriorating neutral. Field inspections should include a check for burnt or corroded connections at the weatherhead or meter base, and in some cases, ground potential rise may be evident due to current flowing through the grounding electrode system. Low-resistance neutral-to-ground bonds at the transformer and service entrance can mask symptoms or mitigate the severity, but do not eliminate the hazard.
When a loose neutral condition is present, the system loses its fixed reference point, allowing the effective center tap voltage to float. This “artificial neutral” shifts in response to dynamic load changes, causing one leg to rise above 120V while the other drops below. These swells and sags can reach extreme levels, especially with high load imbalances, and often manifest as fluctuating brightness in lights or failure of sensitive electronics. During full open-neutral conditions, voltages on either leg can approach the full 240V or collapse to near zero (Figure 4), depending on relative loading.
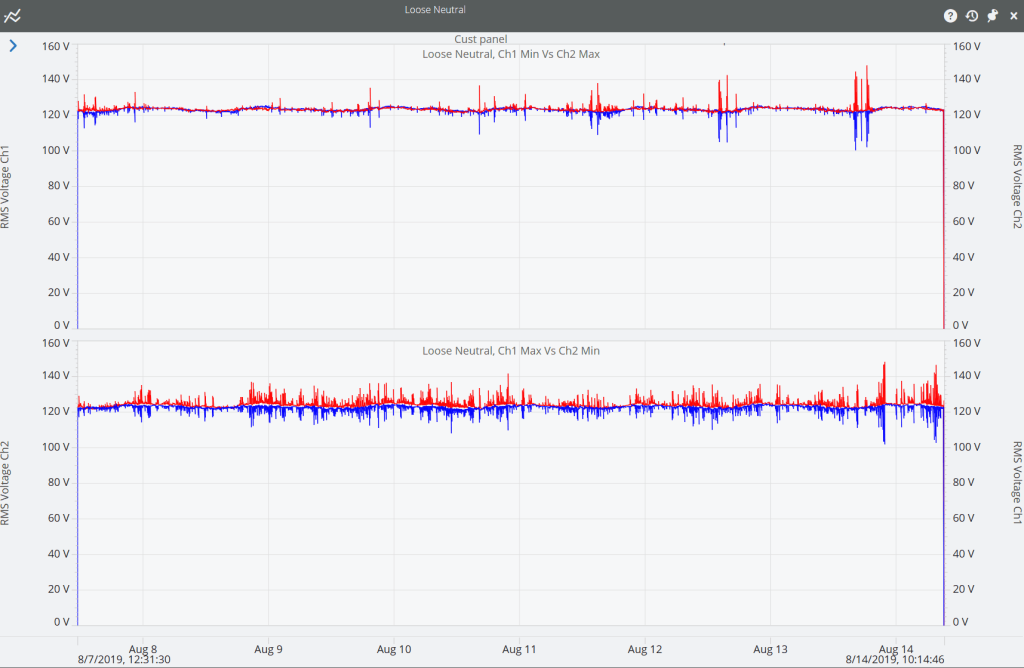
PQ engineers should be aware that traditional voltage stripcharts may not clearly show the issue, especially if the imbalance is modest. However, simultaneous swells and sags on opposite legs, particularly when their sum remains close to 240V, are diagnostic indicators. PMI’s Loose Neutral Graph in ProVision and PQ Canvass is designed to visualize this exact pattern. The graph plots both line-to-neutral voltages with a mirrored reference, clearly identifying the characteristic signature of a neutral break.
PMI’s software includes a dedicated Loose Neutral Report tool, which operates by evaluating three parameters: the voltage difference between the legs, how close their sum is to 240V, and the duration that the condition persists. This method allows a fast scan of multi-day recordings for potential loose neutral events. An example of the Loose Neutral tool in PQ Canvass can be viewed in Figure 5. While useful, it is less sensitive than waveform or RMS capture view, as it relies on one-second RMS samples.
Using RMS Waveform Capture
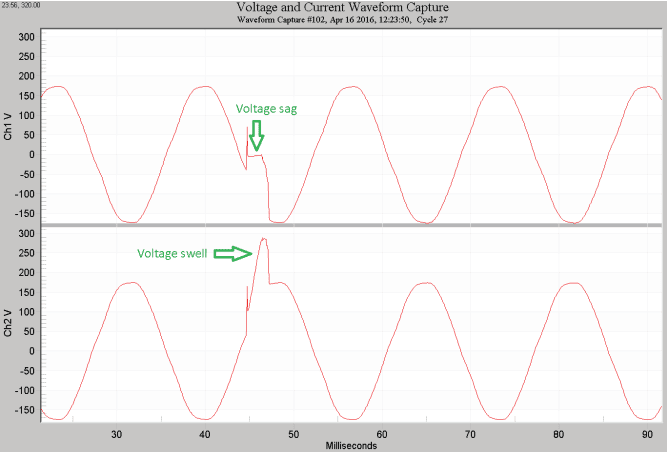
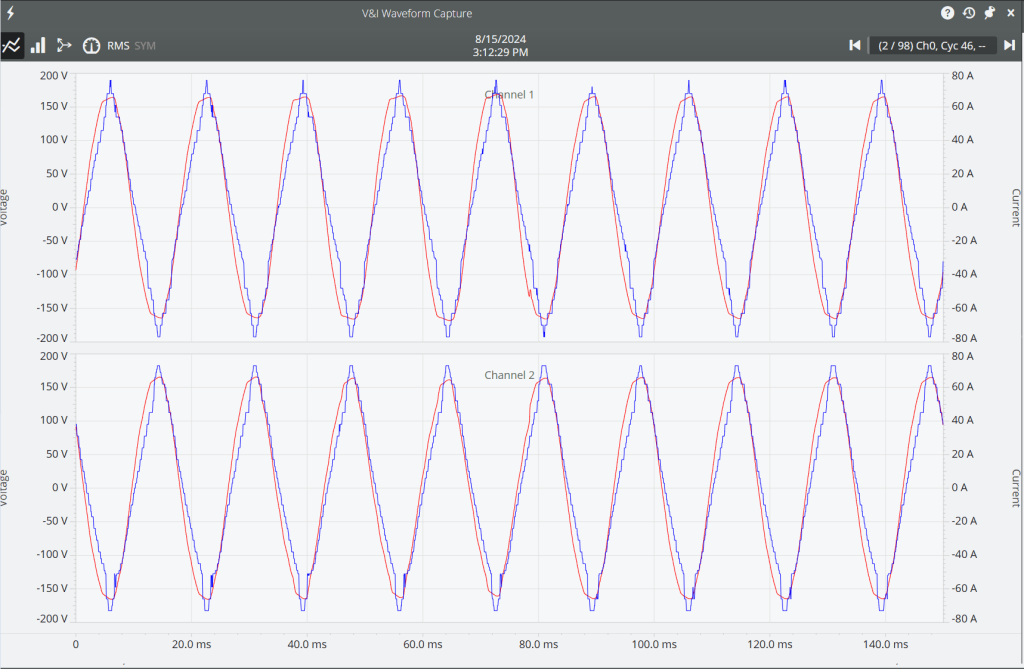
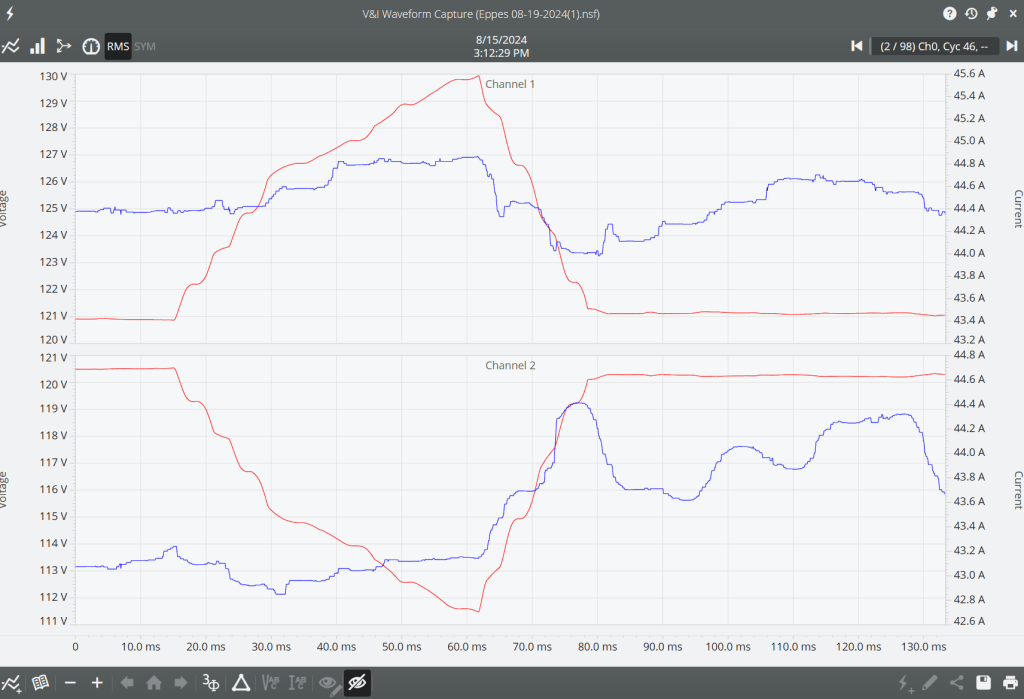
Another valuable visualization is the RMS Capture Graph, which can reveal momentary leg voltage shifts not easily seen in the standard stripchart. The waveform viewer in PQ Canvass provides additional confirmation, showing instantaneous voltage transitions where one leg waveform sharply increases and the other decreases, maintaining a constant phase-to-phase voltage. At first, it might not be obvious that there is a loose neutral when viewing the waveform (Figure 6), however, when you change from waveform view to RMS Voltage view, the loose neutral becomes very apparent. Figure 7 shows the same waveform capture as Figure 6, but in the RMS Voltage view.
In Figure 7 you can clearly see the CH1 and CH2 RMS voltage right around 121V each. Once the loose neutral event occurs, CH1 spikes up to 130V, and CH2 sags down to 112V. Note that both before and after the event, the CH1 and CH2 voltage sums are equal- 242V, a clear sign of a loose neutral.
Conclusion
Utility engineers should always consider a loose or open neutral in any residential PQ investigation, especially if flickering lights are reported without significant sag events. Use the Loose Neutral Graph and RMS waveform tools in PMI’s PQ Canvass to diagnose the issue conclusively. Once repairs are made, follow-up recordings should confirm the restoration of stable, balanced line-to-neutral voltages.
Loose neutral conditions present a significant safety and reliability concern. PMI’s suite of tools—field recorders, plug-in monitors, and visualization software—provide a comprehensive method to detect and verify these faults. Visualizing the problem requires not just looking at traditional voltage strip-charts, but leveraging mirrored leg graphs, waveform captures, and the RMS capture view in particular. Early detection and repair can prevent customer equipment damage, reduce utility liability, and enhance public safety.
