Abstract
Power Monitors, Inc. Vision handheld power quality measuring device features an easy to use web interface, so that the Vision can be used anywhere there is access to a network connection. The interface itself is hosted directly on the Vision unit; it is not a website on a remote server. This makes it possible to view live data from the Vision remotely. It is also possible for multiple people to view the interface at the same time. The following describes how to navigate to the Vision’s web interface and how to use the interface with the computer keyboard, which browsers can be used to access the Vision’s interface, and demonstrates using the Vision to view recorded waveforms.
Navigating to the Web Interface
To use the web interface, the Vision must have been purchased with the Ethernet option, and must be plugged in. The IP address of the Vision is dynamic, unless configured by the user with a static IP address. Unless otherwise configured, the web interface will not be accessible outside of the local network. This means that the Vision is not preconfigured to allow access from the Internet.
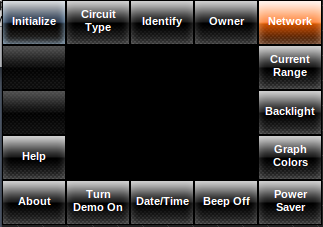
On the Vision unit, enter Data mode by pressing the data mode button (Figure 1) twice. Once in Data mode, scroll to “Settings” (Figure 2) and press enter. From settings, scroll to “network” (Figure 3) and press enter. Copy the number in the field labeled “IP Address” (Figure 4). This is the Internet address of the Vision unit. In a web browser, type the Vision’s IP address and press enter. An example of what the full address should look like is 192.168.1.132. This will open the Vision’s web interface.

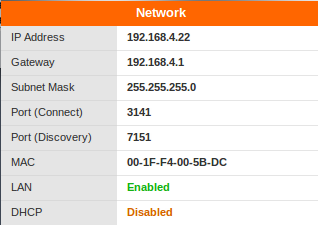
The IP address is the same as the one used to connect to ProVision, which can be viewed at the same time as the Vision.
Supported Browsers
All recent browsers, including Internet Explorer (IE) 9, currently support the Vision’s web interface. IE 6, 7, and 8 do not support the interface.
Vision Web Interface Key Mappings
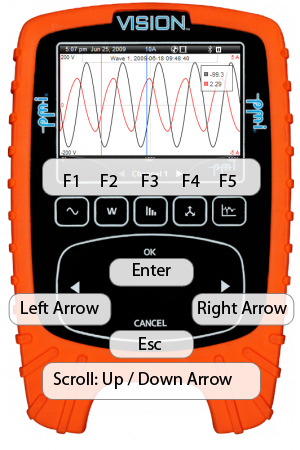
In the web interface, keys on the keyboard map directly to buttons on the unit itself. F1 – F5 on the keyboard are used to navigate between the different modes on the Vision and are mapped as follows:
- F1: Puts Vision into Waveform mode.
- F2: Puts Vision into Meter Display mode.
- F3: Puts Vision into Harmonics mode.
- F4: Puts Vision into Vector mode.
- F5: Puts Vision into Data and Settings mode.
The enter key on the keyboard corresponds to the “ok” button on the Vision. “Esc” corresponds to “cancel”. To scroll, press the up and down arrow keys. The left and right arrow keys correspond to left and right on the Vision. See Figure 5 for key mapping.
Pressing any of the function keys twice will bring up the perimeter menu. The perimeter menu was designed with ease of use in mind, and allows for fast navigation of the Vision’s interface. Relevant menu options are displayed in boxes along the edge of the screen, with a preview of the current menu option in the center of the screen. The currently selected option is highlighted in blue. To navigate the perimeter menu, press the up or down arrow keys. Once the desired option is selected, press the enter key. Selecting the “help” option will bring up a help screen with information about the current mode that the Vision is in, as well as general help, information on the interface, and usage tips.
Viewing Recorded Waveforms
To view snap-shots of recorded data, press F5. This will put the Vision in Data and Settings mode. The first saved voltage waveform capture is shown by default. To switch between channels while viewing a waveform, press the left or right arrow keys. To view other saved waveform captures, press F5 again. From the perimeter menu, select “waveforms” and press enter. Select either “Graph I” for current waveforms, “Graph V” for voltage waveforms, or “Graph V & I” for both voltage and current waveforms, then press enter. Select the desired waveform on the date and time and press enter.
Zooming on a Recorded Waveform
While viewing a recorded waveform, the zooming option is available. Zooming in the web interface works exactly the same way as it does on the Vision unit, except that the up and down arrow keys are used in place of the scroll wheel. While viewing a recorded waveform in Data mode, press the down arrow. This will put the device in trace mode and a zoom cursor will appear. The down arrow moves the zoom cursor to the right and the up arrow moves the cursor to the left. Move the zoom cursor to the position to start zooming and press enter to lock the cursor in place. A second zoom cursor will appear on screen next to the first cursor. Press the up and down arrows again to set the position to zoom to and press enter to zoom.
NOTE: Pressing the left or right arrow keys while in zoom mode will cancel the zoom and exit zoom mode.
Conclusion
The Power Monitors, Inc. Vision web interface makes it easy to measure power quality anywhere there is a network connection. The web interface has exactly the same features as the Vision unit itself. An interactive online demonstration of the Vision can be scheduled by calling 800.296.4120.
