Abstract
ProVision lets the user save a specific set and layout of graphs and reports in a View, which can easily be reused for any data file. The default View is launched when a file is opened, but more complex Views may be defined to automatically open graphs and reports for specific types of analysis. For example, different Views for voltage sag analysis, photovoltaic monitoring, flicker, etc. may be saved. Using Views saves time when performing complex file analysis, and provides consistency in the analysis process.
Creating and Using Views
A customized arrangement of reports and graphs can be saved to a View, allowing it to serve as a template which can be reused later. The View defines all open reports and graphs, their positions and grouping in the workspace, and what types of data are displayed within them. If a recording file is opened using a specific View, the workspace will be populated with the graphs and reports corresponding to that View using the data from the selected recording. If the View contains an element of a collection, such as a waveform capture, ProVision enumerates the available data and will show a prompt for which one to use.
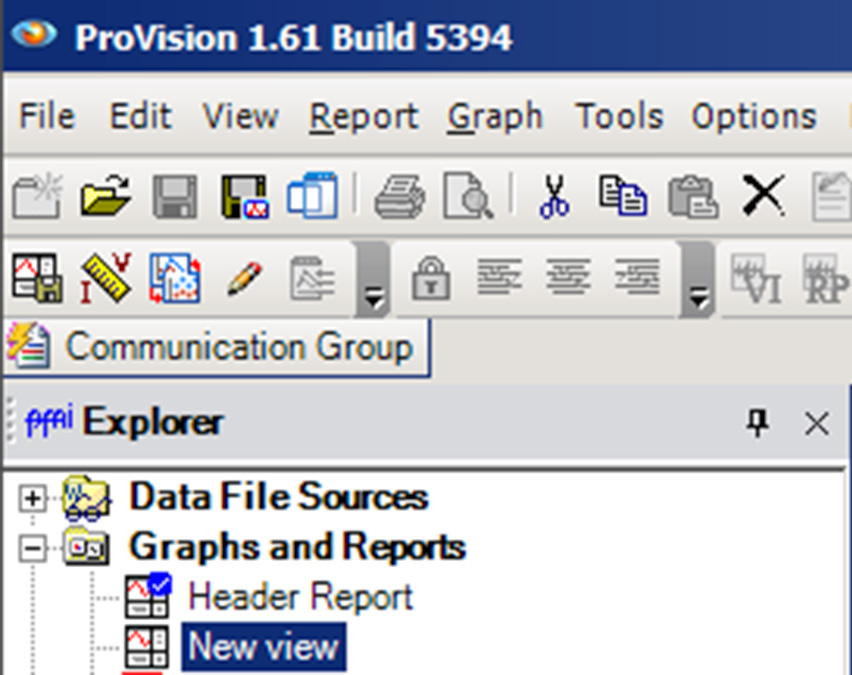
Views are listed in the Graphs and Report nodes in the Explorer pane, as shown in Figure 1. To open a recording using a selected View, simply check the checkbox next to the recording in the Explorer Tree, then double-click the View. This automatically opens the selected View using the recording as a data source.
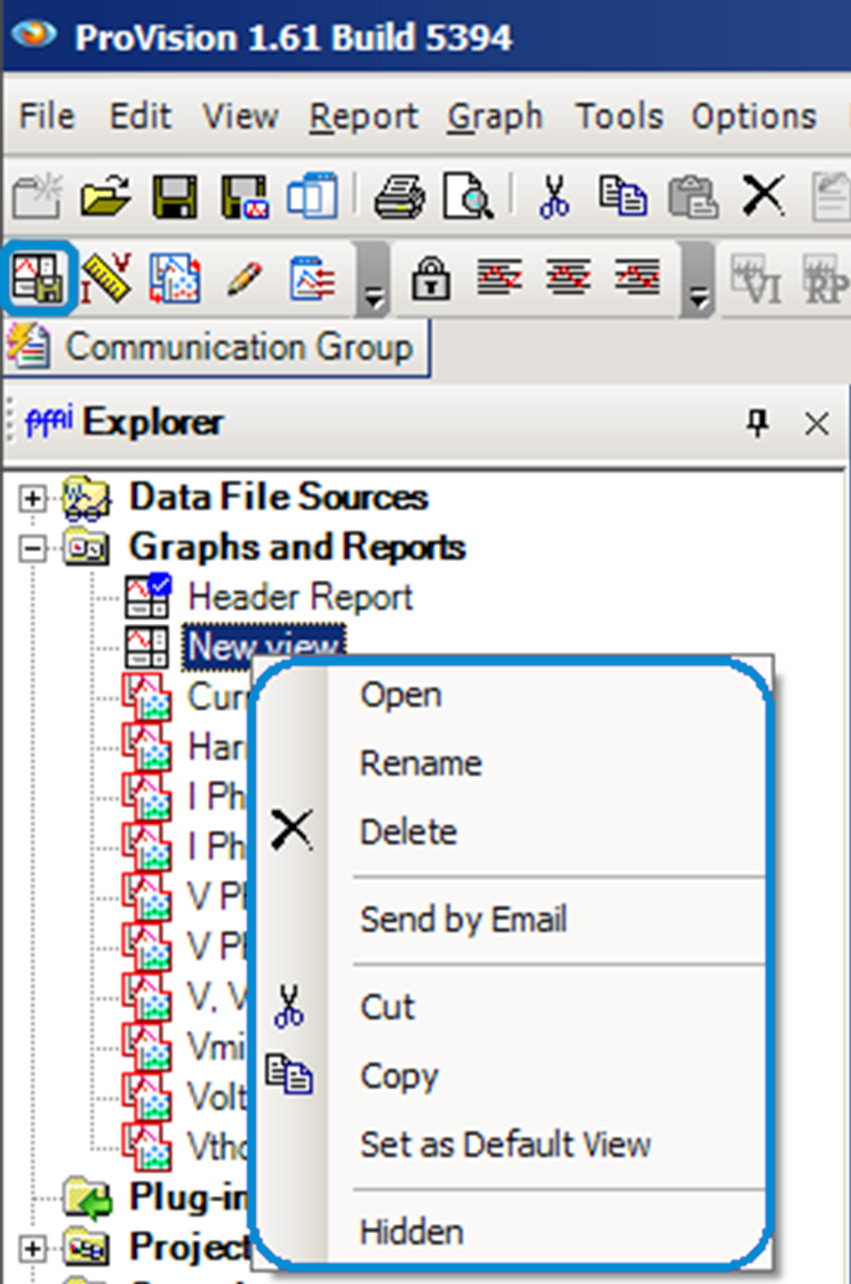
To save a View, select the Capture View (shown in Figure 2) button on the toolbar. This adds the View to the Graphs and Reports node with the name “New View”. The View can be renamed by right-clicking its node, and from the resultant context menu, choosing Rename and specifying a new name. Any open graphs and reports, along with their exact arrangement in the workspace, will be saved in the View. Launching the View later (with the same data file or any other file) will launch the same set of graphs and reports with the currently open file.
One View is always marked as the default View. Double-clicking the recording in the Explorer Tree itself will open the recording using the default View. The default View with a fresh ProVision installation is the Header Report. This default can be changed by right-clicking the desired View, and, from the resultant context menu, selecting “Set as Default View” (Figure 2). Note the default View is designated with a small blue checkmark displayed on its icon. Changing the default View can easily expedite accessing the desired data in a recording.
Examples of Useful Views
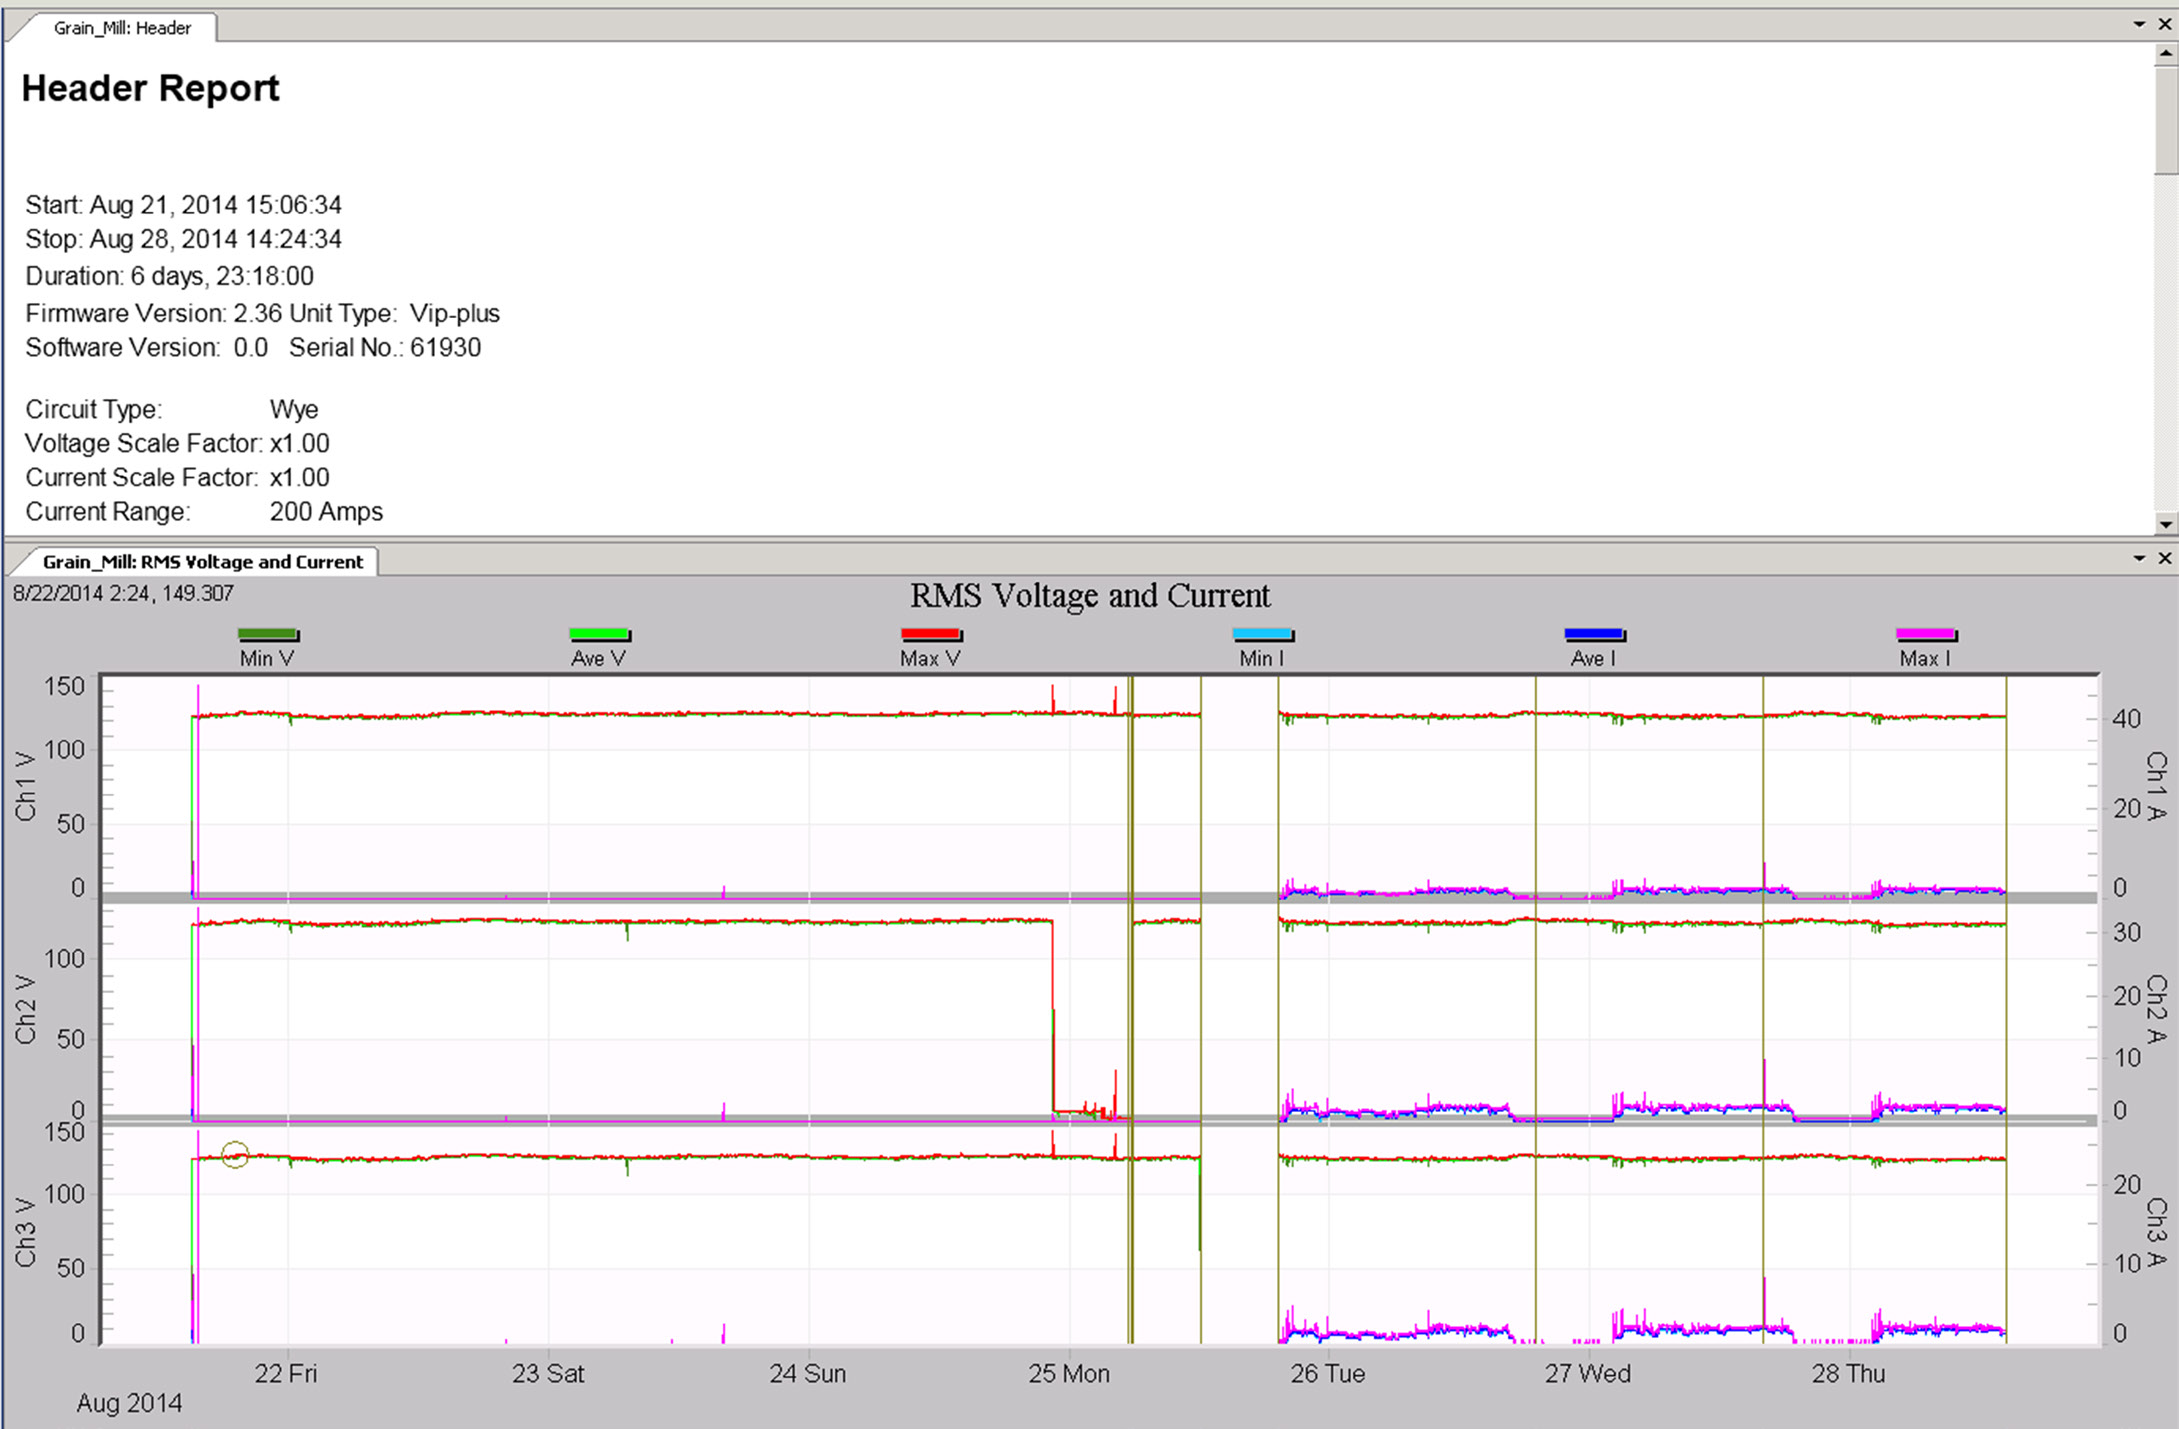
A good non-specific beginning View is shown in Figure 3. Here, the Header Report, and the RMS Voltage and Current stripcharts are displayed, with just the top third of the header visible. The RMS stripchart is a good starting point for any investigation, and the header report is important for identifying the current range, recording time, etc. This is especially useful if the file was recorded by another person, and you don’t already know the details of the recording session. This View makes a good default instead of the stock default View.
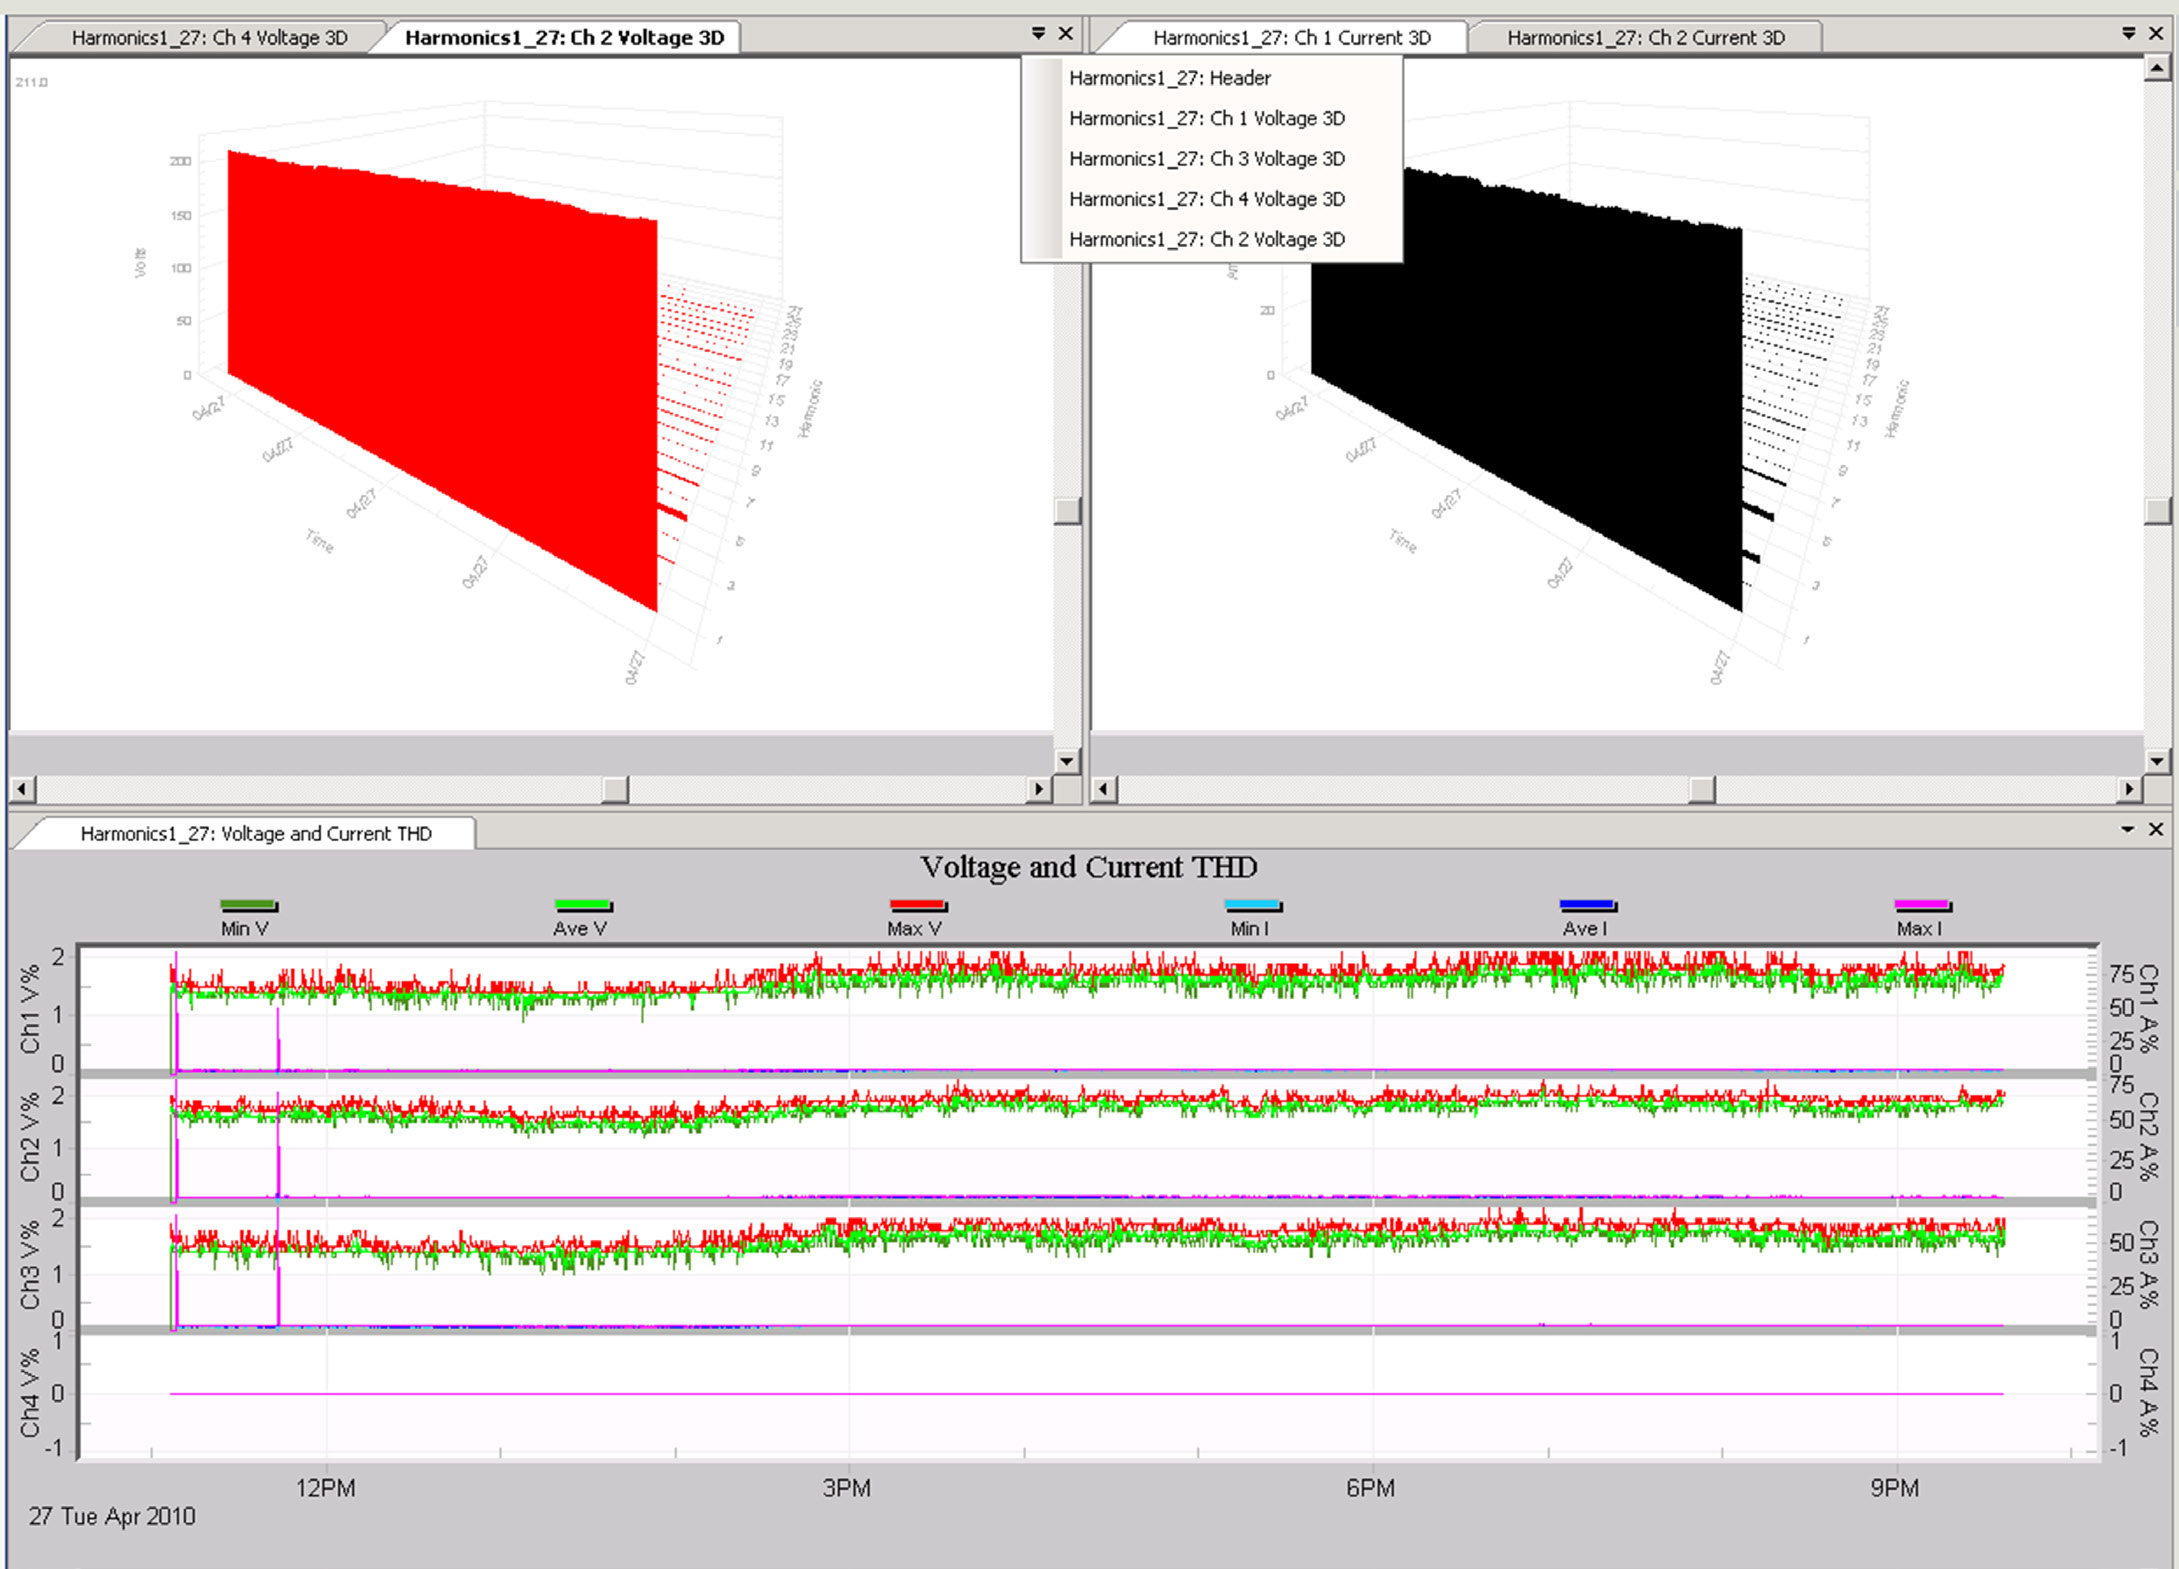
Specialized Views for specific investigations can be useful. For example, a harmonic analysis often begins with looking at THD stripcharts, along with the 3D harmonic magnitude plots. A saved View with all four channels of voltage and current 3D graphs, plus the THD stripchart allows loading 9 graphs at once. In Figure 4, the bottom stripchart trace shows voltage and current THD, while the top two square areas are voltage (left panel) and current (right panel) 3D plots. Each square panel contains a 3D plot for each channel. There are too many graphs to display as separate tabs; instead clicking on the small inverted triangle brings up a list of graphs in each panel, as shown in the figure for the voltage 3D plots.
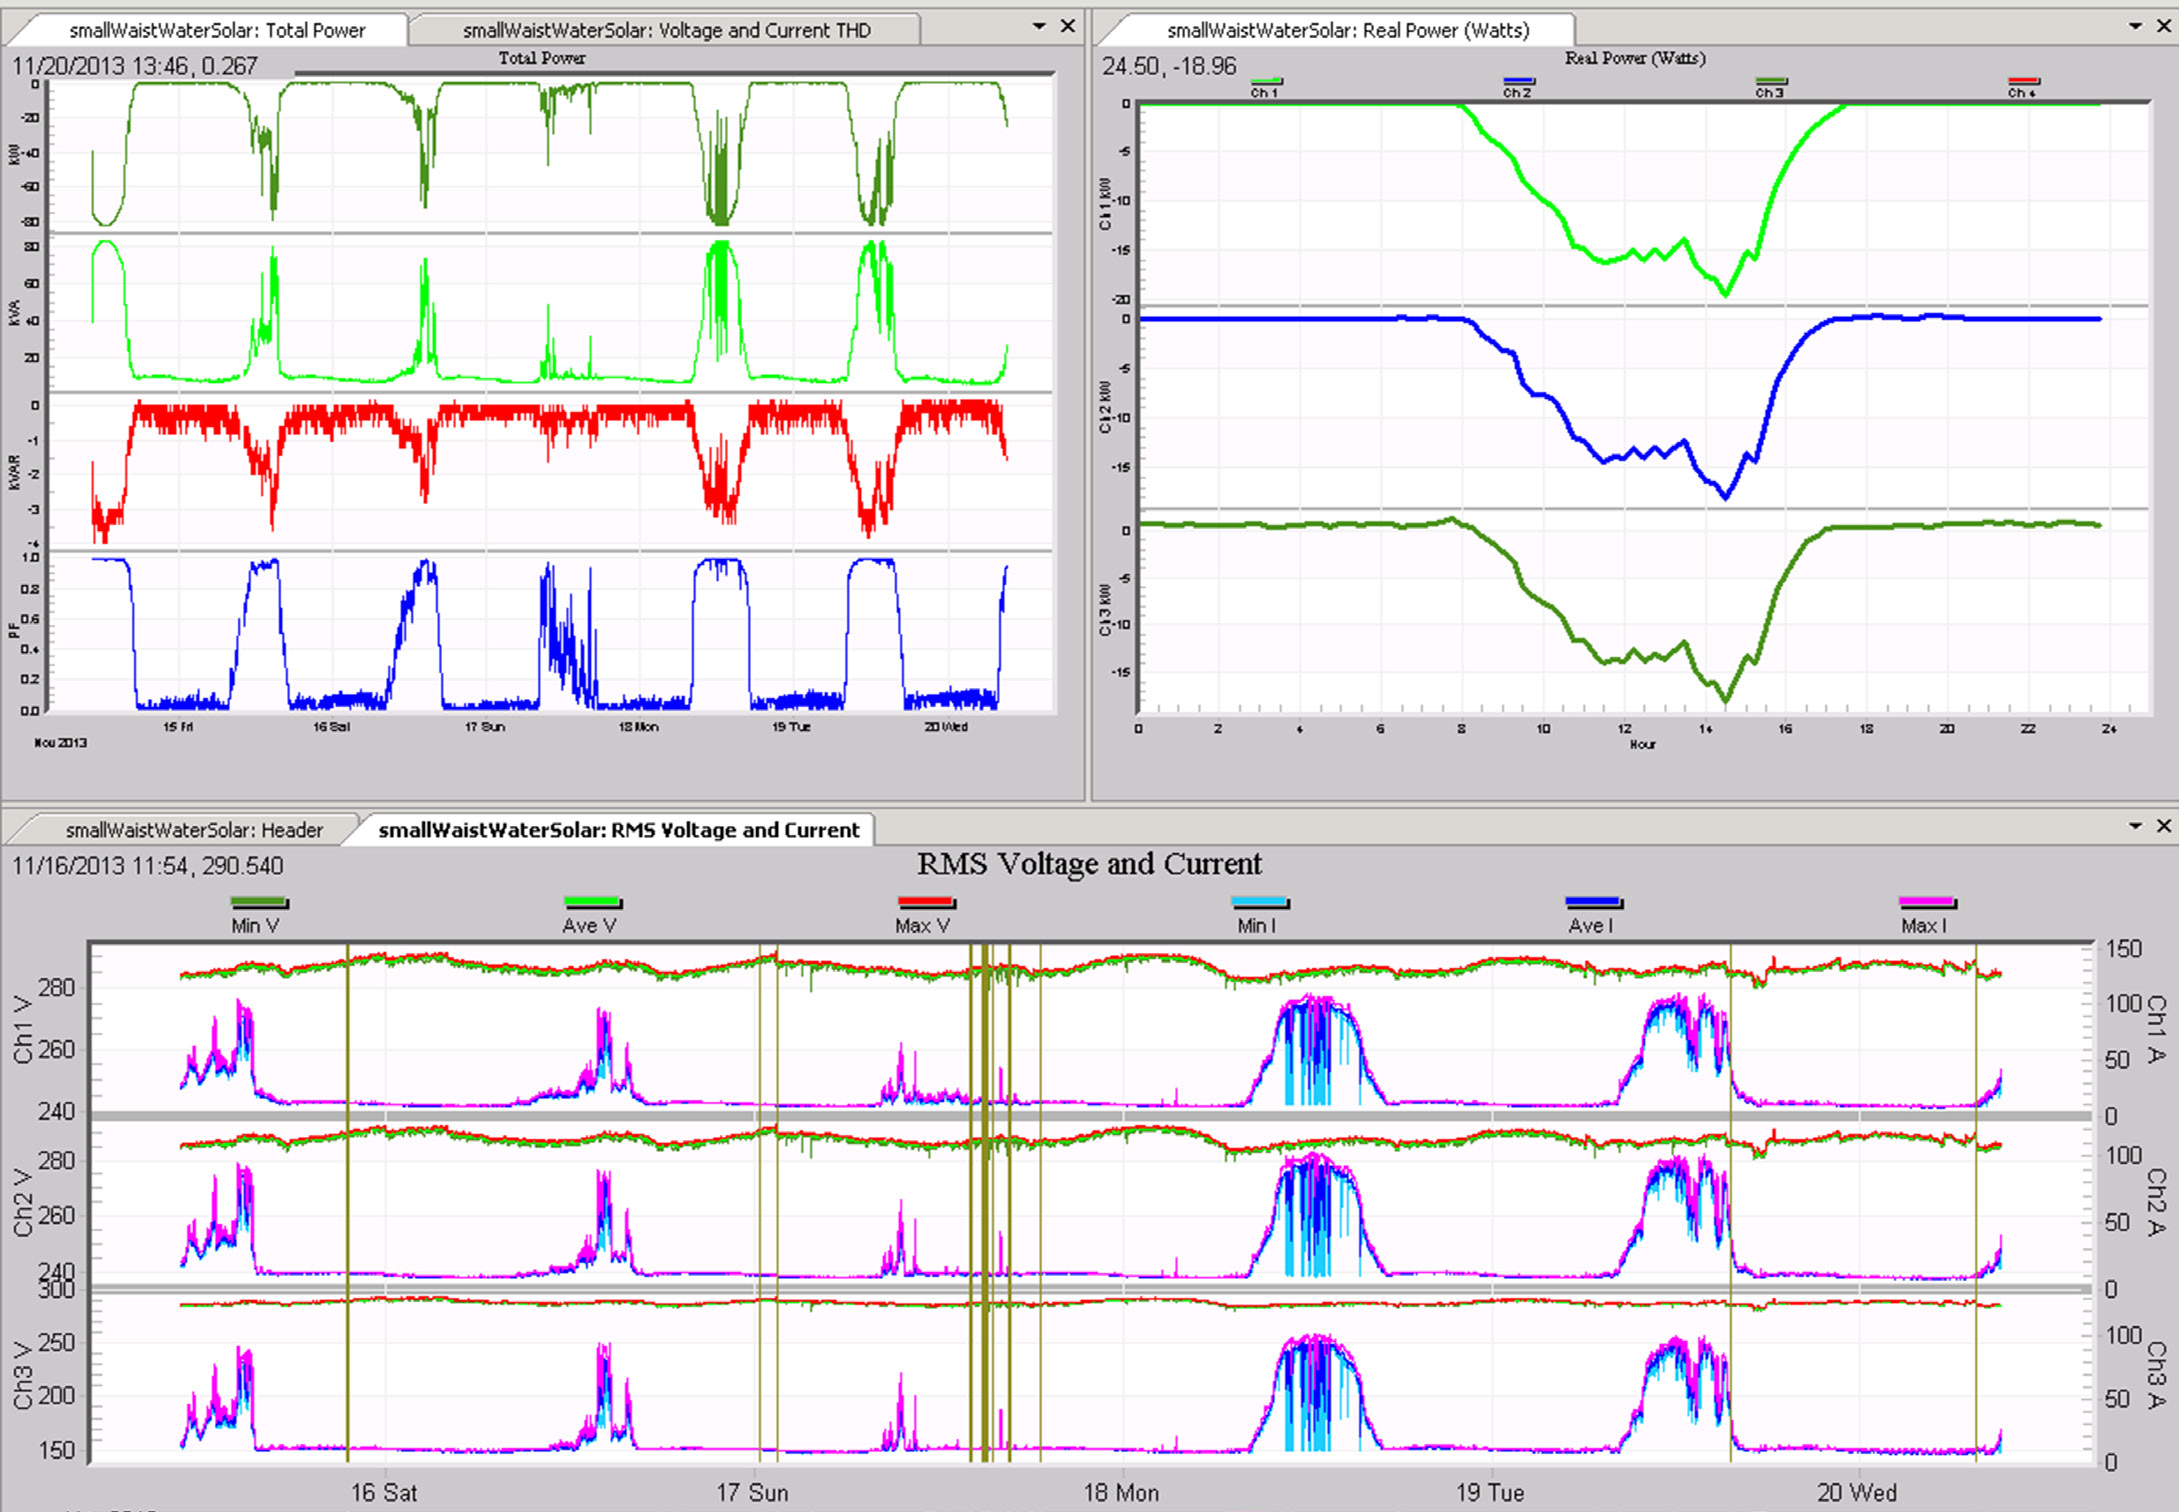
A common set of graphs in a photovoltaic study is real power (stripchart and daily profile), THD, and RMS values. Figure 5 shows a saved View with Total Power and THD stripcharts in the upper left, the Real Power Daily Profile in the upper right, and the RMS Voltage and Current stripchart, along with the header report, in the bottom section. Double clicking on the saved View launches all these graphs at once, with the same layout each time.
Keep in mind that a View doesn’t need to have every graph or report displayed in a panel. As shown previously in Figure 4, multiple graphs and reports can share a window, and they are all accessible via the inverted triangle selector. The View mechanism is a handy way of pre-loading several different commonly used graphs or reports, even if only one is analyzed at a time.
Expanding the Workspace
At times, it may be necessary to have more concurrent access to multiple reports and graphs in a View than there is available space on the screen. ProVision allows some of its UI features to have their visibility and accessibility options toggled. This can be convenient when wanting to increase workspace area by hiding lesser-used or unneeded components.
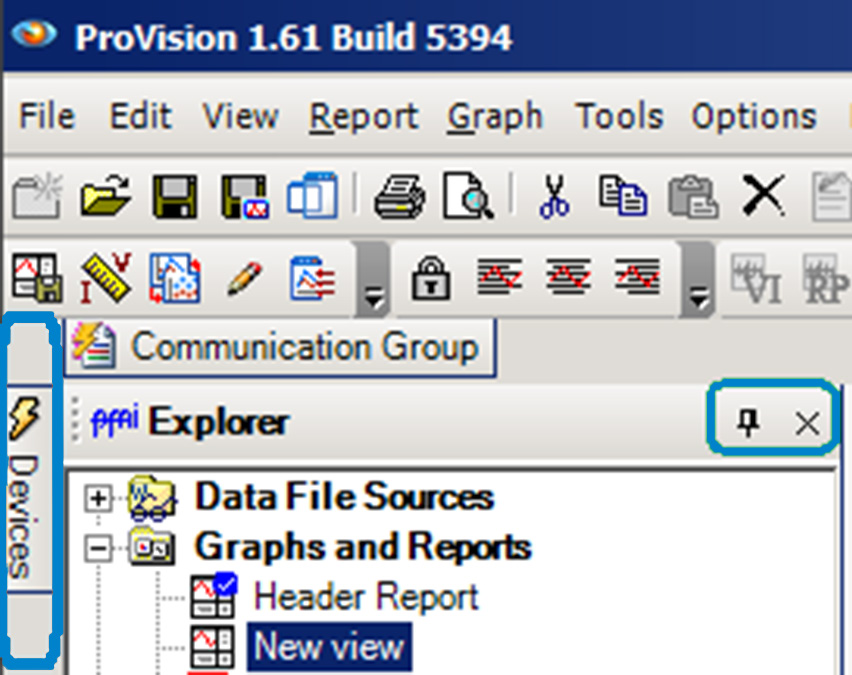
For example, the Explorer Tree and Device Tree are, by default, “pinned” to the workspace, as shown in Figure 6. This means these panes will always be visible regardless of the state of the workspace. However, they can be unpinned by clicking the thumbtack icon in their title bars. Doing so will cause them to collapse into a sidebar at the edge of the workspace. Hovering the mouse over the label in the sidebar will cause the pane to expand and overlap the workspace. Moving the mouse out of the pane will cause it to collapse back in. This allows use of more of the workspace area while still maintaining convenient access to the Explorer Tree and Device Tree panes.
Additionally, these two panes can be closed entirely by clicking the X icon in their title bar, next to the thumbtack. This will close the corresponding pane. This can be useful if, for example, on the current system, only recording analysis is performed and it is not necessary to connect to a recorder via the Device Tree. Any pane closed this way can be reopened by opening the View menu on the menu bar and selecting the pane to make it visible once more.
Conclusion
Utilizing different Views can expedite the workflow when performing specific file analyses, since being able to apply a View to a recording makes it unnecessary to manually open each corresponding graph and report. Furthermore, a View will always open its graphs and reports all in the same relative position onscreen. This makes it convenient to group relevant information. Using the same View for investigations such as voltage sags, harmonic analysis, etc. also provides consistency among users and over time, and helps insure no important graph or report is forgotten.
