Abstract
Boomerangs smart grid sensors transmit RMS voltage, current, and power data to cloud-based Canvass and PQCanvass systems. Canvass/PQCanvass provide web-based data analysis tools, email/SMS notifications, and long term data storage of the one second resolution Boomerang data. However, for situations requiring more detailed analysis, especially in conjunction with PQ monitor recordings, it can be useful to transfer Boomerang-style data from Canvass/PQCanvass to ProVision, PMI’s desktop PQ analysis software. PMI’s Revolutions can also be configured to send Boomerang-style one second readings to Canvass, in parallel with its PQ recording tasks. Revolution data in Canvass or PQCanvass is treated as Boomerang data, and this Boomerang-style data may be transferred to ProVision with the same method. Of course, the Revolution may be downloaded directly into ProVision, where all Revolution PQ information is available.
A new feature allows PQCanvass data from Boomerangs and/or Revolutions to be downloaded and viewed with ProVision. Transferring data from PQ Canvass to ProVision allows for side-by-side comparison of Boomerang-style RMS data with recorded PQ data.
This white paper describes how to generate a ProVision recording from PQCanvass Boomerang or Revolution data.
Generating a ProVision Recording
The core datatype sent to Canvass by a Boomerang or Revolution is RMS trending. All accumulated one second RMS voltage, current, and power measurements are sent by the device (per channel) every few minutes. Canvass stores all incoming trend data, resulting in a continuous one second resolution picture for each monitored location. This data maps to stripcharts in ProVision, with just the average trace (no cycle min or max) present. The ProVision stripchart interval is set to one second, matching the update rate of the Boomerang data.
Boomerang data is a continuous one second log, with no start or stop time, and may contain years of one second readings. The following method allows for the download of any subset of Boomerang data to ProVision. In PQCanvass graph a stripchart then select the save icon under the recording, and transfer the produced recording to ProVision. The following are step-by-step instructions.
In PQCanvass select the device and time frame for the recording by generating a stripchart graph for the desired device and time span. The time frame of the stripchart sets the start and end times of the recording and also selects the device. Due to the size of the generated recordings, the time frame is limited to 30 days for each generated ProVision recording.
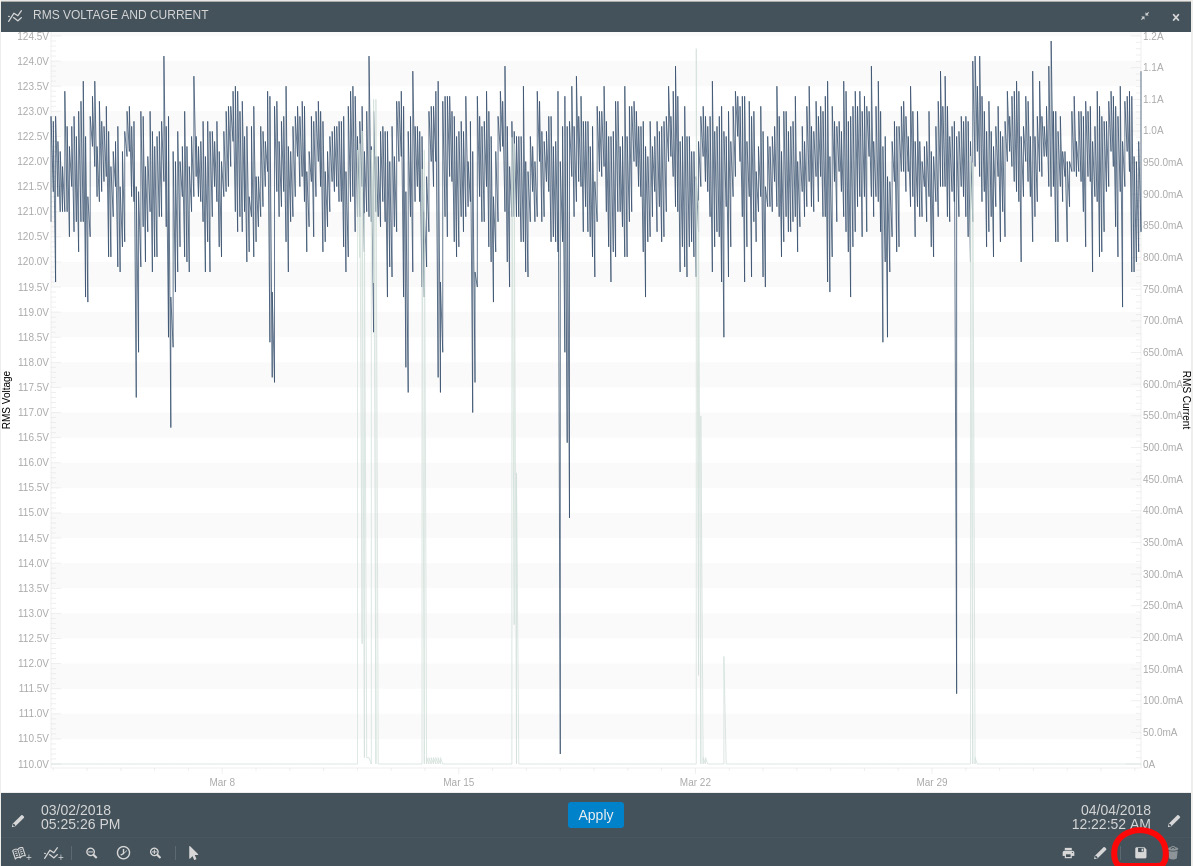
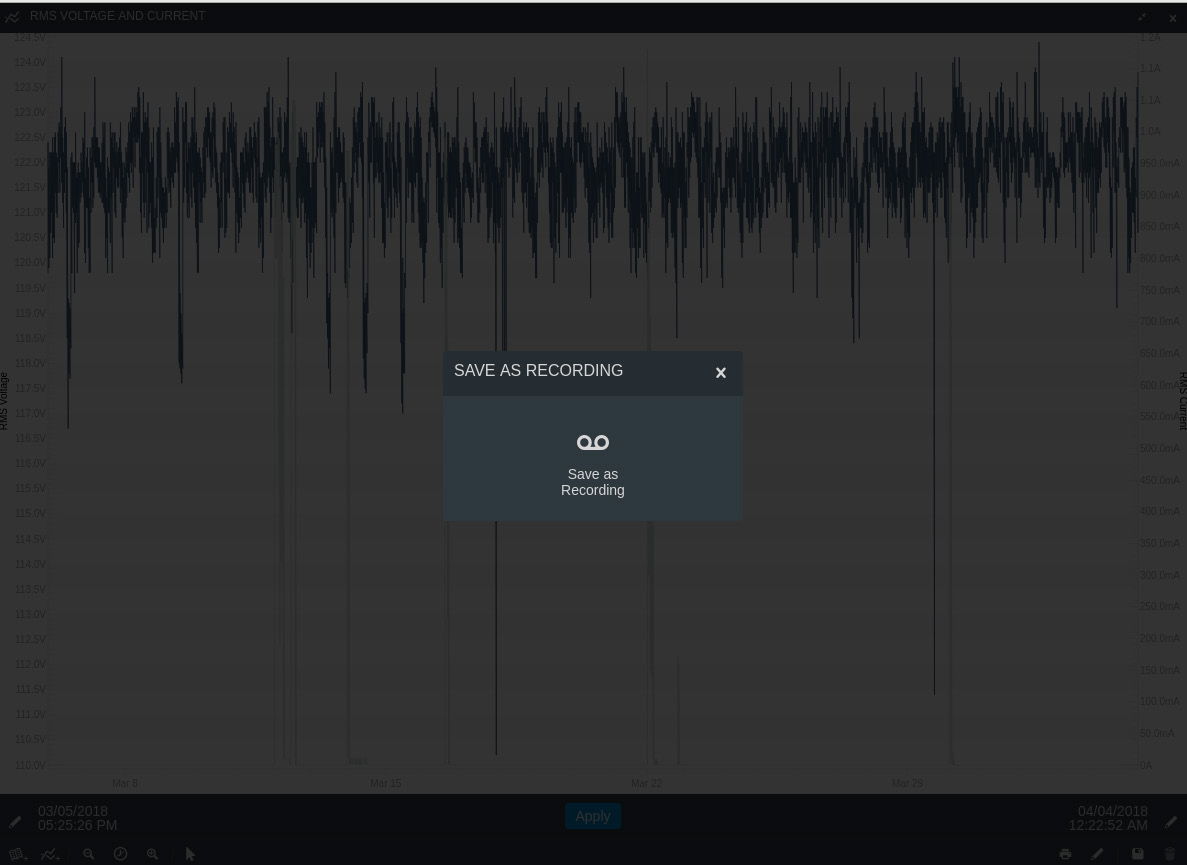
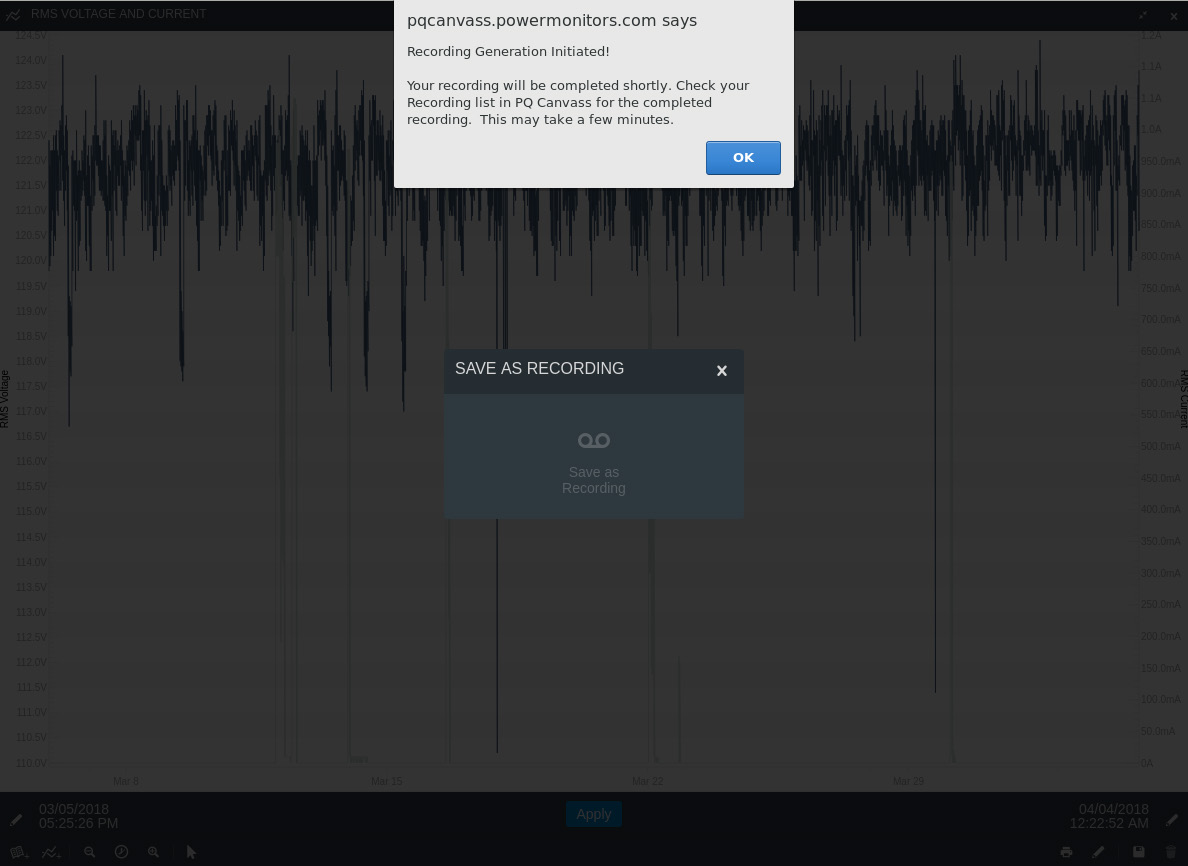
After running the stripchart graph, choose the save icon located at the bottom of graph; see Figure 1. Choose “Save as Recording” from the displayed confirmation dialog to confirm the action to generate a recording; see Figure 2. A save recording progress dialog will appear indicating to look in recording list for the new recording; see Figure 3. This new recording will be ready for viewing shortly. You may have to refresh the recording list for it to appear.
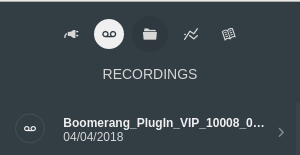
The recording can be graphed in PQCanvass to verify that the desired time frame and device were chosen. Figure 4 shows the newly generated recording as the first item in the recording list. The name of the recording is based on the type of device, its serial number and the start time of the graph from which the recording was generated.
Transferring the New Recording to ProVision
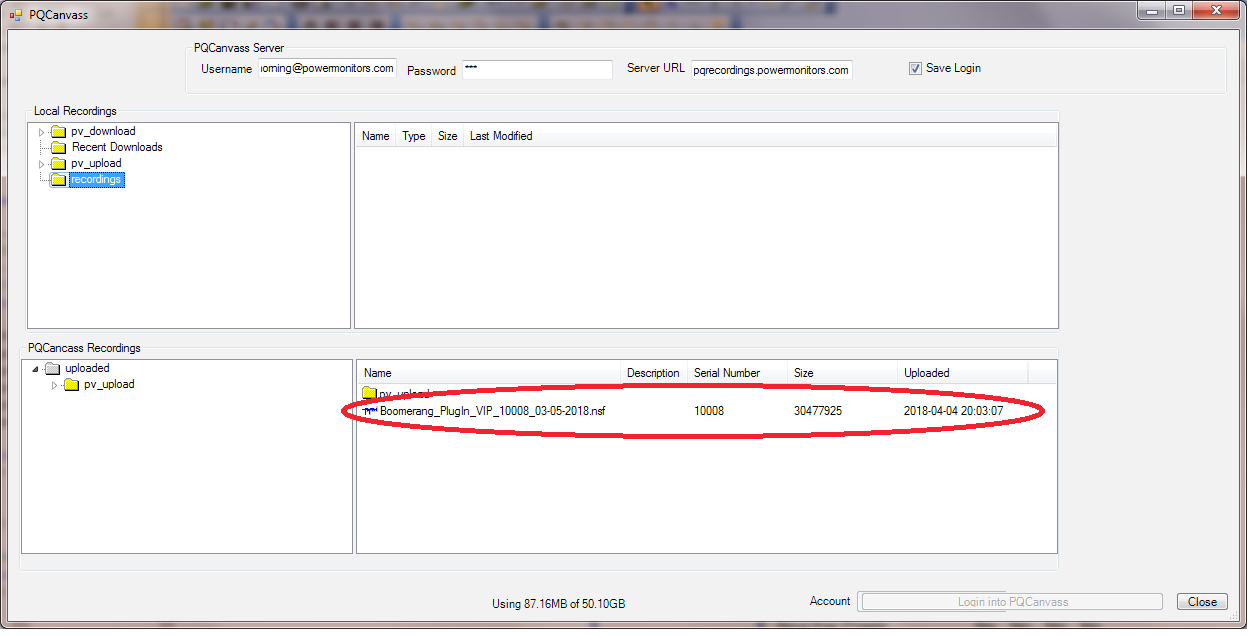
When the recording is generated, it will appear in the Uploaded Recordings listbox of ProVision’s PQCanvass dialog once you log into PQCanvass; see Figure 5. This dialog is available from the PQCanvass menu under the ProVision File menu. You will need to login to your PQCanvass account to use this feature. Transferring the file from PQCanvass to ProVision is as simple as dragging the newly generated file from the PQCanvass Recordings listbox to the Local Recordings listbox or Local Watcher Folder Treeview.
See the whitepaper “Transferring Recordings to PQCanvass” for instructions on transferring recordings to and from PQCanvass using ProVision. Note: the ProVision to PQCanvass transfer was added in ProVision build 6661 so that build or later is required to download the Boomerang recordings to ProVision.
Note: as detailed in the mentioned whitepaper, uploaded ProVision recordings can be viewed in PQCanvass. This allows side-by-side comparisons in both PQCanvass and ProVision.
Viewing the Recording in ProVision
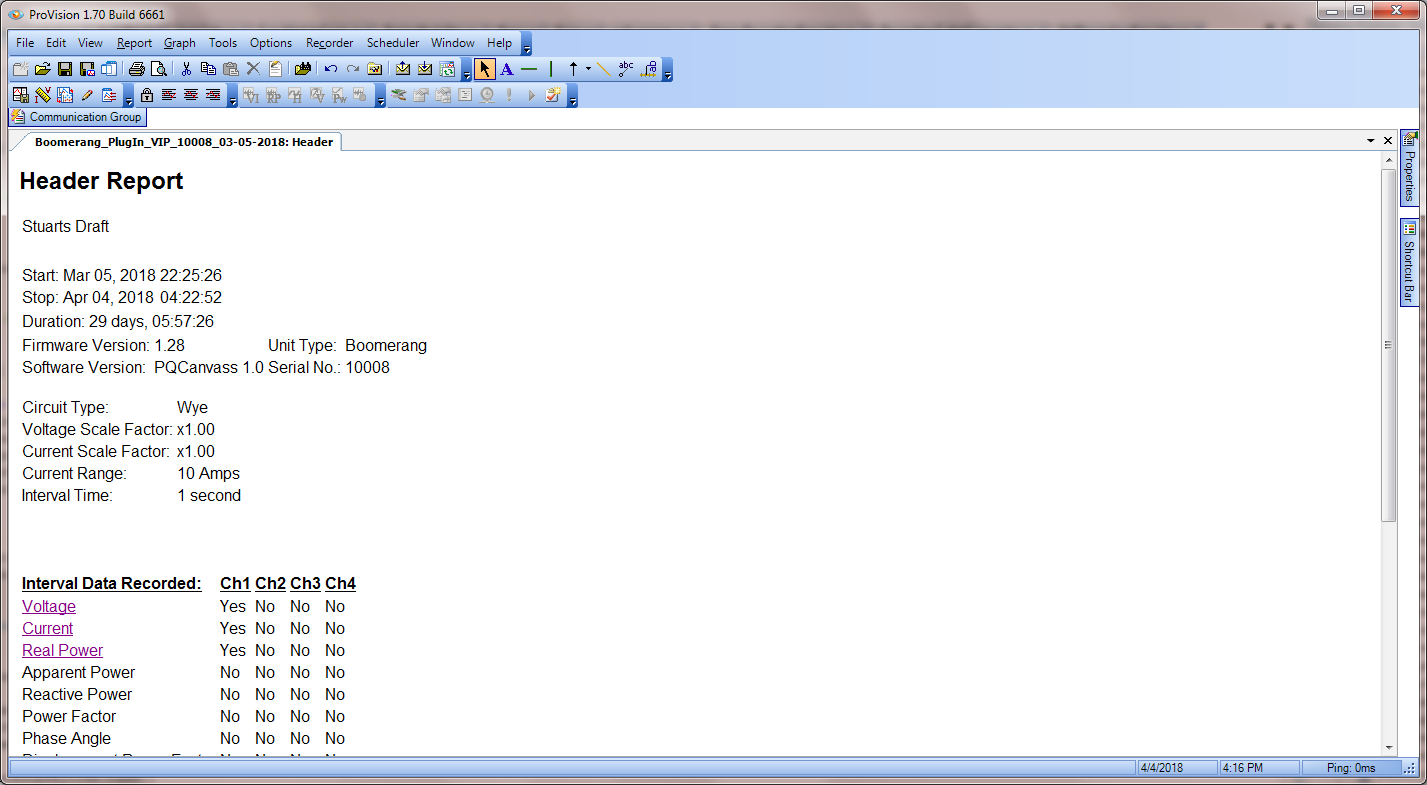
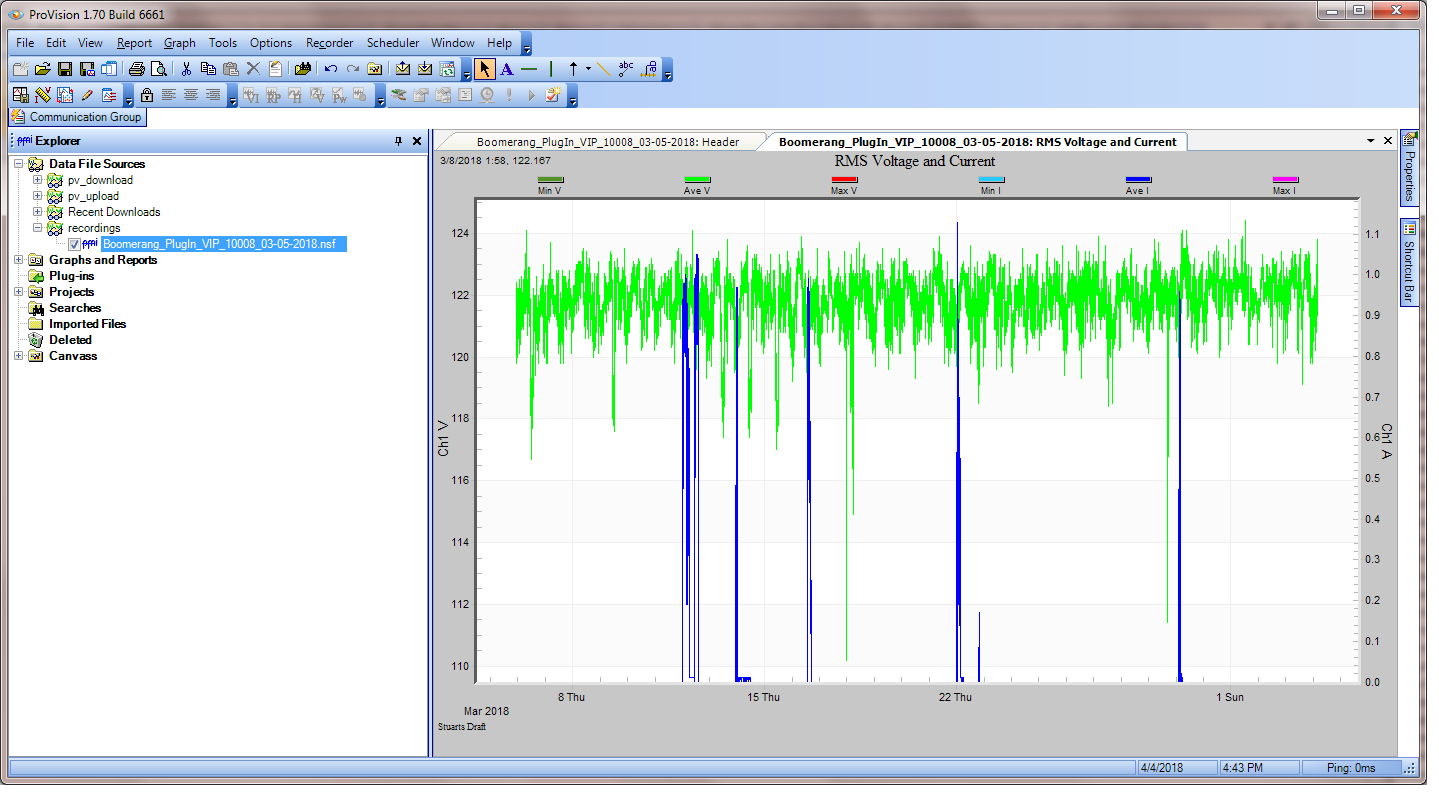
Once the PQCanvass transfer in ProVision is complete, the newly generated recording is visible in the watcher window to which it was downloaded. Once downloaded, the PQCanvass generated recording can be viewed, the data graphed, and reports run just like any other ProVision recording. Figure 6 shows the header report from a Boomerang recording downloaded from PQCanvass. Figure 7 shows a Voltage and Current stripchart graph in ProVision from a downloaded Boomerang recording. Note: Figure 7 shows the same data as Figure 1 except one is viewed in ProVision and the other in PQCanvass.
Conclusion
Power Monitors provides both cloud and desktop software application for PQ data analysis. This data can be exchanged between systems to aid in analysis, data sharing, and archiving. PQCanvass can now generate ProVision recordings with Boomerang and Revolution data. Recordings can be transferred between both systems and are graphable on both systems. This allows for side by side comparison of data from separate devices regardless of the system that was used to store this data. As new features are added to the software systems, the data can be transferred to the system that best meets the analysis needs.
