Abstract
Energy usage metering (in kWh) is now available at-a-glance from the PMI Canvass web application. This new feature will save you time while you diagnose internal and customer-facing issues by providing cloud-based analysis in a web browser.
Prerequisites
- The energy usage feature is found in PMI’s web-based Canvass application, so an active Canvass account is required to use it.
- A PMI device able to measure real power and send data to Canvass. As of 2022, these include the Eclipse, Boomerang, Tensor, Seeker, Guardian, and Revolution. The device must be networked, which may be accomplished with built-in LTE cell, WiFi, or Ethernet communications options available with the various devices.
Why Use This Feature
Before this, the way to view totaled power consumption was to start a recording, wait for the recording to finish, download the recording, and run the Power Consumption report with desktop software. Now you can view power consumption for any timespan where real power stripchart data is available from a recorder. In addition, since Canvass is web-based, this data is available instantly to any member of your organization with a Canvass login and a web browser, whether at the office, out in the field, or working from home, without the need for a recorder download.
Consider a case where you are using a PMI recorder to corroborate contested meter readings at a location. A Boomerang or Revolution can then be installed at the location in question. After any arbitrary period of time, the power consumption can be reviewed in Canvass. Comparing the energy usage from Canvass to the metered kWh in question can be done on-the-fly, from the office and in near real time.
How to Use This Tool
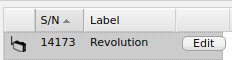
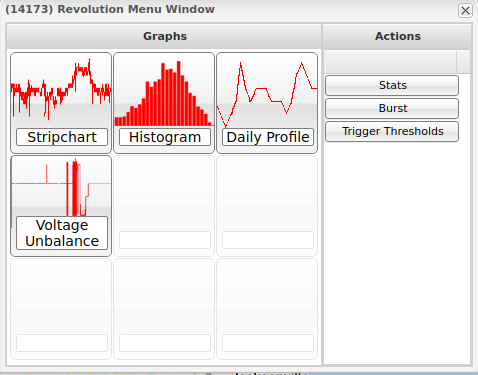
From the main Canvass interface, choose a recorder from the left pane (Figure 1), and select “Stripchart” from the device menu window (Figure 2). You can also choose a device from the map view by clicking on it.
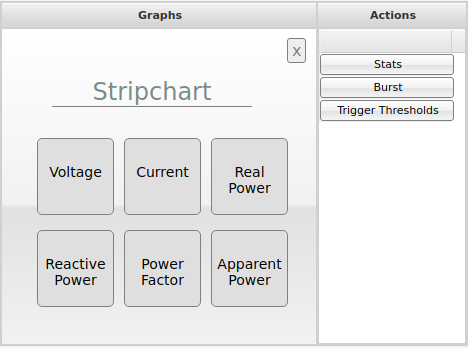
After selecting “Stripchart”, choose “Real Power” from the list of measures (Figure 3). Real Power must be listed in the available measures to view kWh.
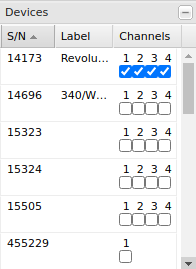
At this point, the stripchart window is open. By default, the stripchart shows the last four hours of all channels for the recorder. Channels can be removed from the chart using the “Devices” option in the right pane of the stripchart window (Figure 4). The right pane is shown by default, but if it is hidden, you can expand it either by clicking the expand button or using the “T” hotkey to show/hide the pane.
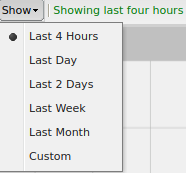
Timespan can be set using the “Show” option on the stripchart window toolbar (Figure 5). If choosing a custom timespan, click “Graph” in the stripchart window toolbar after setting the timespan options to apply the custom timespan and redraw the graph. If you would prefer not to use the “Show” menu item, a timespan can be selected by clicking the desired start point and dragging to the desired end point within the existing graph. If the point you want is outside the current span, use the hotkey “O” to zoom out. (The “O” to zoom out features doubles the timespan that is currently visible along the x-axis.)
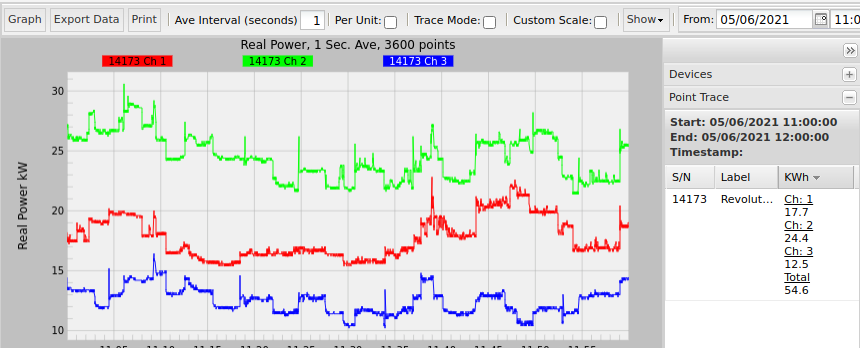
In the right pane, select “Point Trace” to view power consumption for the stripchart (Figure 6). Power consumption is displayed both per-channel and the total across all channels you have charted. If there is no real power data for a channel, the power consumption will be shown as “–” instead of 0 to indicate the difference between no power consumed in the timespan and no real power data available in the timespan. The start and end time of the data is noted for convenience. Figures will update each time you request a new graph from Canvass.
Calculation
The power consumption figures are calculated per channel when requesting the stripchart using the following sum:
where is a real power data point at time n, and since the data points in Canvass are one second RMS averages and there are 3600 seconds in an hour.
Miscellaneous Considerations
To measure real power on a channel of a recorder, that channel must have both voltage and current measurement probes connected during the time of data collection.
PMI recorder models Guardian, Seeker and Tensor can also record real power and stream to Canvass and PQ Canvass, PMI’s next generation web platform.
Power consumption is computed by summing the data points within a given timespan. If data is missing during the timespan, Canvass will not include missing points in the calculation.
By default, PMI recorders send measurements as-is without applying a scale factor to the data. If you need to apply a scale factor for voltage or current to a recorder (ex. to apply PT or CT ratios), click “Edit” next to the recorder in the device list on the left side of Canvass (Figure 1).
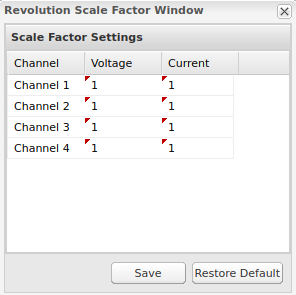
From the device settings window, choose “Scale Factors” (Figure 7). From here you can set the scale factors per measure per channel for the device (Figure 8). (Note that these ratios are applied at the “device” level and are then applied by the Canvass web application when data is graphed. The raw, un-scaled values are unchanged. This means that if the PT or CT ratios change during the period of installation of a Boomerang or Revolution, then the user must take care to manually change those ratios based on the timespan being analyzed.)
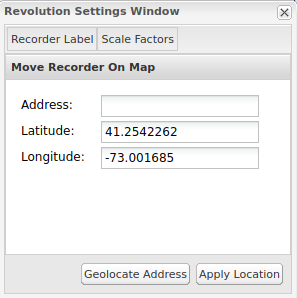
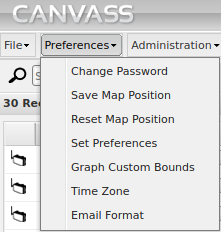
The start and end time displayed in the Point Trace section of the right side pane of the stripchart window are displayed in the time zone set by the Canvass user. The underlying data collected by PMI recorders is always stored in UTC, but displayed in Canvass according to the user preferences. If you are collecting data across different time zones, or collaborating with a colleague in another time zone, make note of your display preferences to avoid confusion. To check your current settings, click “Time Zone” under “Preferences” in the top left of the main Canvass page (Figure 9).
Conclusion
With the newest feature added to Canvass, users can now quickly and easily perform meter validation and verification with just a few short clicks. Resolving customer disputes and proactively verifying meter readings has never been easier.
