Abstract
This white paper describes vectors and vector diagrams. It provides the vector diagrams and sketches of the connections required for correctly installing a power monitor on commonly used power circuit configurations. This information will assist the PQ investigator in making the correct connections and enable him to verify that his monitor is correctly installed. All vector diagrams assume purely resistive loads. Additional information on vectors is available in the PMI white paper: Understanding Vector Diagrams available HERE.
Vector Definition
A vector is a quantity or phenomenon that has two independent properties, magnitude and direction. The term also represents the mathematical or geometrical representation of such a quantity. Examples in nature include velocity, force, momentum, voltage and current. Quantities that exhibit magnitude only are called scalars. Examples are speed, mass, and resistance. Figure 1 depicts typical voltage and current vectors on a vector diagram using polar coordinates. A vector can be represented in polar coordinates by (A/θ) where A is the magnitude and θ is the direction or angle with respect to the reference vector, normally V1.
What Is a Vector Diagram?
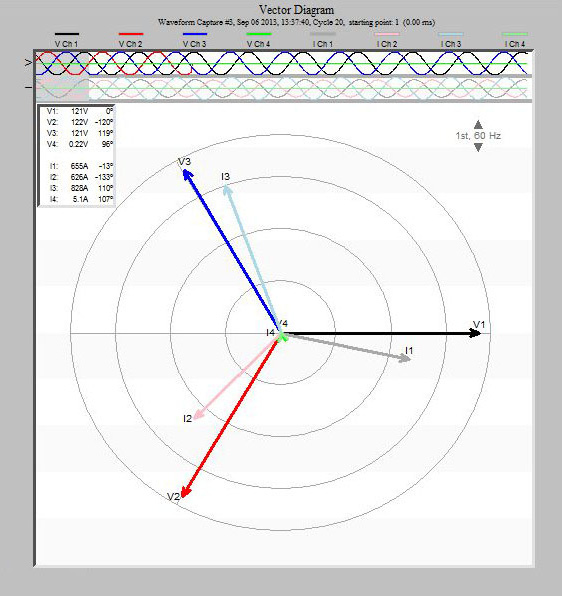
A vector diagram is a display of all of the voltage and current vectors measured at any location and plotted on a diagram indicating the magnitude and direction of each. (See Figure 1 for an example). The vectors can be depicted graphically in either rectangular (Cartesian) or polar coordinates. Provision provides a vector diagram using polar coordinates. The polar plot consists of concentric circles of increasing magnitude oriented with the center of each at the origin. The concentric circles represent 360 degrees or one period of the waveform. All voltage and current vectors are laid out on this plot according to their magnitude and position relative to a reference vector which is Channel 1 voltage located at zero degrees. One end of each vector is placed at the origin. Magnitude and direction angles relative to the reference vector are provided in the upper left hand corner of the screen. Magnitude is shown as the length of the vector. Direction is shown by the orientation of the line segment and by an arrow at the end opposite to the origin.
Viewing Vector Diagrams in ProVision
Provision provides two methods for viewing a vector diagram. The first permits viewing the vectors in real time. This feature permits viewing the vector diagram during the countdown or after recording starts and ascertaining if the monitor is installed correctly. To view vector diagrams using this technique, install the monitor, boot up Provision. The path to view the real time vector diagram is: left click on Recorder > left click on Waveform Graph > Vector Graph. Note: data for these real-time vector diagrams is not stored.
The second method permits viewing a vector diagram obtained from waveform capture event data. Download the data file to your computer. Voltage and current data for each phase should have been recorded and the file should include some waveform capture events. Follow the path – Graph>Harmonic Analysis>Vector Diagram>Select a Waveform. The vector diagram should be set to view the 60 Hz vectors at the frequency selection button in the upper right hand corner.
Reference Vector Diagrams
There are several frequently used power circuit configurations encountered in power distribution monitoring. For more on wiring configurations used with PMI recorders, download Eagle and Revolution Diagrams located HERE. Connection schematics and a corresponding vector diagram are provided in the pages that follow. These should be reviewed to find the circuit that corresponds to the circuit under investigation. For example, if the circuit under investigation is a 4 wire wye, 3 wattmeter, you need to scan the Reference Circuit Vector Diagrams to locate the reference diagram labeled 4 Wire Wye, 3 Wattmeters.
Comparing Vector Diagrams
After locating the appropriate reference vector diagram, it should be compared with the vector diagram obtained from the data file. Keep in mind that the reference diagrams assume purely resistive loads so the voltage and current vectors will be in phase. This will not be the case for the vector diagrams displayed by Provision representing the circuit under test.
It may be helpful to make hard copies of each for comparison. If the vector diagrams appear to be the same, after realigning the current vectors in the data file vector diagrams to be in phase with the corresponding phase voltages, you can conclude that your monitor was correctly installed. An example of the comparison of the two diagrams is shown in Figure 2. Note, this does not preclude the need to check CT installation in cases where the current vectors are grossly misaligned (i.e. 180 degrees) which may indicate the arrows on the CTs are not pointing toward the load.
Assuming the phase loads in the data file under investigation are purely resistive so that the currents are in phase with the voltages, the comparison indicates the vector alignments in the diagrams above are the same. Clockwise rotation is indicated and the monitor was correctly installed.
What Is Phase Rotation?
Rotation refers to the sequence in which the three phases of an electric system are connected to a motor to produce the desired rotation, either clockwise or counterclockwise. Note, three and four wire reference vector diagrams provided include two vector diagrams, one for clockwise and one for counter-clockwise rotation. Both need to be checked when reviewing these to obtain the correct diagram for the circuit under test. Rotation is not applicable to single phase loads.
Conclusion
Checking a monitor installation to ensure it has been installed correctly is an important step in the power quality investigation. It can be accomplished by checking the vector diagram obtained from the circuit under test with a reference vector diagram known to be correct. Two methods were discussed but the first will be the most useful since it enables viewing the vector diagram in real time precluding the need for recorded data. Determining if the installation is correct in this way may eliminate the need to record a second time and ensures recording accurate data.
Reference Circuit Vector Diagrams
Three Phase Wye
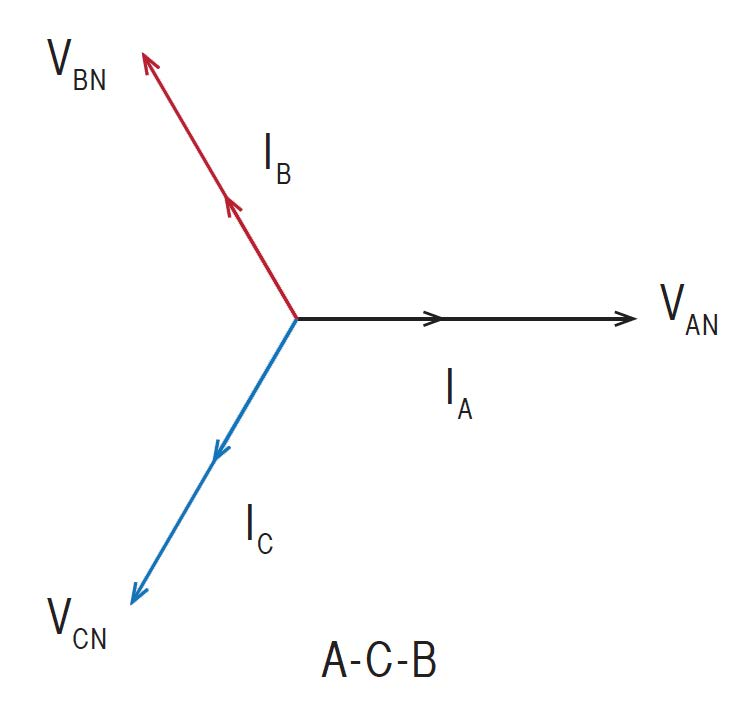
4 Wire Wye Connection – 3 Wattmeter Method. Connections: CH1 (Black) to phase A with CT, CH2 (Red) to phase B with CT, CH3 (Blue) to phase C with CT, plus neutral connection. Vectors: VAN, VBN, VCN, IA, IB, IC.
4 Wire Wye Connection – 3 Wattmeter Method
Circuit diagram and vector diagrams showing both A-B-C and A-C-B rotation configurations with voltage and current vectors.
Four Wire (Hot-Leg) Delta – 3 Wattmeter Method
Circuit diagram and vector diagrams showing both A-C-B and A-B-C rotation configurations.
3-Wire Open Delta – 2 Wattmeter Method
Circuit diagram and vector diagrams showing both A-C-B and A-B-C rotation configurations with VAB, VBC, VCA vectors and IA, IB, IC currents.
3-Wire Delta Connection – 2 Wattmeter Method
Circuit diagram and vector diagrams showing both A-C-B and A-B-C rotation configurations with VAB, VBC, VCA vectors and IA, IB, IC currents.
2.5 Element Wye – 2½ Wattmeter Method
Circuit diagram and vector diagrams showing A-C-B and A-B-C configurations with VA, VC, VAN, VBN, VCN vectors and IA, IB, IC currents.
3-Wire Split Phase – 2 Wattmeter Method
Circuit diagram with voltage VA, VB and currents IA, IB, and vector diagram showing VAN, VBN configuration.
2-Wire Single Phase – Single Wattmeter
Simple circuit diagram showing load with single voltage V and current IA.
