Abstract
A VFD, or Variable Frequency Drive, is a device which takes in a 3 phase AC signal and outputs a somewhat arbitrary waveform using pulse width modulation. This is particularly useful because the rotor speed of an induction motor is proportional to the frequency of the signal, so the VFD is able generate a sine wave signal for whatever rotor speed is desired. If it is desired to reduce the air speed of a blower, it is more efficient and cheaper to control the rotor speed through a VFD rather than restricting the output air f low. VFDs are not, however, without any problems. Due to the rectification process, the VFD tends to send harmonic distortion back onto the input current waveform, especially when the line is lightly loaded or when the voltage inputs are unbalanced. The goal of this whitepaper is to describe what a VFD is, understand how it works, and present a few models on why specific harmonics are generated.
VFD Circuit
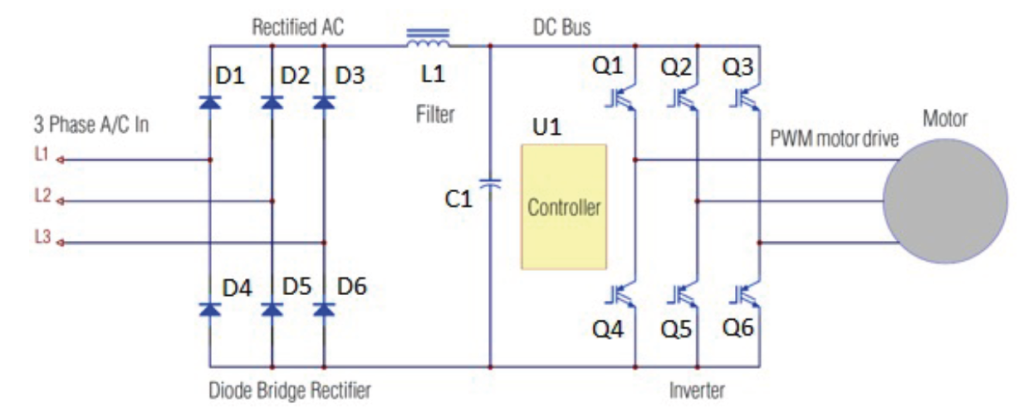
Figure 1. Schematic showing core operation of a Variable Frequency Drive
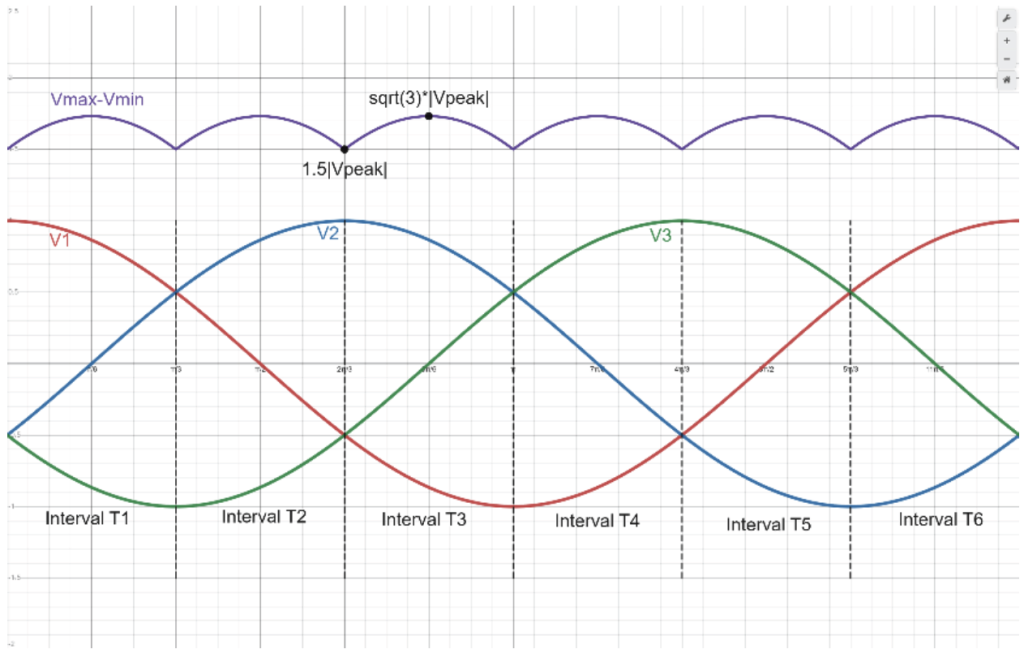
Figure 2. 3 phase system showing 6 different conduction intervals alongside the difference envelope
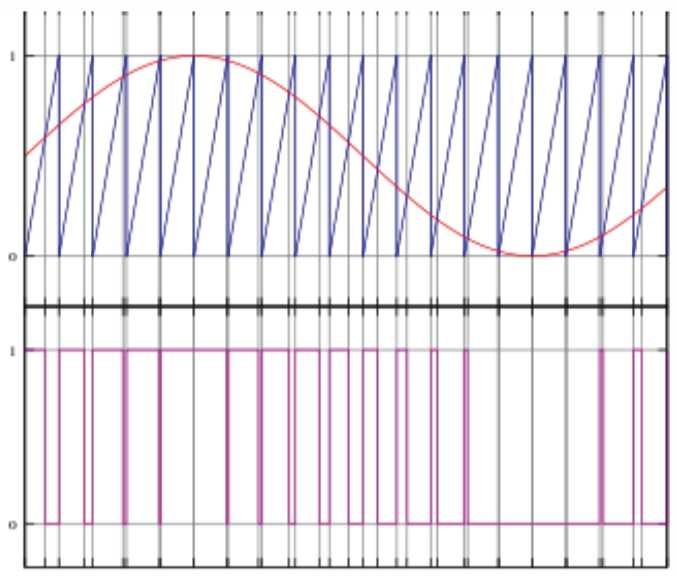
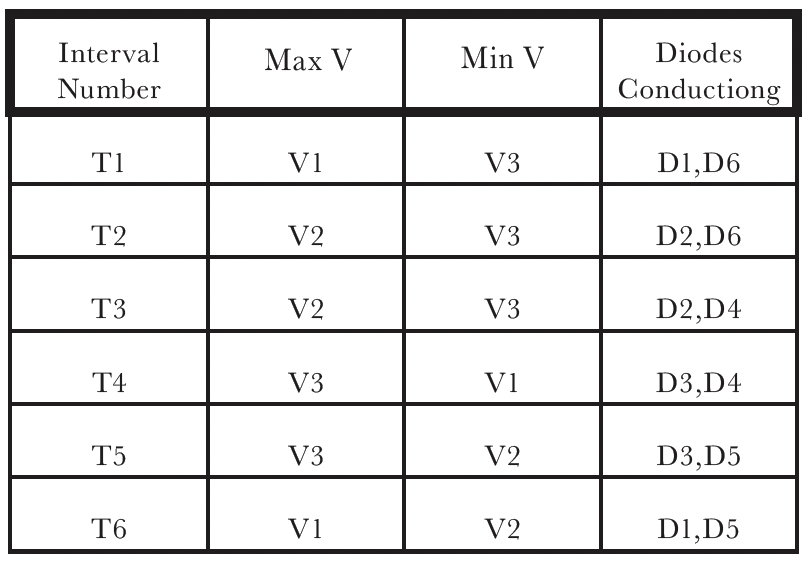
Figure 1 shows the basic schematic of a Variable Frequency Drive. The goal is to turn 3 phase AC power as shown in Figure 2 into a rectified DC bus, and then to use PWM, or pulse width modulation, to synthesize the desired output as shown in Figure 3. Without considering line reactance for now, only one of D1, D2, or D3 and only one of D4, D5, or D6 are in conduction at any one time. Only the maximum signal is conducted through the top set of diodes and only the minimum signal is conducted through the lower set of diodes. With reference to the intervals defined in Figure 2, the repeating sequence of Diode conductions are shown in Table 1.
Without any filtering, the DC bus will follow the purple envelope difference graph shown in Figure 2, which oscillates between 1.5 times and √3 t imes the peak line voltage. W hen the bus is filtered by a large series inductor, the device is called a Current Source Converter, because the DC current is essentially constant, while the voltage will have some ripple effects. When the bus is filtered by a large capacitor, it is called a Voltage Source Converter, because now the DC voltage is held constant, and the DC current will show some ripple effects. The Voltage Source Converter tends to produce much worse current distortion on the input than the Current Source Converter.
Figure 3 describes the PWM output of the VFD. Whenever the control signal (Blue Sawtooth) rises above the target signal (red sine wave), the PWM output (pink) is made low, and otherwise it is made high. The inductance of the motor will have a smoothing effect on the current through the armature windings, so that the rotor should not experience any jerky motion. The sawtooth frequency should be around ten times the maximum desired output frequency in order to guarantee enough samples are present to smoothly reconstruct the correct wave.
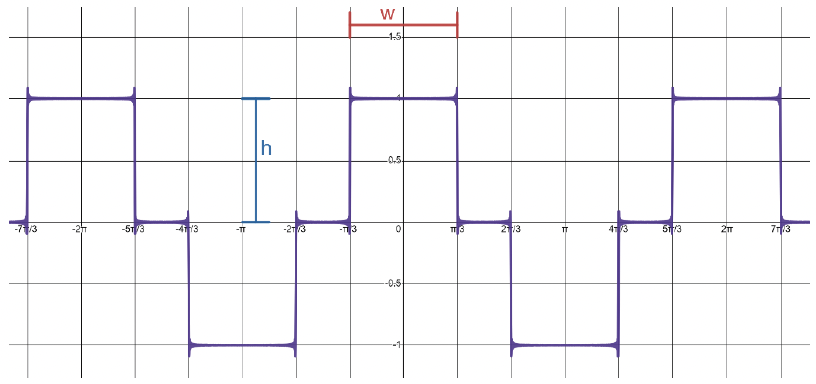
The ideal assumption is that the DC current is constant, so that the current in channel 1 in Figures 1 and 2 has the repeating sequence Id, 0, -Id, -Id, 0, Id during the corresponding sequence of intervals, where Id is the given DC current. The graph in Figure 4 shows this pattern. The general formula for the Fourier Series of alternating pulse trains of width w/ω and height (h) is given by
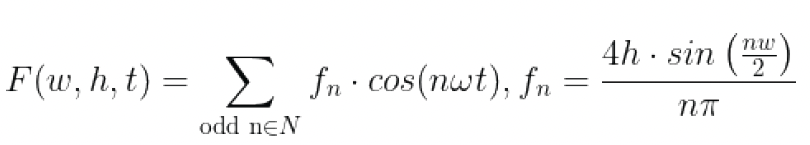
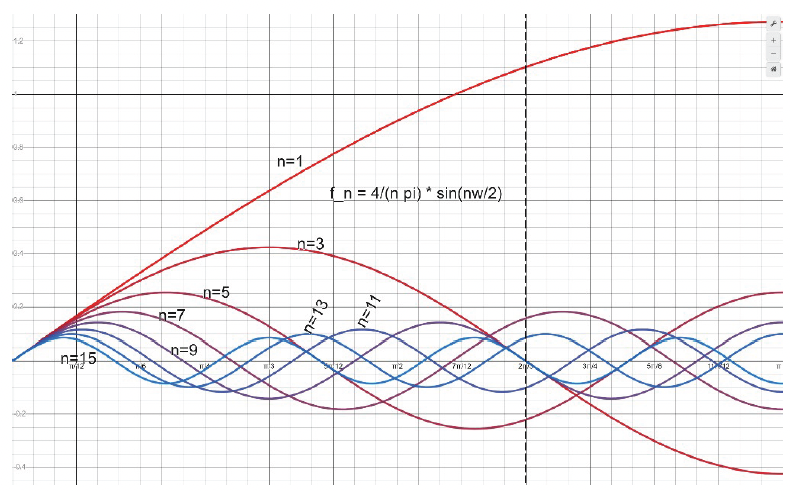
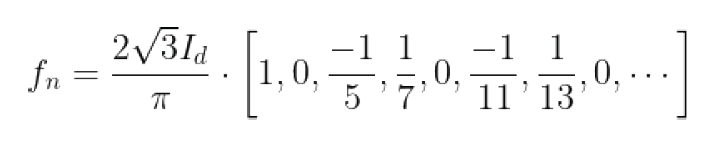
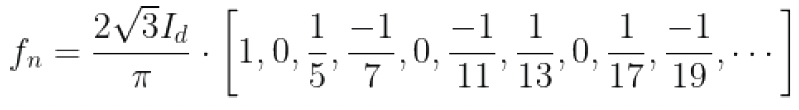
Figure 5 plots this formula for the first 15 harmonic levels with respect to w assuming h is 1. The reason this formula includes strictly odd harmonic terms is because of the axial symmetry about y=0, where a negation and 180° phase shift yields the same curve. Even order terms mess up that axial symmetry. In the case of a 6 p ole converter with 3 phase inputs, w=2π/3 which is marked by the dashed line in Figure 5. Notice that at this particular value of w, Harmonic numbers 3, 9, and 15 all go down to 0. This has to do with the fact the there is no neutral line, which means that the currents in the three phases must add to 0. These triplen harmonics (odd integer multiples of 3) add together constructively between the three phases, because a 120° phase shift yields the same curve for these harmonics. The first few odd coefficients of this series are
High Order Poles
If the converter had a Δ- connected transformer input instead of a Y-connected input, the lines are now referenced to each other and not to the neutral, which has the effect of creating a pulse train like this
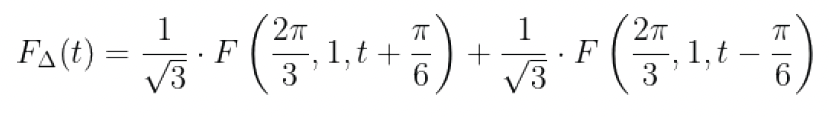
This is plotted as the green curve in Figure 6. The harmonic content of the Δ-connected input is similar to the Y-connected input except that it f lips the sign of the harmonic numbers 12k+5 and 12k+7 for all natural numbers k. The first few odd coefficients of this series are
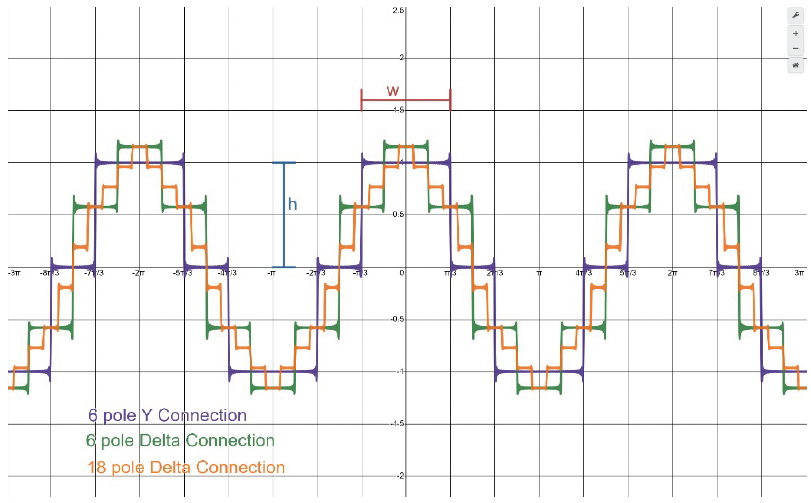
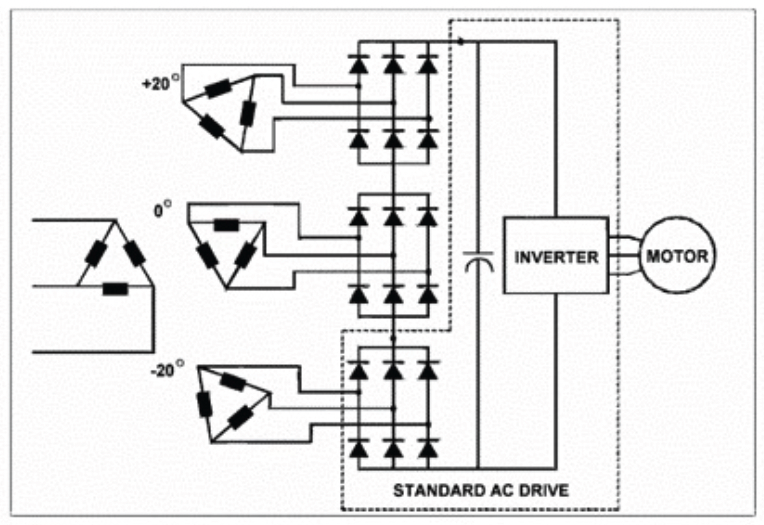
A 12 pole converter is achieved by taking one rectifier tied to a Y-Y transformer in series with another rectifier tied to a Y-Δ transformer, which effectively takes the average of the two pulse trains and results in a signal whose harmonic numbers 12k+5 and 12k+7 are eliminated. Figure 7 shows the basic circuit diagram for an 18 pole converter, built out of 3 sepa-rate Δ- Δ transformers with a π/9 phase shift. Figure 6 shows the 6 pole Y (purple), 6 pole Δ (green), and 18 pole Δ (Orange) converter conduction graphs superimposed on each other. In general, as the number of poles increases, the harmonic dis-tortion decreases, because the conduction graph approaches a cosine wave with the fundamental frequency.
Non-Idealities
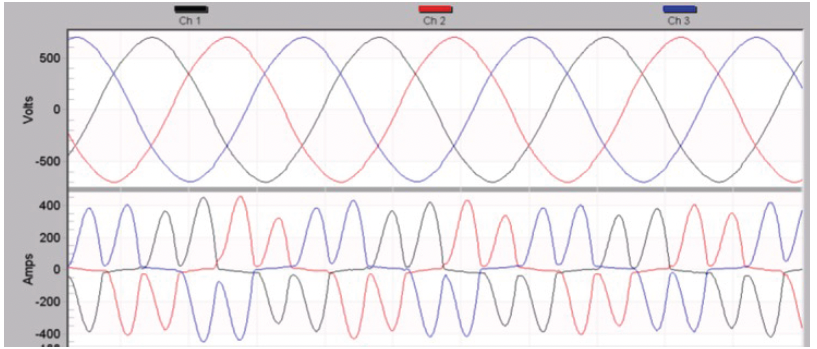
Figure 8 shows a recording of the input to a VFD using a PMI Revolution recorder. One thing to notice is that, due to the double hump current conduction graph, the previous assumption that the DC current is constant is no longer valid. Another thing to note is that the there is a slight voltage imbalance which causes some of the current humps to be higher than others. Lastly, when the current is in conduction compared to when it should be conducting based on voltage graph, a roughly 50° or 60° phase offset can be observed. This conduction delay is caused by the nonzero transformer and system impedance.
Look next at figures 9, 10, 11, and 12. This shows the large difference in harmonic distortion between a standard Voltage Source Inverter with a large capacitor in the filter section and a Current Source Inverter with a large inductor in the filter section. The gap between the humps in figure 9 is caused by the fact that the large capacitor supplies all the DC current when the voltage source drops below a certain threshold.
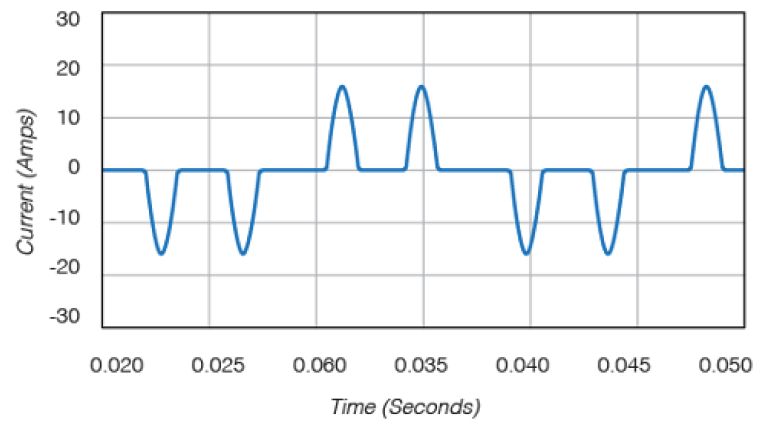
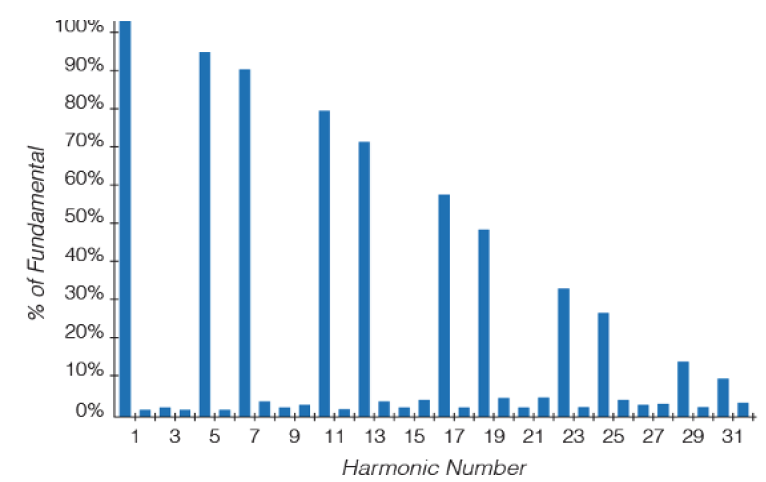
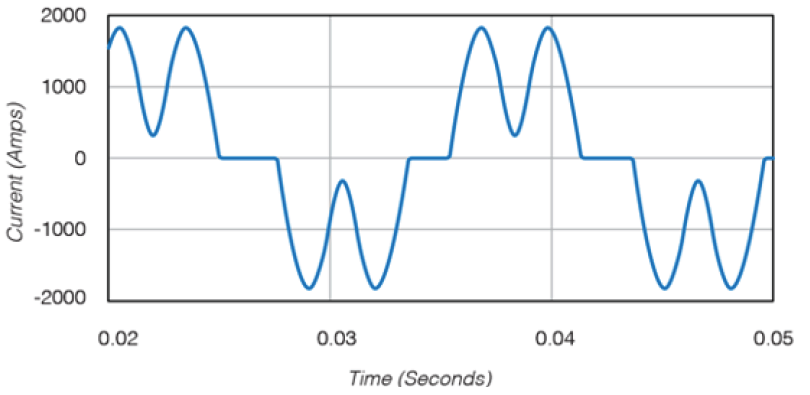
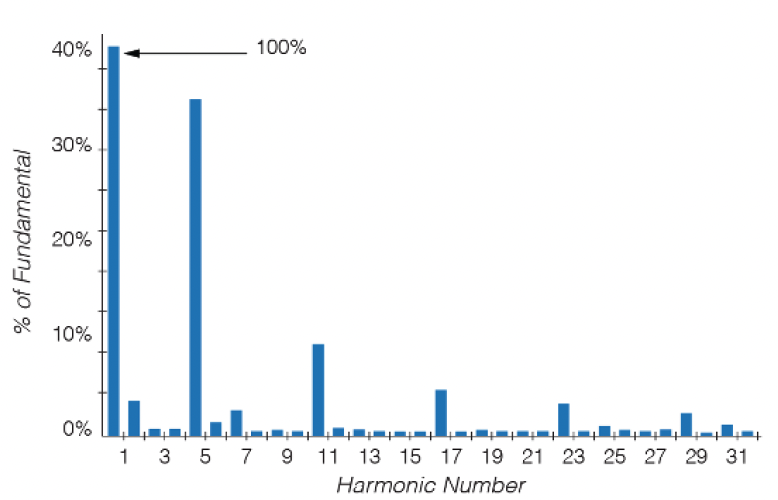
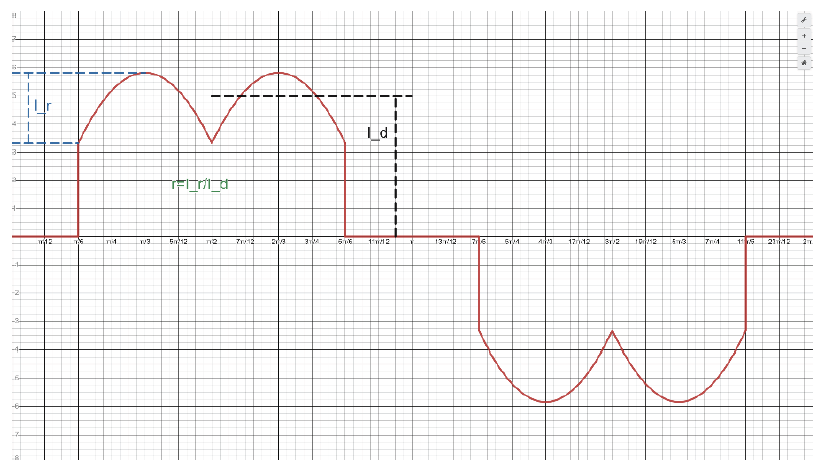
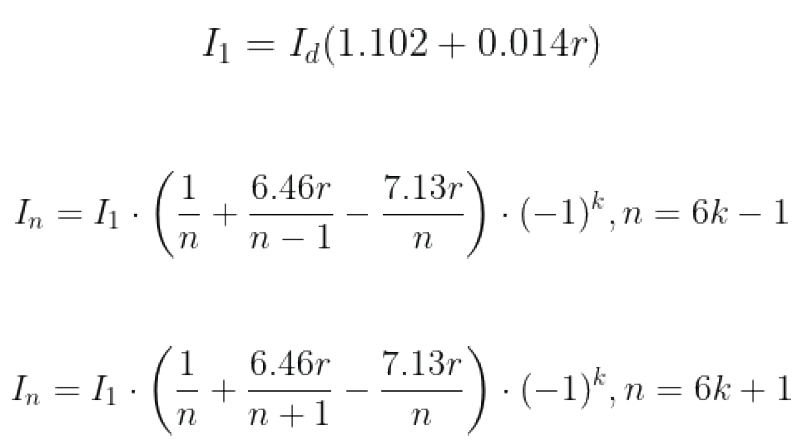
Figure 13 shows a useful approximation for the current con-duction graph described by Dobinson [2] which assumes that the current humps are the crests of sine waves between θ=π/3 and θ=2π/3 and the curve is described in terms of the ripple ratio r and the DC current Id. The first hump is described by
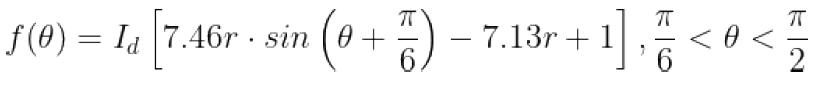
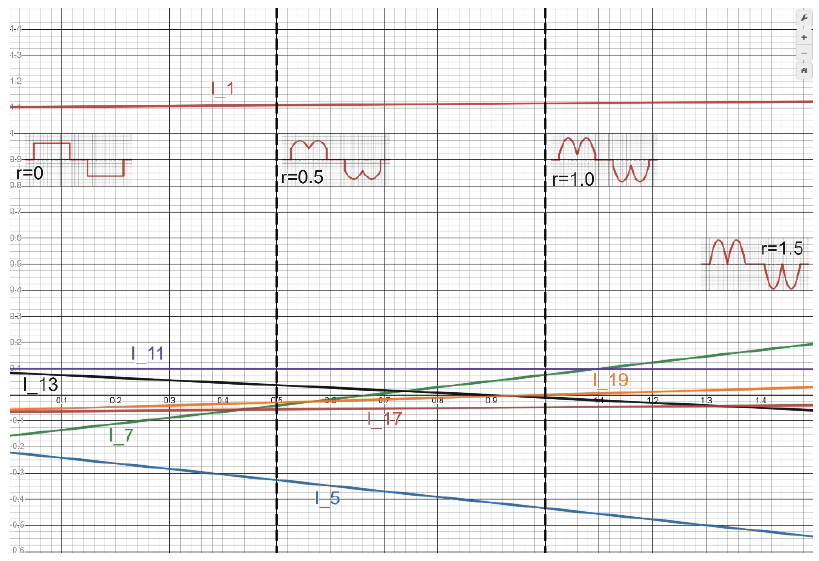
Figure 14 shows the harmonic content of this approximation as a function of the ripple ratio. These formulas are given by
Conclusion
This whitepaper described what a variable frequency drive isand how it works. The ideal 6 pole converter was described with the assumption that Id is constant. The ideal model was extended include Δ- connected transformer inputs and higher order poles. A physical recording was shown to demonstrate some differences between the ideal model and the physical model. Lastly, a more complex and physically accurate model was presented and the harmonic distribution of this model were presented.
Bibliography
[1] Arillaga, Jos and Watson, Neville. “3.6 Three-Phase Current Source Conversion.” Power System Harmonics Second Edition, John Wiley and Sons Ltd., 2003.
[2] Semlyen, A. and Shalsh, M. (2000) Principles of modular harmonic power f low methodology, Proc. IEE Gener, Transm. Distrib., 147(1),1-6.
[3] Desmos Calculator. (2023). Retrieved October 9, 2023, from https://www.desmos.com/calculator.
