Abstract
The properties panel in ProVision is a feature that is often overlooked but can greatly enhance the utility of graphs when preparing them for reports and presentations. By changing the properties of the graph and its annotations it is possible to create labels and visual effects that enhance the understandability of the captured power quality events. In this whitepaper we will discuss how to use the properties panel to create custom titles and axis labels for graphs and how to change annotations to give the consumers of your graphs additional understanding.
The Properties Panel
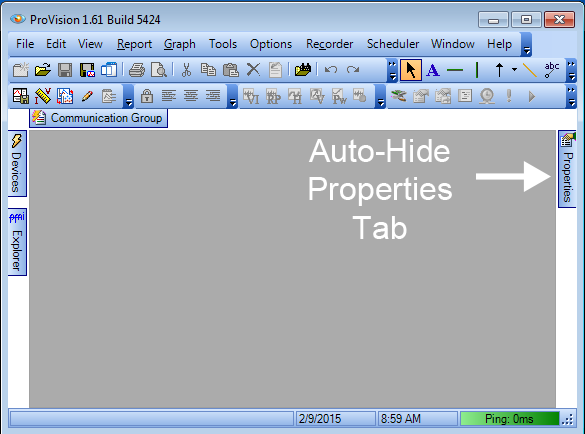
The properties panel was created to permit changes to various aspects of a graph or annotations without having to access menu-driven panels of settings. On a typical installation of ProVision, the properties tab is conveniently located on the right hand side of the screen and auto hides the properties panel by default (Figure 1). If the properties tab is not visible, it can be re-enabled by going to the main menu and selecting View > Properties.
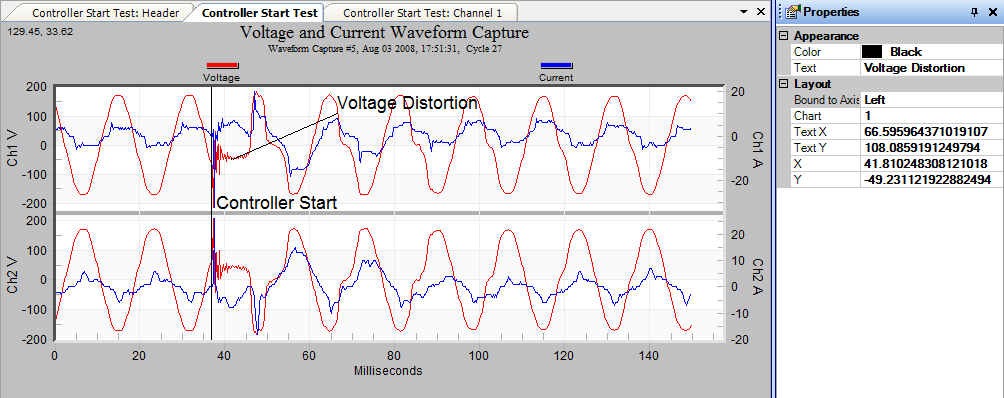
To keep the panel manageable, the properties panel allows editing of only one aspect of a graph at a time. To view the properties associated with an object it must first be selected. Use the left mouse button to click on the background of any graph and its properties will be listed in the properties panel. Likewise, if your graph already has annotations, clicking on one of the various annotations will expose the properties associated with that item as seen in (Figure 2). The selected object will not be highlighted so make sure to click the item you wish to edit before changing properties or you may end up editing the wrong one. If you place an annotation on the graph (e.g. a text label, arrow, etc.) that annotation will already be selected, and its properties loaded in the panel.
The properties panel has auto-hide enabled by default to maximize screen real estate. When doing heavy editing of properties, it may be desirable to have the panel visible at all times. To prevent auto hide from moving it out of the view, click the pin icon at the top of the properties panel to “pin” it in place. Click the pin again to unpin it later.
To change properties using the properties panel use the following steps:
- Open the properties box and pin it open to keep it easily accessible.
- Click in the field beside the desired property and a cursor will appear.
- Edit the text to change the selected field (or select from the drop-down options).
- The graph will be updated once the cursor is moved away from the property.
Each graph from the reports menu and each annotation will have a unique set of axis labels, trace colors, trace patterns and widths, and notes fields that are editable. We will look at several of these in turn.
Changing Graphs Properties
When creating a graph for a Word document or other report, it’s nice to present the context in which the recording was made so readers can tell at a glance what type of graph it is, why the graph is important, where the device was placed, and its configuration. Each graph in ProVision has a similar set of properties that allow control of the key items within the graph to make embedding this information possible.
The examples below use a Waveform Capture graph and an RMS Voltage and Current stripchart graph to demonstrate editing of properties.
Axis Labels
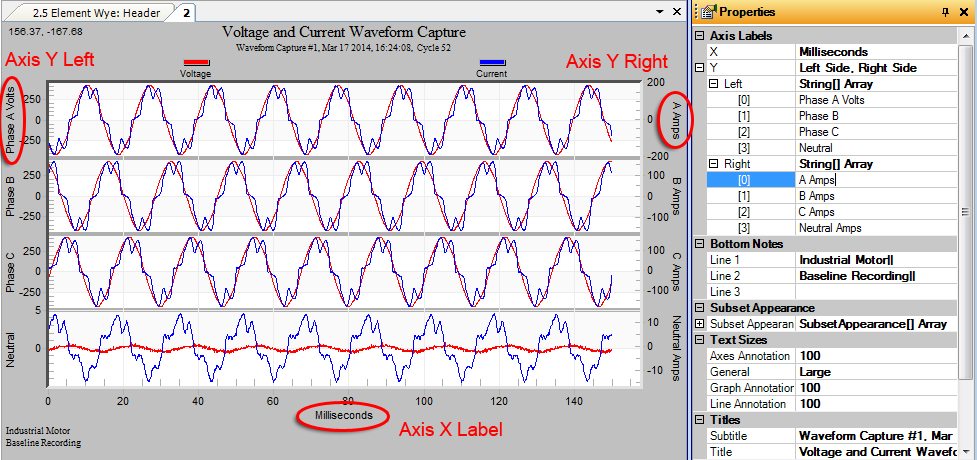
Both X and Y-axis labels can be changed using the properties panel. For 3 phase installations or special applications it may be informative to change the Y-axis values to indicate the configuration. Figure 3 shows a 3 phase WYE connection with Y axis values changed from their defaults (Ch 1 V, Ch 2 V, etc) to their connected phases. For stray voltage graphs, these may be changed to indicate where each channel was connected.
Bottom Notes
Allows the addition of notes to the bottom of the graph. Up to three lines of notes can be added. The default action is to display the notes from the report header here, but any text can be used.
Subset Appearance (Trace Color and Patterns)
This category of properties controls the color, size, and/or pattern of the various elements that can be drawn on a graph. For waveform captures you can change the color and thickness of the traces in the graph.
Text Sizes
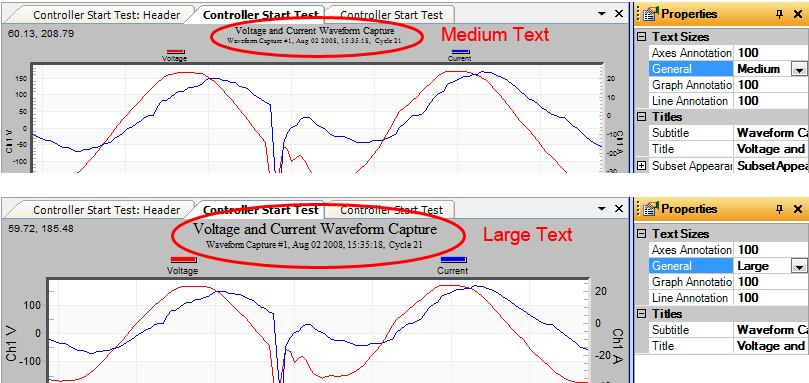
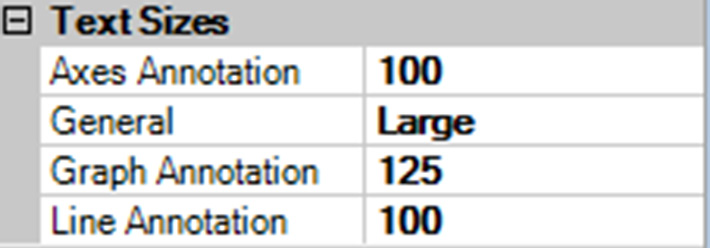
Many graphs end up resized after screen shots are taken, making the text too large or too small relative to the traces. Adjust the “General” property using the drop down box to change the text size of the Title, Axis Labels, and Bottom Notes. For example, to keep the text visible when scaling your images down, set the size to Large and the text will remain visible. The remaining text size settings relate to annotations and will be discussed in the next section (Figure 4).
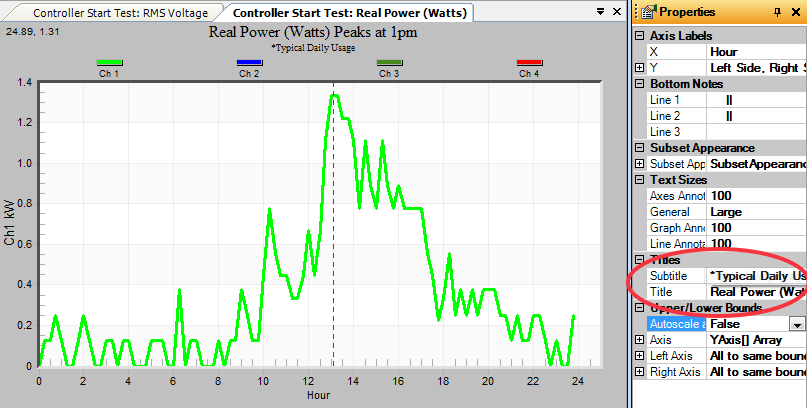
Titles (Title and Subtitle)
The Title section of the properties list has an entry to edit both the Title and the Subtitle fields as shown in Figure 5. Additionally, the subtitle field can be left blank to save space on the page if desired.
Upper and Lower Bounds
Since ProVision auto-scales the Y value axis by default, it may be desirable to normalize the bounds when comparisons need to be made between two separate graphs. To change the upper and lower bounds, expand the Axis list by clicking on the “+” sign then find the channel of interest. Next set Auto Scaling to false and manually set the upper and lower bounds fields to achieve the desired scaling results. ProVision will not allow the fields to be adjusted unless Auto Scaling is set to false.
Changing Annotation Properties
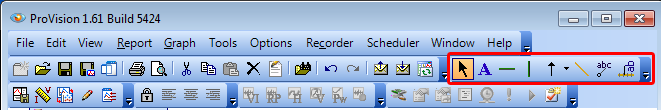
ProVision provides several annotation types to help visually document the important aspects of power quality events. Text, Horizontal and vertical line, arrow, and axis annotations can be added to a graph by selecting one of these items from the toolbar (Figure 6) then clicking the graph to place it. Once an annotation is added the properties are exposed by using the mouse to select the item in the graph.
Each annotation will have a different set of Appearance and Layout properties that can be changed using the Properties panel. The next few paragraphs give an overview of some of the more important features. The rest left for your exploration.
Appearance Properties
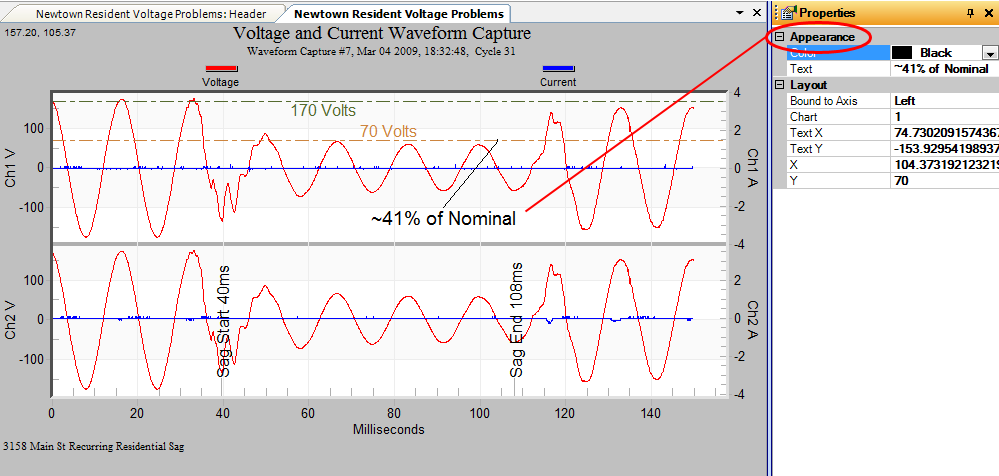
Annotations that display text have default values that can only be changed by using the properties panel. To change the default values of the Text and Pointer Annotations, edit Text field of the properties list. Properties such as Color, Line Type, and Text orientation can be changed by selection one of the options available from the drop-down list associated with each item as seen in Figure 7.
Annotation Positioning
Annotations can be positioned on the graph by left-clicking and dragging the element to the desired position or using absolute positioning via the Layout property. When positioning line annotations, a higher degree of position accuracy can be obtained by specifying the X or Y-axis coordinates using properties. With the properties window open, click and drag an annotation around the graph to see how it affects the Position properties. When the element is close to the desired position manually adjust the X and Y coordinates to the exact point of interest. It is important to note that the units for Y-axis placement are in actual measurement units. For example, to place a horizontal line at exactly 108V, enter “108” for the y-coordinate. The X-axis units are in real date/time units, so it’s easy to put markers at exact voltage/current values, or specific times.
Annotation Text Size
The text size annotation elements can be controlled as a group by using the Text Sizes properties of the graph that they are attached to. Click on the background of the graph to reveal the properties as shown in Figure 8. The default size for Axis, Graph, and Line annotations is 100, which acts as a percentage of the General property. Increasing this percentage will increase the text size and decreasing this number will decrease the text size of all annotations in the group.
For more information on the types and uses for each available annotation please see the related whitepaper Annotations In ProVision October 2013.
Additional Notes
Saving Properties Changes
Changes to properties can be made permanent by selecting File > Save from the main menu. Each time the recording is opened in the future the edited properties and annotations will be displayed.
Non-Editable Fields
Not all properties entries are editable so don’t be surprised if your changes do not seem to “stick.” Some of these properties act as placeholders to help identify the sub-elements that can be edited and others can be restricted by graph settings itself. Either way, if a property is grayed out or snaps back to its previous position after editing, it is a non-editable field.
Conclusion
Graph and annotation properties are an easy way to customize graphs without the need for an external annotation tool. Once the properties panel is discovered and explored, customization of graphs and annotations adding industry specific language becomes possible. This makes it easy to convey additional meaning to the intended audience without the need for external tools.
