Abstract
The ability to record CBEMA data points is a feature that is new in PMI Revolution recorders with firmware 5.66 or later. It is also available as part of a free upgrade to existing Revolutions by downloading the latest firmware package (available HERE). Subsequently, the ability to create graphs and reports of CBEMA data is now a capability in ProVision, as of version 1.61 build 4800. The individual points which compose the ITIC lines can also be modified in ProVision. This whitepaper is an introduction and overview of the new CBEMA support features in ProVision.
Initializing
To modify the CBEMA settings for a compatible device in ProVision, first open the initialization dialogue for that recorder. To do this, right-click the recorder in the Device Tree, and from the resultant context menu, select the Initialize option. From here, select the Advanced button, and then either select Next until the title bar displays CBEMA Settings, or select the tab for CBEMA. This is the CBEMA settings dialogue page.
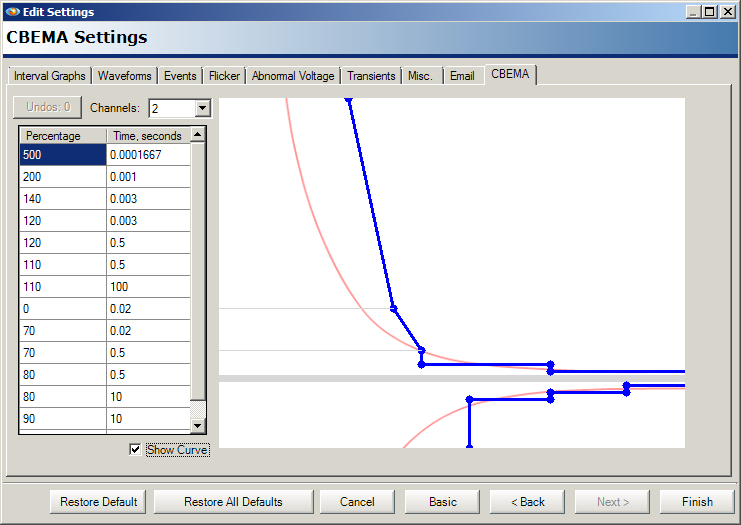
The settings dialogue page consists of several key components, as shown in Figure 1. The channels dropdown box instructs the recorder the maximum number of channels to record CBEMA event data for, up to a maximum of all four channels. The table is a tabular value of each point that can be manipulated and the location of that point. The graphic represents the current state of the ITIC lines to be used. Finally, the underlying CBEMA curve can have its visibility toggled via the Show Curve checkbox. The underlying CBEMA curve is not stored in the recorder, and is strictly for reference.
Note that there is a one-to-one correlation for each point in the chart and each point which composes a line segment in the ITIC graphic. Therefore, modifying the point either via the table or the graphic will cause the corresponding point data on the other to update in real time.
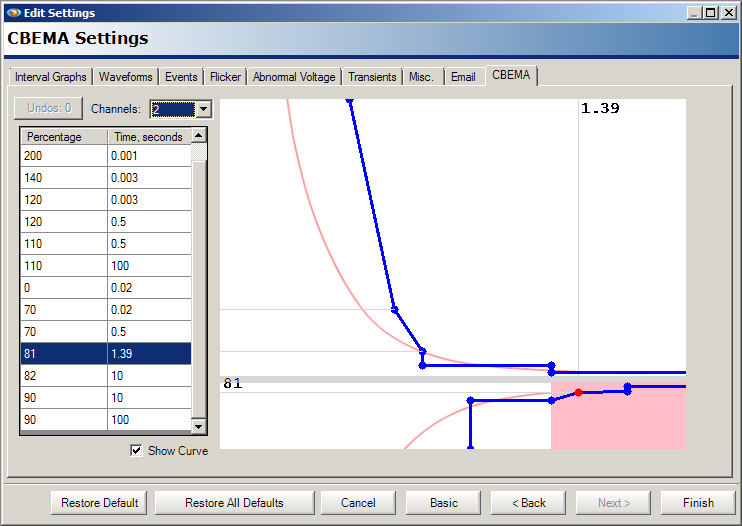
Moving points on the graphic is done using the drag-and-drop methodology as shown in Figure 2. To select a point, select it on the graphic by clicking and holding the left mouse button. Doing so causes the point to change color to indicate it is the current active point. It also shows the available region, shown in a lighter color, that the selected point can be moved within. The point can be repositioned by moving it to the desired location in the allowed region, then releasing the mouse button. Note that coordinate markers appear when the point is being moved, and that the corresponding value in the table updates to reflect the point’s current position.
Points can also be adjusted by using the table. Selecting any cell allows a custom value to be entered. When selecting a cell, the corresponding point is highlighted on the graphic and once changes to the cell are committed, the location of the point is updated as well. Note that cells will reject any value which falls outside the moveable range for the point. When adjusting the time value, only certain values are accepted based on the location of the current point. If a value is specified that is not included in the valid set, the value will be adjusted accordingly to correspond to the nearest one in the valid set.
The line segments form two distinct curves: an upper region and a lower region. In order to maintain the falling and rising structure of the upper and lower regions respectively, some of the points are moved automatically based on the positions of other points. Therefore, in the upper region, no point may be positioned in such a way that its percentage value is greater than the one preceding it or smaller than the one following it. By the same token, the time value must also fall between the time values for its neighbors as well. In order to accommodate this, whenever any point is moved, the others are repositioned accordingly. This holds true for the lower region as well, however, the logic is reversed on one part: no point may have a percentage value smaller than the one preceding it, or larger than the one following. The adjustment of the points occurs regardless of whether its value is modified either via a drag-and-drop operation or by manually specifying a new one.
ProVision also monitors the points moved and offers an Undo feature, which causes the graph to revert to its previous state before the point was moved. Note that each time a point is repositioned, a new undo state is created. This makes it possible to only undo the last moved point, while preserving prior modifications. In the event that it is necessary to revert the points to their original position, selecting the Restore Default button will move all points back to their initial locations.
After the points have been repositioned, the new settings can be sent to the recorder by selecting the Finish button. Note that this is part of the initialization procedure and that initializing the recorder will purge all recording data from it. Therefore, ensure the recording has been previously downloaded with ProVision, or that the recording has been deemed unnecessary, before performing the initialization process as the data will be irrecoverable after this point.
Reports
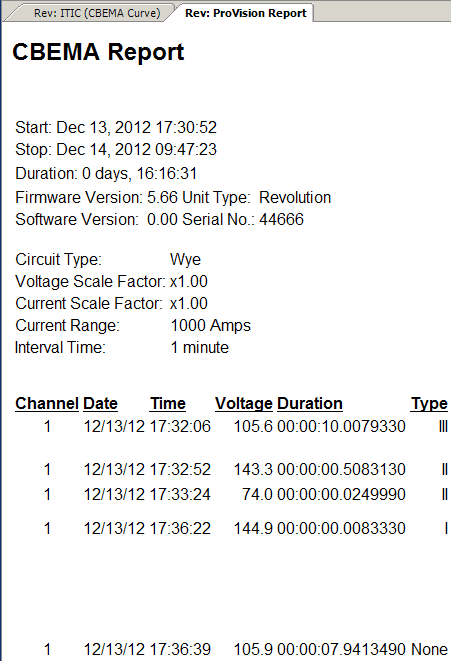
CBEMA reports can be generated from recordings containing CBEMA data as well. See Figure 3. In order to create a report, first select the checkbox next to the recording or recordings, then, on the report menu, select CBEMA report. The CBEMA report contains the channel the event occurred in, the date and time, the RMS voltage, the duration of the event, and the type.
From here, this report can be exported like any other report in ProVision.
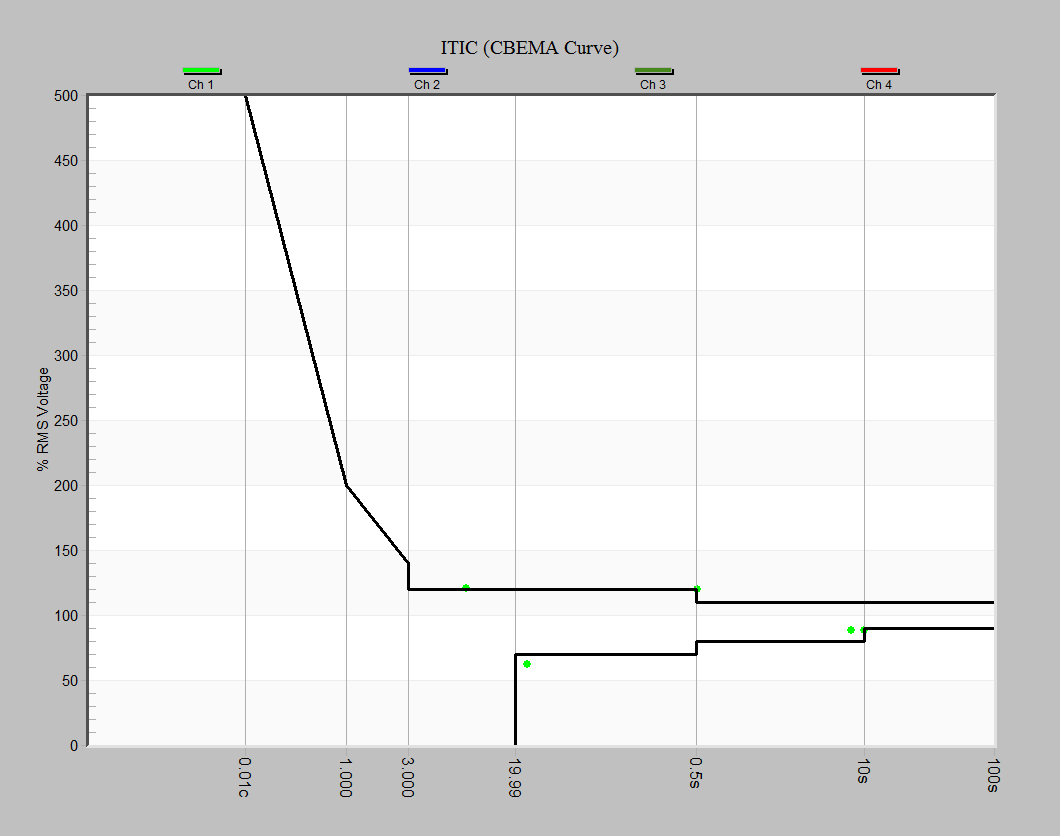
Each line of data on the report corresponds to a similar point on the graph. For example, in Figure 4, compare the left-most data point on the graph to the fourth entry on the report. The graph point and the report entry are both representative of the same event. Note the report displays the RMS voltage as a raw measurement, while the graph plots the value as a percentage of RMS voltage. Correlating events between the graph and the report is useful when examining CBEMA data, as there is some information included on the report which is unable to be graphed, such as the timestamp when the CBEMA event occurred. The reverse of this also holds true, by the graph showing a visual representation of where the event occurred in relation to others.
One measurement exclusive to the report is the CBEMA Type, represented as a roman numeral I, II, III, or none. Type I events designate a momentary, impulsive spike. Type II represents either a swell or sag. Type III signifies a sustained variation of the voltage. Note that Type I events are monitored independently of Type II and III. Based on this, None indicates that a CBEMA event occurred, but did not persist long enough to be categorized into Type II or Type III. The voltage extreme is recorded nevertheless.
Graphs
Much like the report, ProVision now also supports CBEMA graph types. To access this, simply select CBEMA Graph from the graph menu. Note that if no CBEMA data are present in the recording, the graph will not be created. Otherwise, the CBEMA graph will display the event data recorded. The ITIC lines drawn correlate to the ones used when the recorder was first initialized. Each point represents the corresponding event data (Figure 4).
Note that only one channel of data is shown, but up to four are supported. To enable or disable a specific channel, select the Select Plots toolbar button. In the resultant window, individual channels can have their visibility toggled. To set the visibility status of a channel, either place or clear the corresponding checkbox in the Min column. The other two columns are not used for determining channel visibility and their states will be ignored.
Note while there is a one-to-one correlation with the points presented in the report and the graph, the points are not necessarily presented in the same manner. On the report, voltage is listed as a flat value. However, on the graph, the point is plotted treating its value as a percentage of RMS voltage (120V). In addition, in the event that a negative transient occurs, this is treated in the report as a negative RMS voltage value. On the graph though, this point is plotted as the absolute value of the percentage of RMS voltage, and is plotted as a triangle, while standard values are plotted as circles.
Being able to modify the positions of the points that compose the ITIC lines can be particularly useful when wanting to include or exclude a given range of resultant points, while still preserving the underlying shape of the CBEMA curve.
