Abstract
Raw voltage, current, and power signals applied to a PQ recorder are often scaled versions of the true data under question. Transducers such as PTs and CTs step the voltage or current down to manageable levels. These transducers may themselves have individual calibration correction factors. Per-unit analysis involves manually scaling to a nominal reference level. Scale factors may even be able to correct for backwards CTs or other situations where a 180 degree phase shift is required. The many uses for scale factors are described here, along with the mechanism for applying them in ProVision.
Scale Factors in ProVision
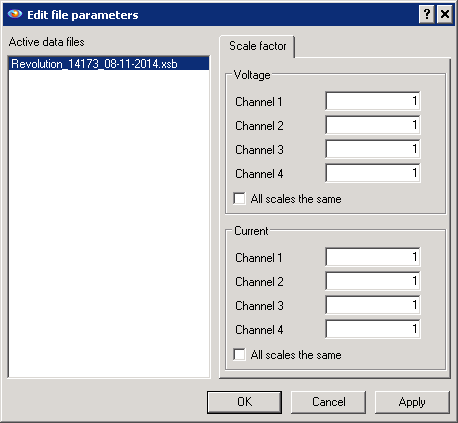
Scale factors are multiplicative constants which are applied to individual voltage and current channels. For each voltage and current channel, a decimal multiplier is stored within the recorded data file. Each of these factors defaults to 1.000 so that it has no net effect. To edit any of the scale factors choose Tools, Scale Factor in ProVision. As show in Figure 1, a dialog box will appear listing any open files and the existing scale factor values. A decimal value may be entered for any of the voltage and current channels. These may be positive or negative, but must be a single numeric value. For CT ratios such as 400:5 (where 200 A of primary current is transformed to 5 A of secondary), enter the numeric ratio as 80. For PT ratios, for example 22900/110 V, divide to get the decimal scale (22900/110 = 208.18). To simplify entering long decimals, the “All scales the same” checkbox may be used to lock each channel to a common value.
The four channels may have different values. In some situations the neutral or ground current may be measured directly, while the three phase currents are measured with CTs. In this situation the CT ratio should be entered for channels 1-3, while the 4th channel remains at 1.
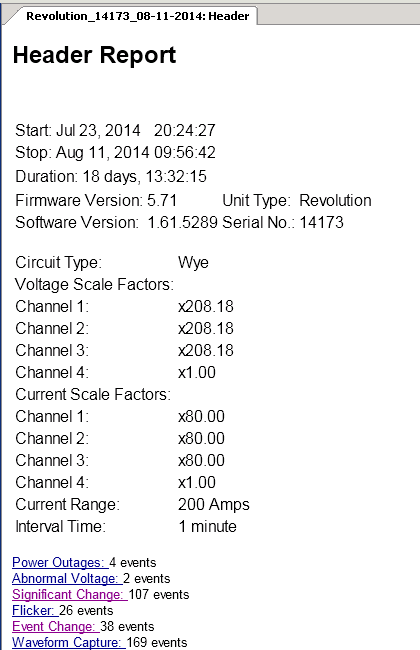
Once entered and “OK” is clicked, the scale factors are saved with each of the open files. As a reminder that scale factors are present, the Header Report will show all unique scale factors. Often the scale factors are identical for the set of voltage channels, and for current channels; in this case only a single factor is shown for each. If any of the individual channels have unique scale factors, all channels are display separately, as seen in Figure 2.
It’s important to note that scale factors are not sent to the recorder itself. The PQ recorder always measures and records the actual levels present on its inputs; scaling is only applied by ProVision to the recorded data downloaded into a file. Front panel readings, or live readings through ProVision are always of the unscaled actual physical signals.
The scale factors are applied to all graphs and reports where voltage, current, or power measurements may appear. For RMS voltage and current, the sign of the scale factor is not used, since these measurements are always positive by definition. This also applies to harmonic magnitudes, which are also always positive. Instantaneous voltage and current data (e.g. as shown in waveform or transient capture), however, does take the sign of the scale factor into account. A -1.0 scale factor for current will invert the signal as it appears in waveform capture, and derivative graphs such as the vector diagram and parametric graph. This property may be used to partially correct for a backwards CT, which is equivalent to a -1.0 scale factor, or 180 degree phase shift.
Real, reactive, and apparent power data is also affected by scaling factors. For these, both voltage and current scale factors are applied. For example, with the 400:5 and 22900/110 V examples above, real power would be scaled by 80 x 208.18 = 16655. A raw reading of 180 W would be scaled to 3 MW. Real and reactive power (Watts and VARs) are signed, and thus the signs of the voltage and current scale factors are applied. Apparent power (VA) is always positive; the sign of the scale factors is not used. Correcting for a backwards CT with a factor of -1.0 will correct the real and reactive power and leave the apparent power unchanged (and correct).
Uses for Scale Factors
There are several applications for scale factors, including some that aren’t immediately obvious. In some cases, multiple scale factors are needed; they may be multiplied together to form a composite factor that makes several corrections at once.
Applying PT and CT Ratios to Reflect Primary Values
This is a straightforward application – simply enter the applicable PT or CT ratio as described above. This will convert raw voltage, current, and power values as measured by the recorder into primary-side readings. To avoid very large numbers, either factor may be divided by 1000. For example, the 208.18 factor for the 22900/110 V PT example above could be entered as 0.20818, with the resulting voltages in kV instead Volts.
If specific correction factors are known for an individual PT or CT, these may be used separately for each channel as needed. For frequency-dependent transducers such as CCVTs, a correction factor may be needed separately for each harmonic. In this case, the scale factor may be adjusted specifically for the individual harmonic under analysis; this will be reflected in the harmonic stripchart and bar charts.
Correcting for Multiple or Fractional Turns Through a Clamp
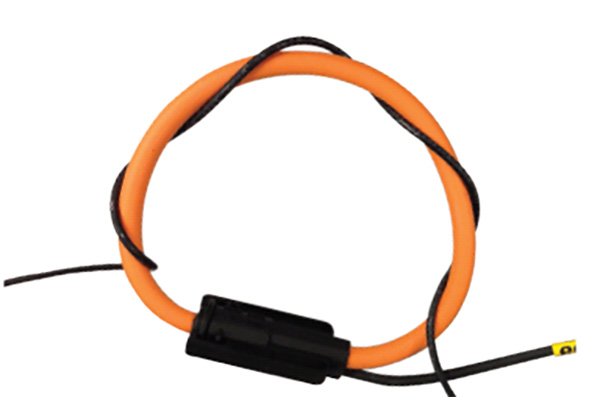
In a normal iron-core clamp-on or flexible CT installation, the CT is clamped around a single current-carrying conductor. This results in a 1:1 nominal ratio compared to what the PQ recorder is expecting. There are situations where the ratio may be different. To boost resolution in low current situations, the conductor may be wrapped around the CT multiple times (or in the case of the Flex CT, the CT may be wrapped around the conductor, as shown in Figure 3). Each extra turns adds to the measured current arithmetically. To compensate, the reciprocal value should be used for the scale factor. For example, if the current-carrying conductor is wrapped around the CT four times, the measured current will be four times higher than the actual current. To correct this in ProVision, a scale factor of 0.25 may be used.
Although it may seem pointless to use extra turns just to scale it back to the original value in ProVision, the benefit is extra resolution if the current is very small compared to the full-scale range. For example, a metering CT with a 5A max output may only provide a few tenths of amps (even under 0.1 A) if the load is small, or the CT oversized. With a 20A full-scale range, readings below 0.1 A are difficult to capture with high resolution. Using multiple turns boosts the physical current sensed by the CT, improving resolution in the measurement circuit. The scaling in ProVision is purely mathematical, so the increased resolution is preserved.
In some cases, multiple scale factors may be needed. In the above metering CT example, a 0.25 factor corrects for the four turns. But the metering CT itself has a ratio, e.g. 200:5. To reflect the original primary current, use 200/5 x 0.25 = 10 for the scale factor. The value of 10 corrects for the four turns and the metering ratio simultaneously.
In the opposite direction, CTs may not be clamped around the entire “conductor”. Large loads may be fed by multiple parallel conductors whose spacing makes it difficult or impossible to enclose with a single CT. For example, an 800 amp panel could be fed by parallel 600MCM copper conductors (per phase). The physical arrangement of the conductors and the CT size could prevent clamping around both conductors to measure the full phase current. If only one conductor is enclosed by the CT, the measured current will be (approximately) half the total – conceptually a “half-turn” around the conductor. To get the true phase current a scale factor of 2 should be used.
Converting to Per-Unit Values
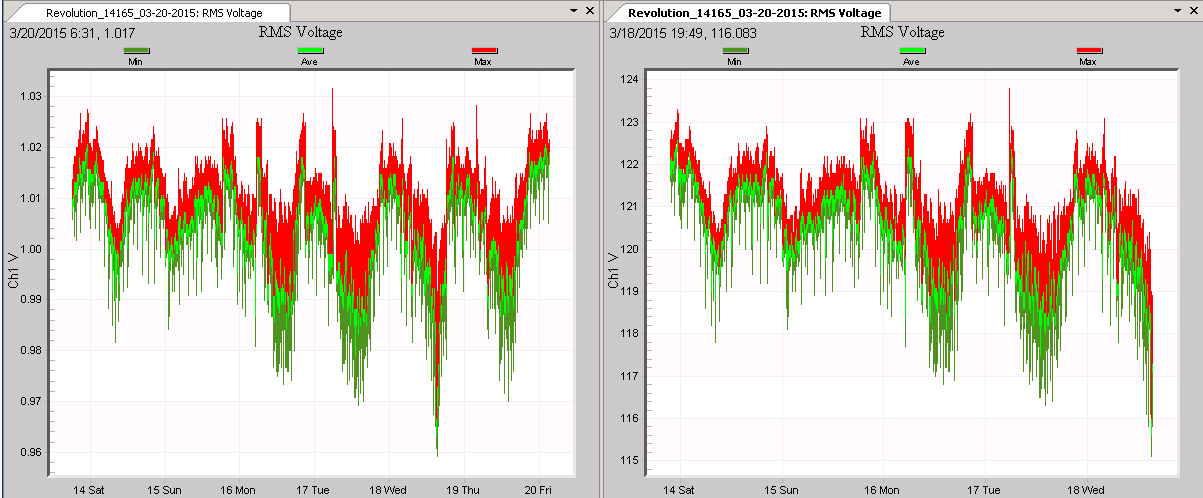
In some cases per-unit data is needed. To convert voltage readings into per-unit, create a scale factor of the inverse of the nominal voltage. E.g. for a 120V nominal, use 1/120 = 0.008333. To get a percentage-based per-unit, multiply that by 100 (e.g. 0.83333). Per-unit graphing is shown in Figure 4. The per-unit graph is on the left, with the original 120V-based data on the right.
Per-unit analysis is also useful when comparing data from circuits with different nominal voltages. For example, an upstream recording from PTs on the distribution line could be compared with a customer recording (on the same circuit) at the service entrance. The upstream PTs could be based on a 115 V nominal PT, while the customer might be 480/277. A scale factor of 1/115 = 0.006957 for the upstream file, and 1/277 = 0.0036101 for the customer file puts these voltage at a common 1.000 baseline nominal. Alternatively, factors of 1.0435 and 0.43321 would result in 120 V nominal graphing.
Per-unit may also be used for current or apparent power scaling. For a given transformer full scale rating, simply compute the appropriate scale factor so current (or apparent power) at full scale results in a value of 1.0. Typically this would be the reciprocal of the per-phase full load current.
Correcting for Backwards CTs
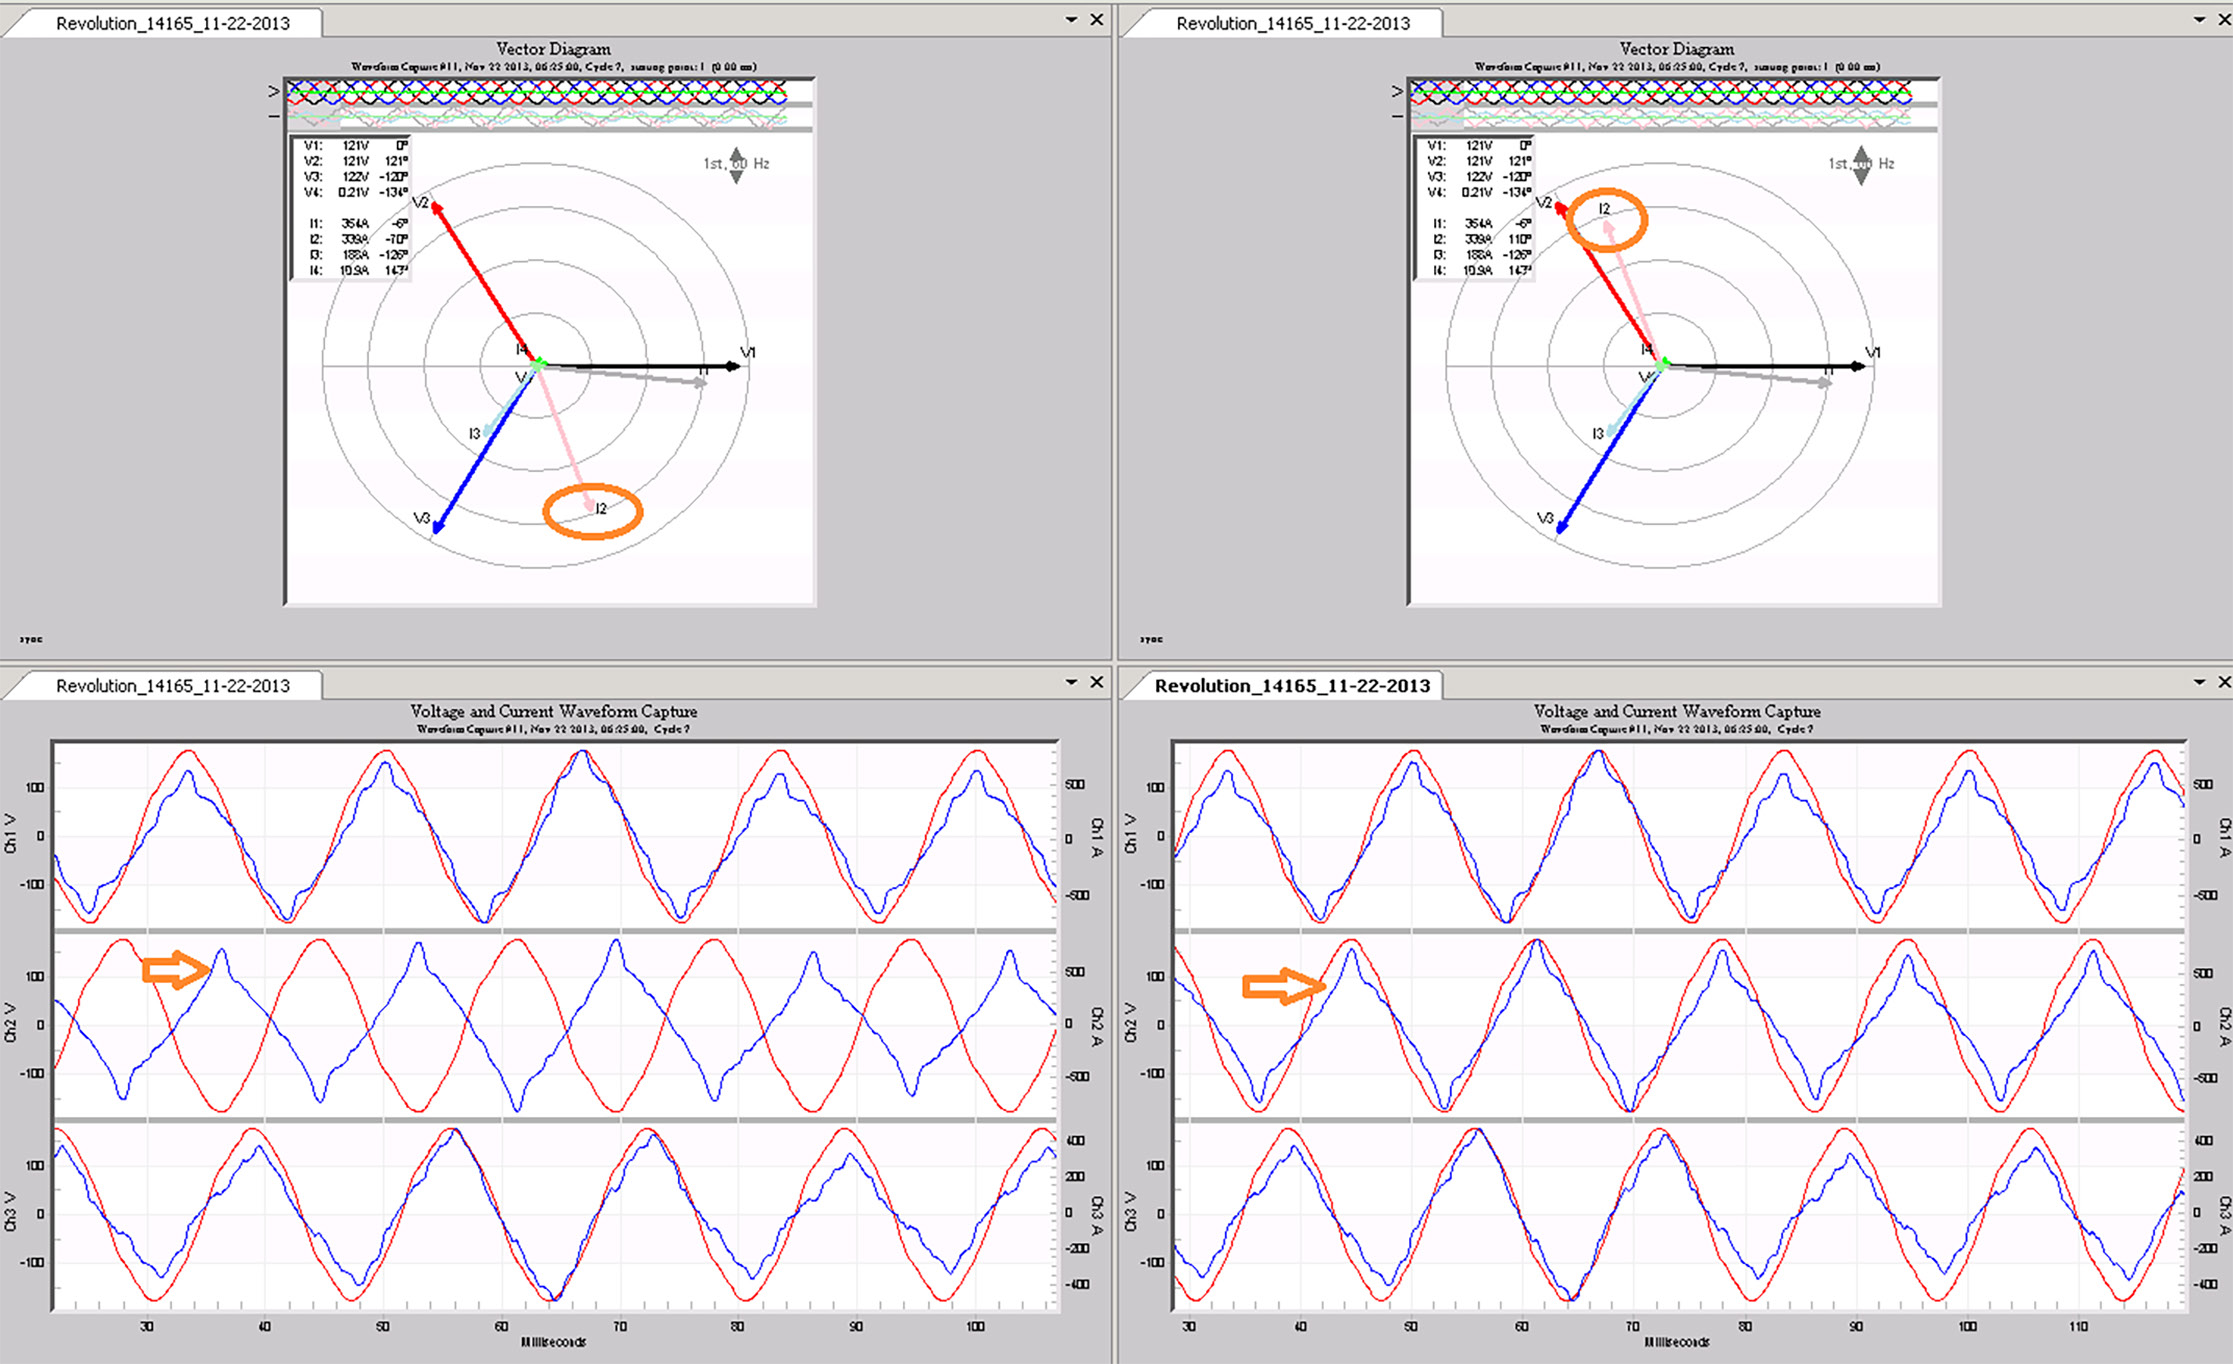
For proper power calculations and vector diagrams, measurement CTs must be installed so the arrow points towards the load. This is usually straightforward but there are situations where mistakes are easy to make. Metering CT cabinet wiring can be mislabeled and difficult to trace, especially with small secondary wiring. Multiple turns on the CT, as in Figure 3, can also make it more difficult to confirm the polarity. More rarely, with differential voltage inputs (e.g. on the VIP recorder) the voltage polarity for a phase may be reversed. Using a scale factor of -1 in ProVision will correct many of the effects from a backwards CT or voltage input. The RMS values are not affected, but real and reactive power, and instantaneous samples are modified. The negative sign can be combined with any real scaling that may also be needed. An example is shown in Figure 5. Here the phase B CT is installed backwards. The vector diagram and waveform capture on the left are the uncorrected values, and the corrected values are shown on the right.
Switching Power Flow Direction for Distributed Generation
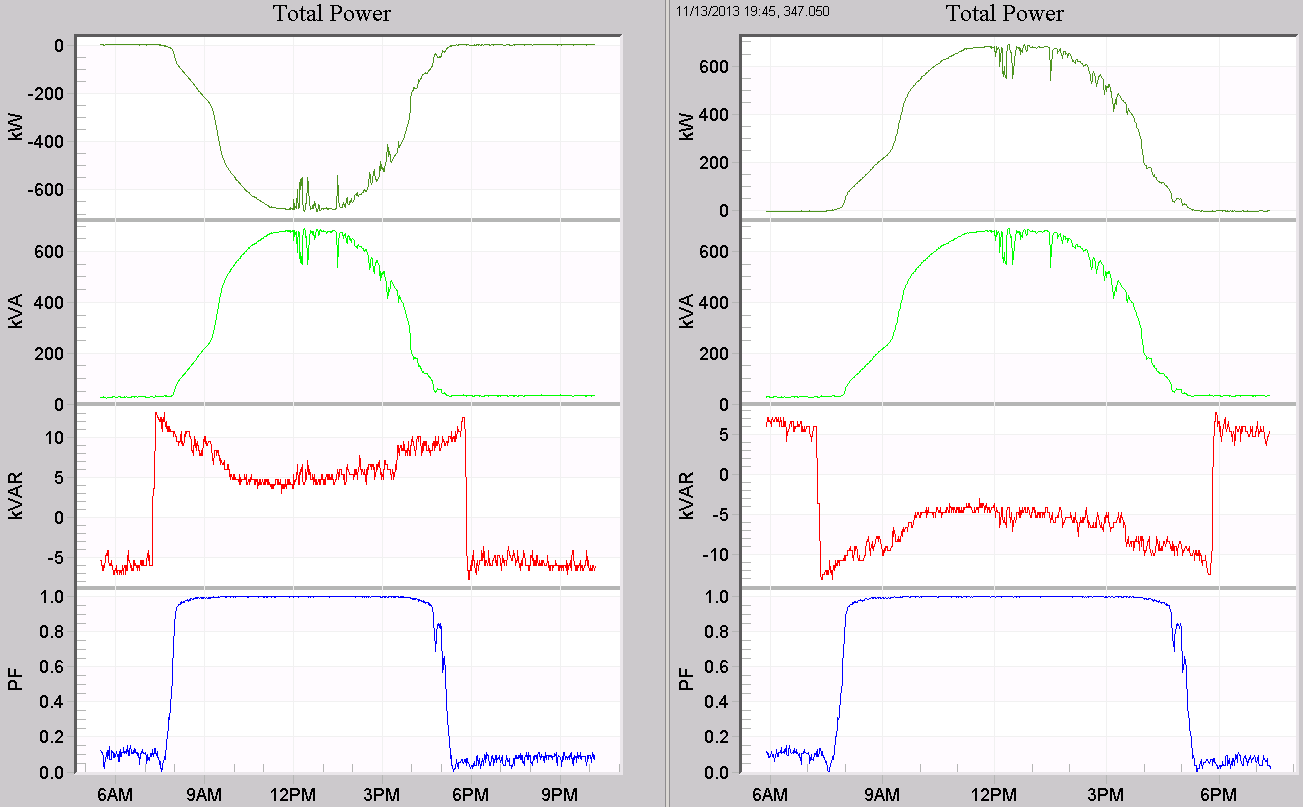
Using a -1 scale factor can also be useful even if all inputs are correct. In distributed generation monitoring (e.g. photovoltaic or wind turbine generation), the negative or positive power flow perspective may vary. From a utility viewpoint, local generation is usually considered negative power, but from the generator, it may be desired to view that as positive power. A -1 scale factor for current easily switches the polarity for real and reactive power, leaving apparent power and power factor unchanged. In Figure 6, a 1 MW solar farm is shown over a single day. The Total Power graph is shown as originally recorded on the left side, and with -1 for the current scale factors on the right side. The negative real power is flipped to positive power on the right graph. This presentation may be less confusing or more suitable for end users or for inclusion in other reports.
Conclusion
Scale factors, while simple in concept, allow for several correction effects and data analysis techniques. The ProVision scale factor implementation is designed for proper operation with signed and unsigned quantities, and for maximum ease of use while providing flexibility for more complex scaling needs. Several less commonly known uses for scale factors have been presented to help extract the most information possible from hard-won PQ data.
