Intro
PQ Canvass is an advanced cloud-based software application that enhances power quality analysis. PQ Canvass revolutionizes power monitoring with its comprehensive browser-based functionality, eliminating the need for additional software, and offering new capabilities such as real-time data streaming from compatible devices like the Guardian, Tensor and Seeker, which allows users to access data instantly during recording sessions.
Designed with versatility in mind, PQ Canvass boasts a responsive interface for managing PMI devices, recordings, and for live data visualization from any web browser. The platform also offers live waveform and meter displays for installation verification, spot checks, real-time analysis, and SMS and email alerts for prompt notification. For organizations with many accounts and devices, PQ Canvass offers seamless data sharing features, which will be further explored in this whitepaper.
Cloud Benefits
PQ Canvass’s cloud functionality elevates the management and analysis of power quality data to new heights. Users can synchronize data across their organization, enabling seamless data sharing and collaboration. With shared device thresholds, settings, and initialization parameters, organizations can maintain consistent configurations across various projects. Recordings can also be organized into custom folders and tagged and shared with external parties. Additionally, users can benefit from custom graph templates which can be easily shared and utilized across different accounts to maintain a uniform approach to data analysis.
PQ Canvass’s cloud capabilities are designed for specific use cases that require flexible data sharing and access. For instance, devices owned by a large utility can be used by a regional cooperative under the umbrella of that utility, ensuring both parties have the necessary data. Similarly, when a utility installs a device at a customer’s location, PQ Canvass facilitates the sharing of data with all parties, providing both the customer and the utility with real-time insights. By facilitating the distribution of resources, PQ Canvass enables organizations to work cohesively, making data-driven decisions more efficiently.
Users
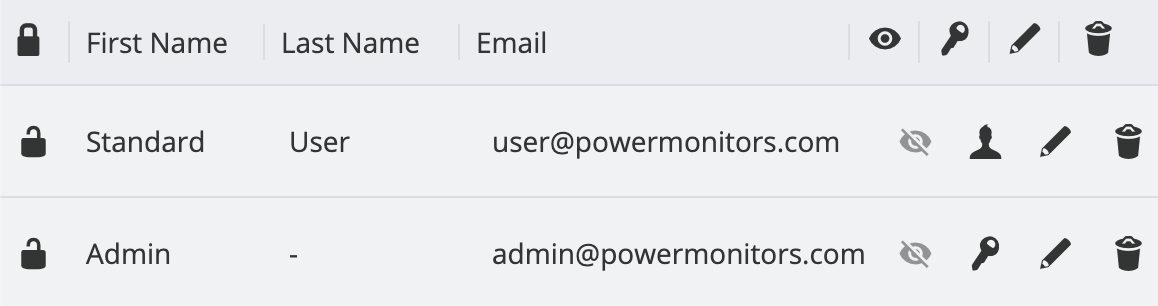
PQ Canvass implements a structured user account system that allows for detailed and hierarchical control over power monitoring devices and data. Every account and its respective sub-accounts are equipped with a unique roster of PQ Canvass users. With PQ Canvass, users can now be added to multiple accounts as either a standard or administrative user.
Administrators have the ability to oversee shared objects within PQ Canvass, with options including the revocation of access to items like recordings. This management capability extends to all account content, enabling account administrators to withdraw permissions for any shared object from any user within their account. PQ Canvass also allows users to be administrators of multiple sub-accounts, as well as the master account. This enables the editing of user access within the sub-accounts for administrators. So, users can become a member of two utility accounts at the same time, or even act as an administrator for multiple accounts.
To facilitate this, technical support from Power Monitors can set up and tailor the account associations and permissions as required.
Devices
In PQ Canvass, managing devices such as the Boomerang or Revolution, previously restricted to a single user account, can now be linked to multiple accounts. This enables users from different accounts to view and edit device properties without the limitations of sole ownership.
For these devices, the geographical location, label, and associations are shared across all accounts linked to a device. Additionally, device settings like the scale factors are synchronized to ensure all users are working with uniform parameters. For instance, to modify a target device’s details, a user can navigate to the device’s ‘Info’ section to edit parameters such as the label, number of customers, and location.
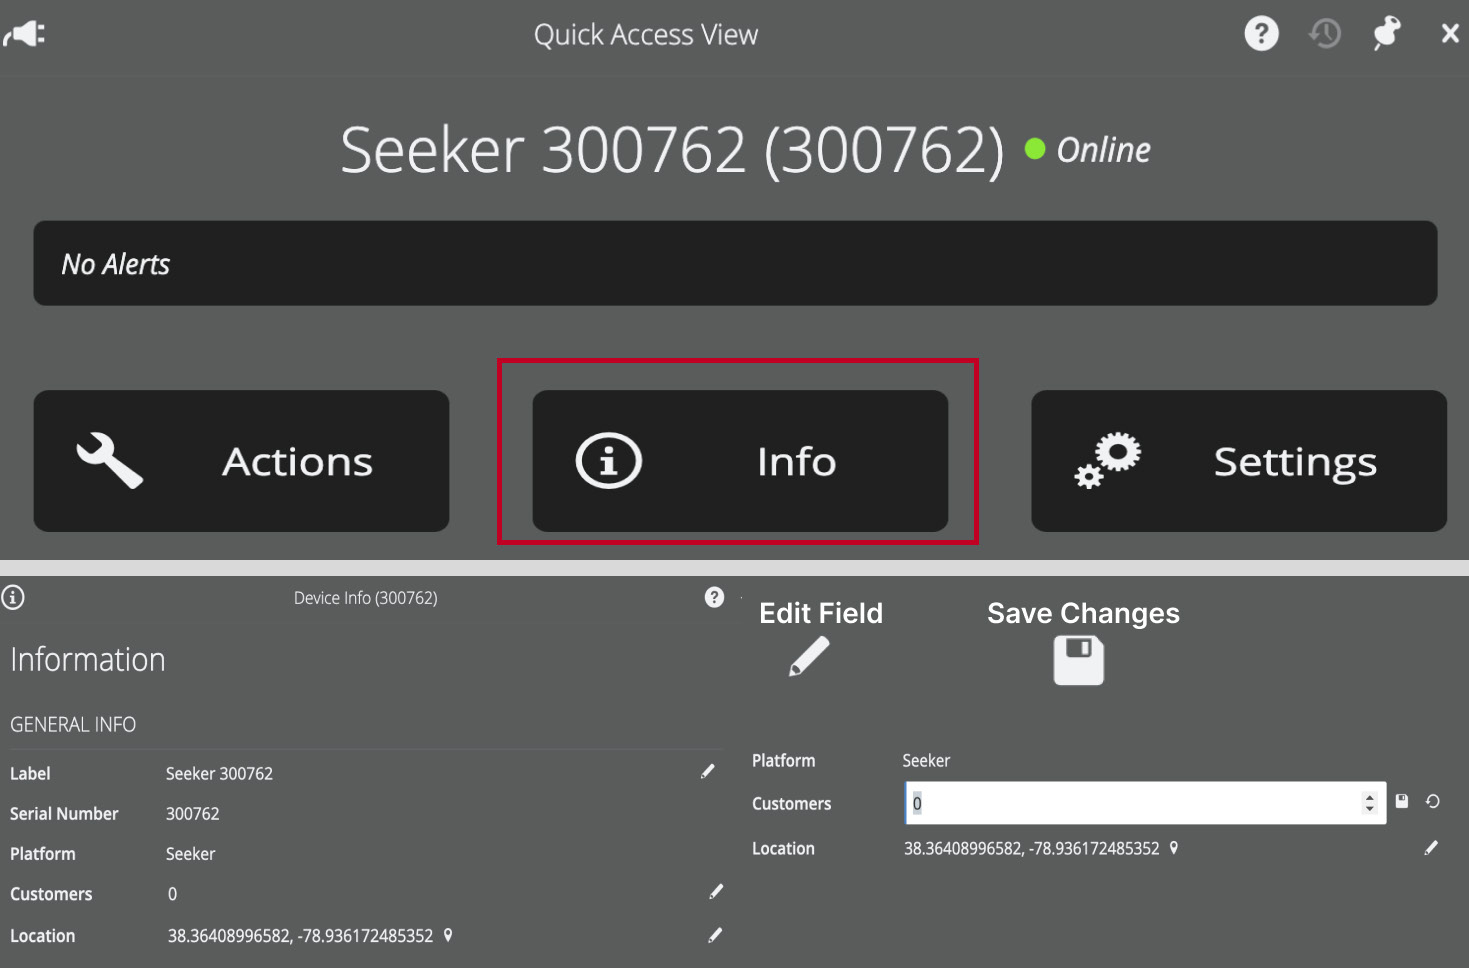
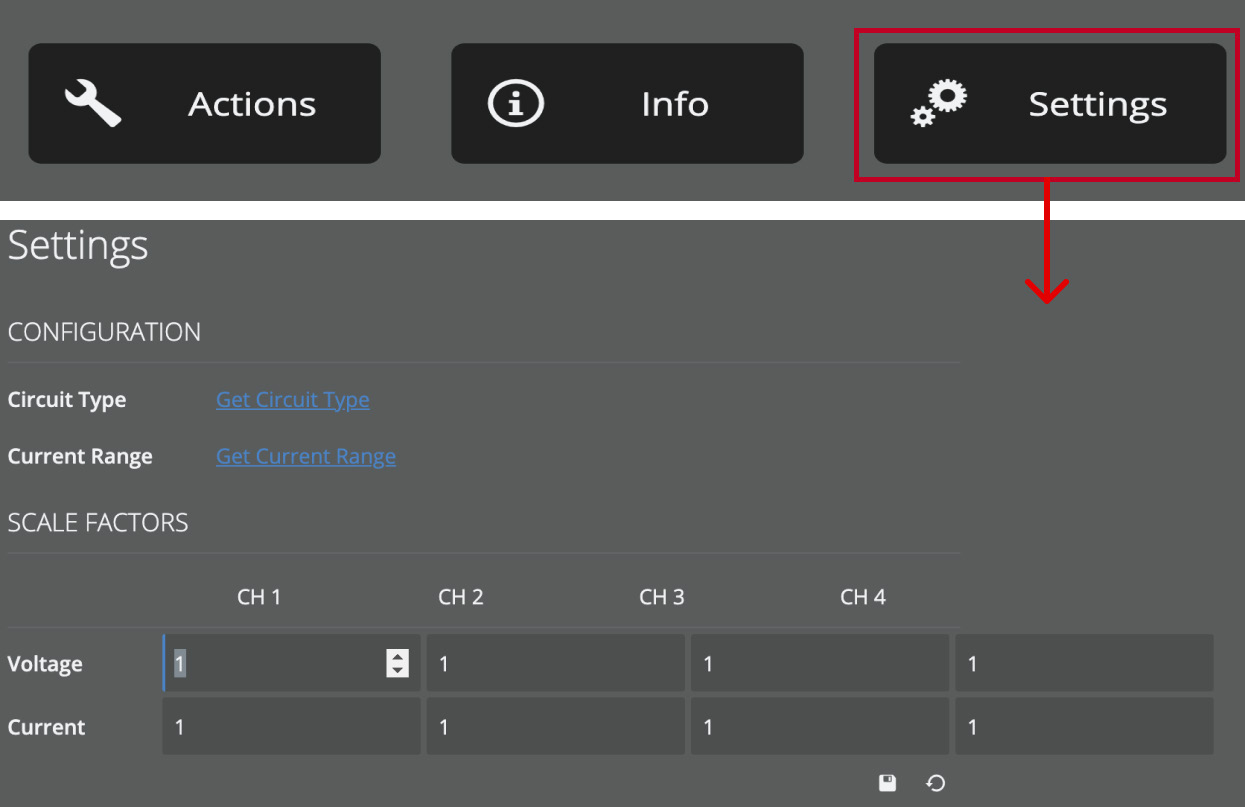
The device’s scale factors can be adjusted within the device ‘Settings’ by selecting the edit icon underneath the voltage and current scale factors, allowing the data to suit various analysis needs. It should be noted that scale factors that are applied at the device level are only applied to the 1 second RMS streaming interval data and they are not applied to recordings. If a user wishes to apply custom scale factors within a recording, they can do so by editing them from the recording Header Report.
Notifications
In PQ Canvass, the alert and event configuration for devices is synchronized across all accounts. For account administrators, PQ Canvass provides the capability to establish notification lists, which serve to inform designated users about specific events or alerts related to their devices. Users have the flexibility to receive these notifications via email and/or SMS, according to their preference.
Alert thresholds are configured within the device itself. While users can set the device thresholds, only users who are subscribed to receive notifications for that specific device will be alerted. This allows each account to manage its own set of alerts/events for shared devices, without any concern about unwanted emails or text messages.
For more information about configuring alerts in PQ Canvass, read Configuring Alerts with a Guardian in PQ Canvass.
Recordings
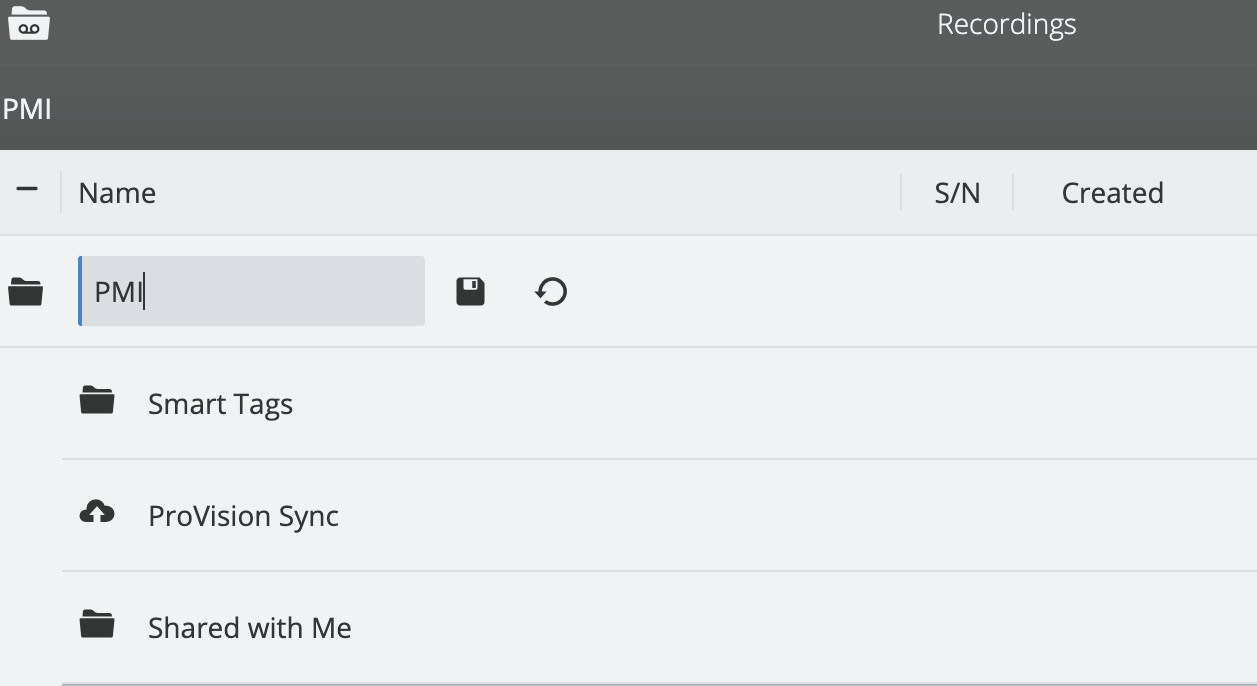
The recordings in PQ Canvass are designed to facilitate comprehensive data management so that users can create a site-specific study for troubleshooting customer complaints or performing other power quality investigations. Users across different accounts can access recordings, which can be organized into common folders with customizable labels for identification. Furthermore, PQ Canvass allows for the creation of custom graph templates specifically for interval data, enhancing the visualization and interpretation of recordings.
Additionally, users can upload recordings from their PC to PQ Canvass using the ProVision Sync feature within ProVision. Found under the recordings tab and marked by a cloud icon, ProVision Sync collects all uploaded files, making them available for inspection and analysis.
With PQ Canvass, it’s never been easier to share recordings. Recordings can now be shared via email with controlled permissions. Users can control the link expiration, viewership permissions, and add or remove emails from the shared email list. This suite of features fosters accessibility and collaboration among team members and external parties.
Graphs
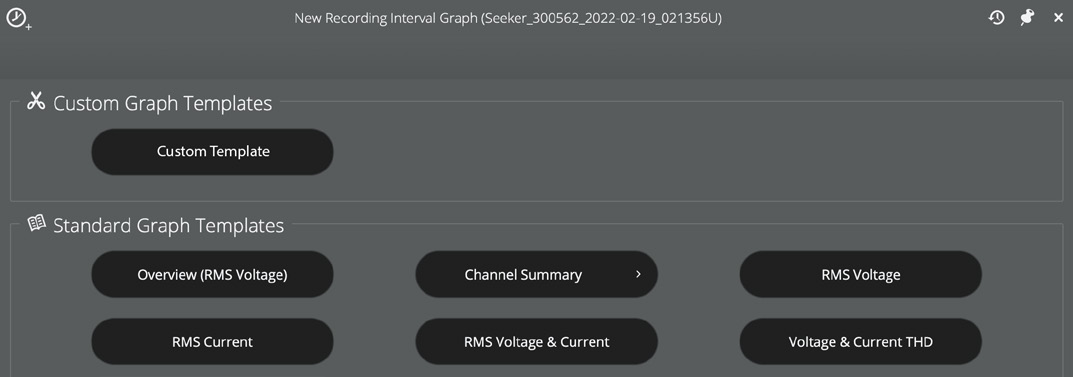
PQ Canvass’s graphing capabilities are designed to provide detailed insights into power data through a variety of visualization options. It supports an array of graph types including stripcharts, histograms, daily profiles, waveform captures, vector diagrams and more. The platform’s Graph Template Editor is a tool that enables users to create custom templates that can be shared with other accounts. These templates allow for granular control over multiple measures, channels, and scaling factors to be selected and mixed together. And, it even features custom display elements such as plot titles, axis labels, and color schemes.
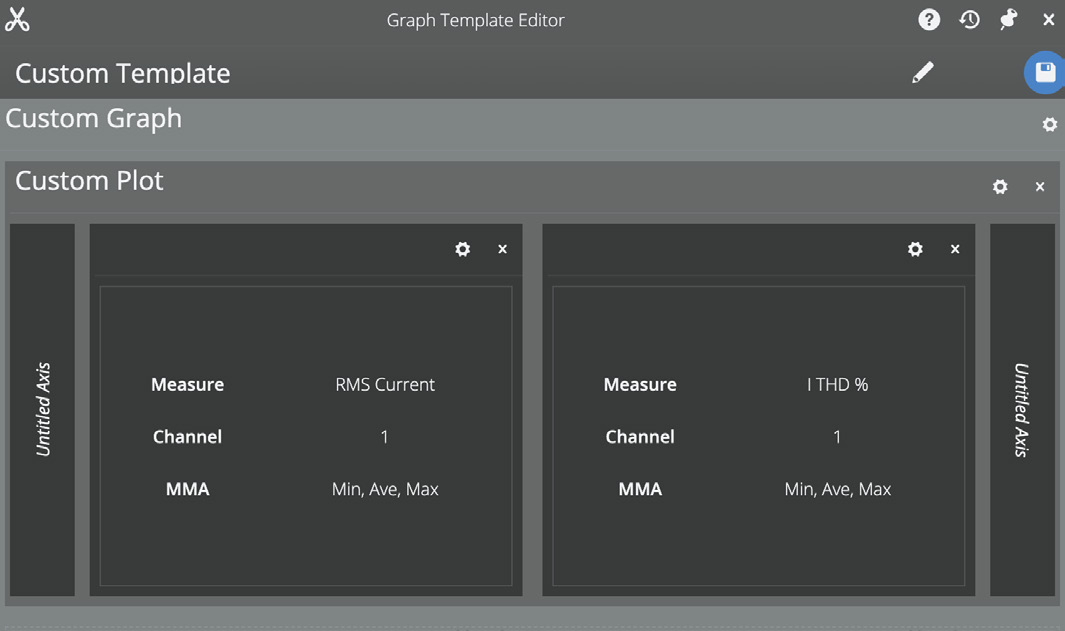
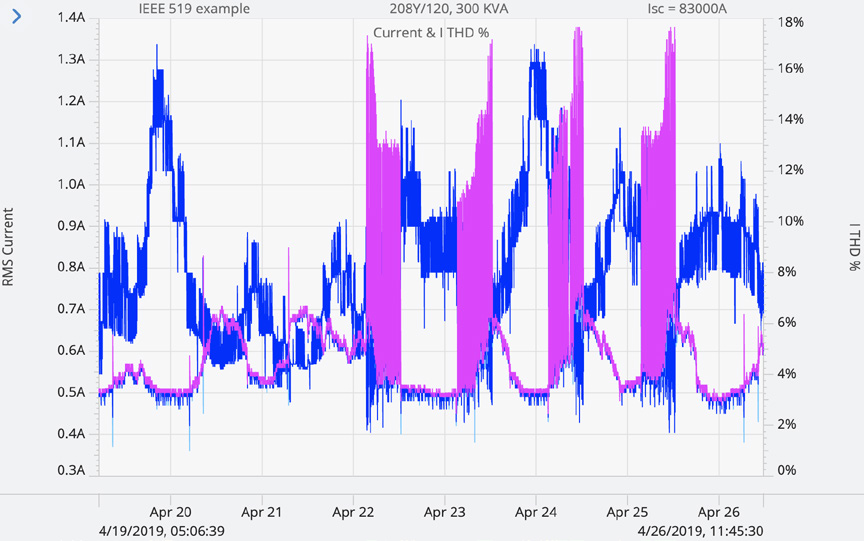
For example, a user could create their own custom line graph with RMS Current on the left-axis and ITHD % on the right. This template can be named and saved in order to apply it to any device for any user.
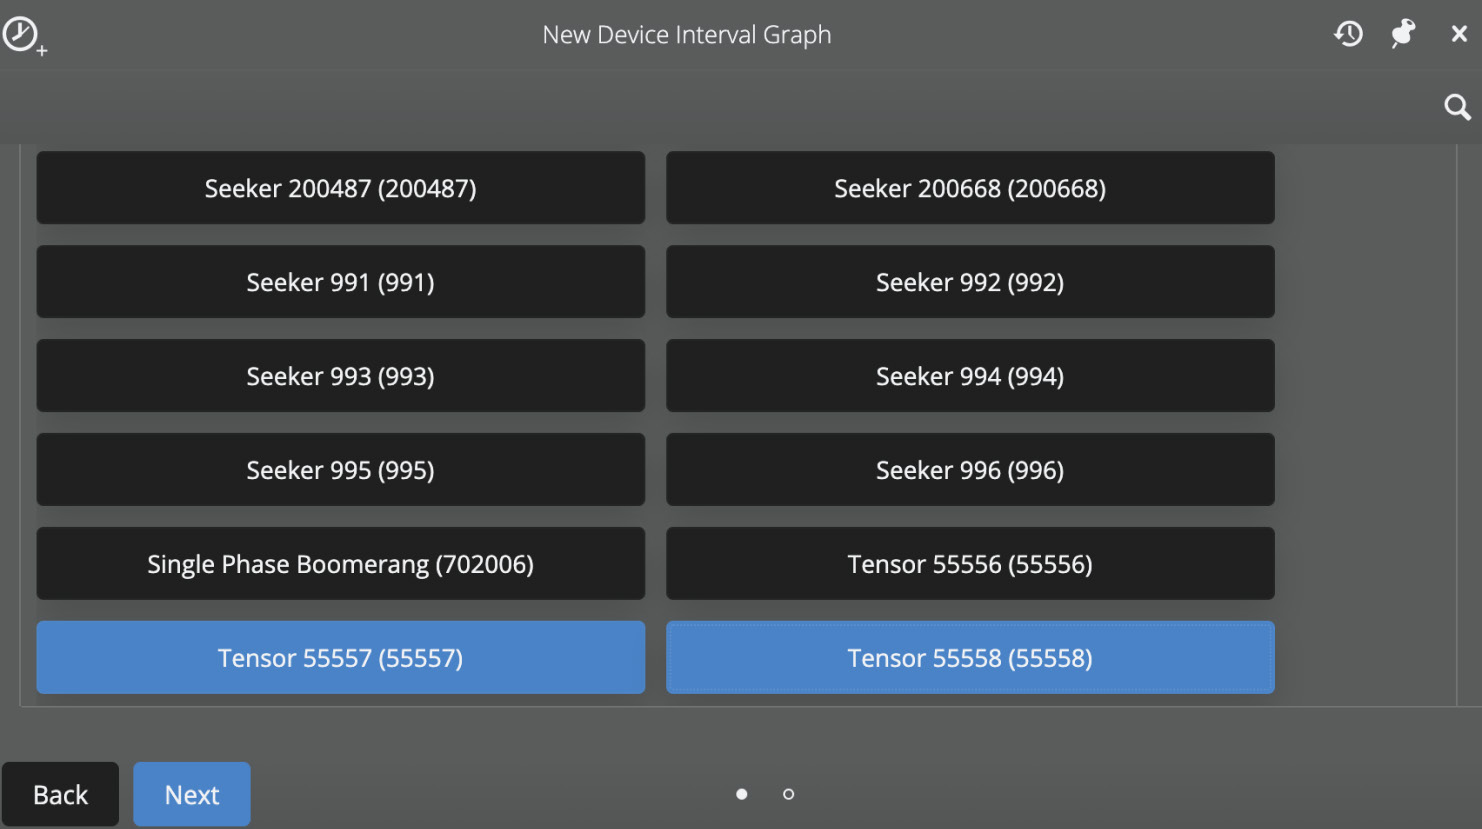
The PQ Canvass graphs also allow for multi-device analysis, where users can view streaming data from several devices simultaneously with just a few clicks. Users have the ability to create an interval, daily profile, or histogram graph using a standard graph template or a custom-created one, allowing users to fully control their data to suit their specific needs. This is particularly useful for correlating data across various points, like tracking load patterns or identifying voltage fluctuations across a broad geographical area. Additionally, these graphs can be enhanced with annotations, providing the ability to mark significant sections for easy reference by team members or for future review.
Conclusion
PQ Canvass has been meticulously crafted to offer an extensive suite of collaborative features for power quality analysis. Through its cloud-based framework, PQ Canvass provides shared device management, enabling consistent settings and thresholds across multiple accounts. Its recordings feature shared folders with labeling for organization, as well as the ability to share recordings with other users. The inclusion of ProVision Sync allows for backwards-compatibility from the user’s collection of existing ProVision recordings. PQ Canvass’s graphs extend data collaboration by offering shareable graph templates.
These features collectively underpin the comprehensive benefits of PQ Canvass: an integrated, seamless environment for managing, analyzing, and sharing power quality data. The platform ensures that all users within an organization can effectively collaborate and make informed decisions, making it a powerful tool for power monitoring.
For more information on PQ Canvass visit: www.powermonitors.com/product/pq-canvass-access/
