Abstract
Harmonics and interharmonics are some of the most complex power quality quantities to measure and analyze. The Revolution is capable of recording interharmonic data, and ProVision can present the data, but choosing to record all interharmonics for all channels may not always be the best choice. In many cases, specific interharmonic data is not needed; in these cases interharmonic THDs may suffice.
This whitepaper gives an overview of using THD groups and subgroup recordings with the Revolution to determine if harmonic and interharmonic problems exist, to give information about the type of problem, and to show where to look next for further analysis.
Definition of THD
Total Harmonic Distortion (THD) is a way of quantifying the amount of harmonic content in a voltage or current waveform with a single value. In addition to measuring the amount of distortion, THD can also be used to help track down the source of harmonic and interharmonic distortions. As defined in the whitepaper Understanding Total Harmonic Distortion, THD is a measure of harmonic distortion. Expressed as a percent, the THD is a comparison of the 60Hz fundamental magnitude to the total of all harmonics. A value of 0% indicates a pure 60Hz sinewave with no distortion. Typical voltage THD levels are 0.5 to 5%, while current THD ranges from 0.5% to 80% or more, depending on the type of load. The sizeable difference in those ranges is due to the system impedance and the relationship to voltage and current in the distribution system.
When applied to interharmonic groups and subgroups, it is the comparison of the fundamental magnitude of the group to the total of all harmonics in the group. Figure 1 shows the Interharmonic group and subgroup definitions. These THD values are defined in IEC 61000-4-7, and are computed from different combinations of individual interharmonics, groups, or subgroups.
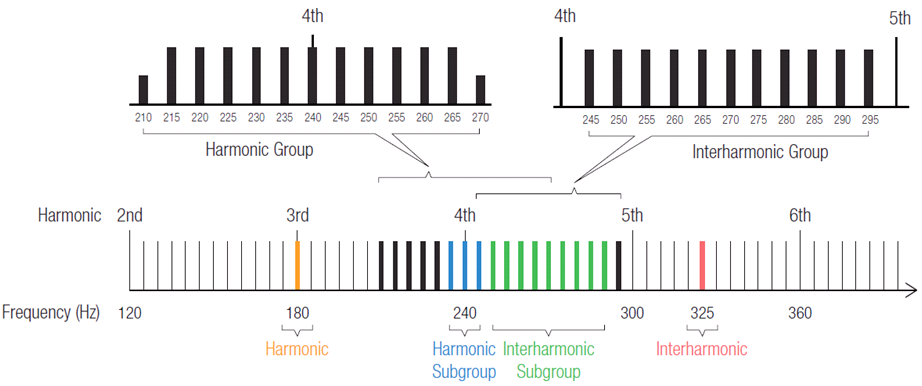
For example, the formula for the THD of a harmonic subgroup is the ratio of the total of the harmonic subgroups(sg) to the total of the harmonic of the subgroup associated with the fundamental.
Although recording individual harmonics and interharmonics allows for a more detailed analysis, a full interharmonic recording consumes a very large amount of memory, resulting in shorter recording times or very large data files. Only recording voltage and current group and subgroup THD instead of a full set of harmonics and interharmonics does not take up much extra memory, since the THD values are aggregates over the entire spectrum (regardless of the harmonics selected). So there is little penalty in recording each THD type. It is often worth recording as a “just in case”, even on non-harmonic investigations.
Using the THD of Harmonic and Interharmonic Group and Subgroup Measures
Balancing the amount of data needed for good analysis along with memory capacity and recording time can sometimes be very challenging especially dealing with interharmonics. Most of the time, there is not an interharmonic problem, and just recording the interharmonic THD (of some sort) is sufficient to show that.
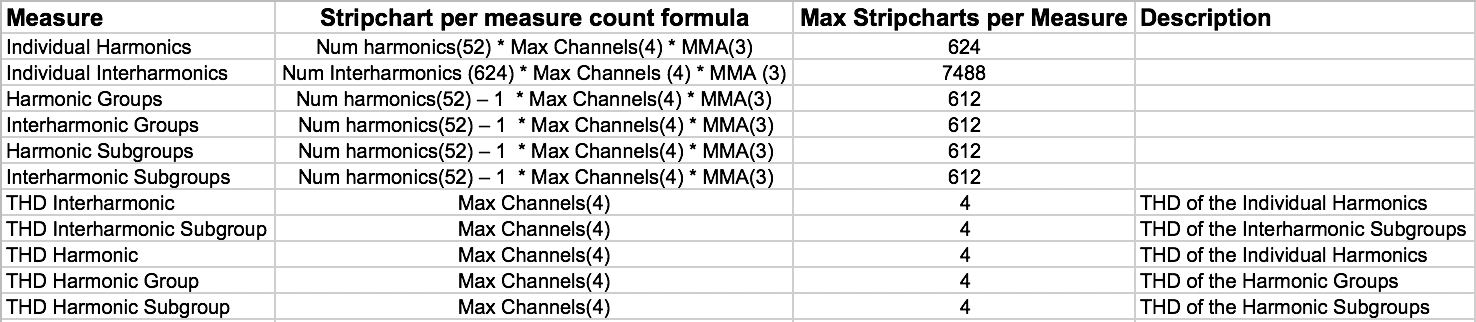
Recording full interharmonic information can consume memory quickly. Figure 2 shows the number of stripcharts generated based on measure types selected for recording. Note that full interharmonic stripchart recording generates 7488 stripcharts; double that if recording voltage and current interharmonic stripcharts. That would be 14976 stripcharts generated when recording all interharmonic stripcharts for all channels for voltage and current. Recording this many stripcharts can quickly use up available recording memory, and is a challenge to fully examine.
Recording the harmonic and interharmonic THDs uses little memory and can show if there is a problem relating to interharmonics. The THD values do not provide information about which specific interharmonics or spectral area is a problem, but if they reveal a distortion problem then you can look at interharmonic groups, harmonic groups or subgroups along with periodic waveform captures to help identify the problem. If necessary, you can record the individual interharmonics for complete analysis. If an interharmonic or harmonic problem is indicated, see the whitepaper Interharmonic Recording and Data Analysis for more information on investigating interharmonic problems.
ProVision can graph the harmonic and interharmonic groups and subgroups. Figure 3 shows an interharmonic THD graph as displayed in ProVision.
ProVision Setup for Harmonic and Interharmonic THDs
To record the interharmonic THDs at least one harmonic must be selected. It is suggested that the primary harmonic be selected. Then the THDs can be selected for voltage and or current. Figure 4 shows the ProVision setup dialog for harmonics (orange) and interharmonics (green).
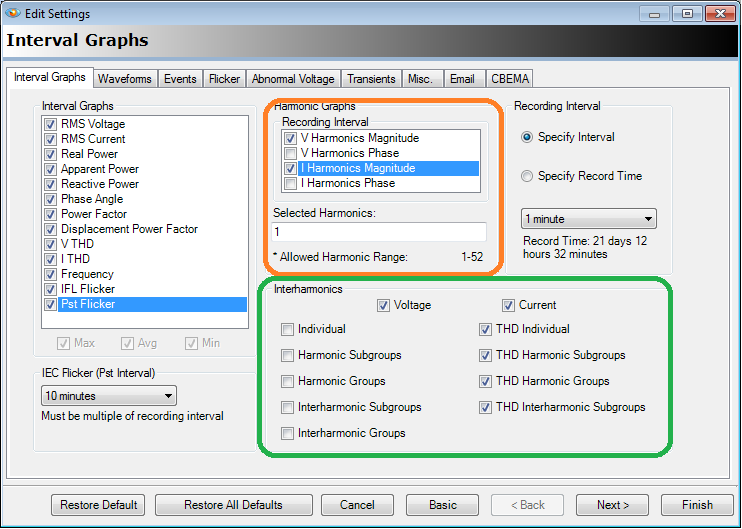
The interharmonic THDs are shown on the right side of the interharmonics region shown in green in Figure 4. These may be recorded without enabling the specific interharmonics, and are a good way to quantify the amount of interharmonics present without having to record each of them.
Conclusion
The Revolution is a useful power quality analysis tool that can capture large amounts of data and provide powerful insights when teamed up with ProVision software. While the Revolution has the capability to record interharmonics, it may not be necessary in all cases. For basic recording where harmonics and interharmonics aren’t known to be a problem but are a possibility, record at least the interharmonic THDs.
