Abstract
As hardware improvements are made over time, the software that communicates with and controls that hardware must also evolve. Improvements in hardware, operating systems and most importantly, user feedback all contribute to changes in the software, resulting in a better, more user-friendly interface. Winscan was written in the Windows 95 era, and while advanced at the time (replacing older DOS software), it has been superseded by ProVision. Using the Microsoft .NET Framework, ProVision has many advanced analysis and communications features, and is a much more powerful tool than Winscan.
Automatic Updates with ProVision
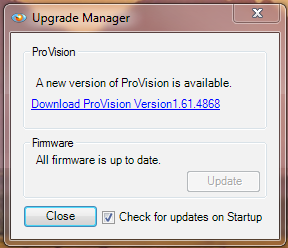
At start-up, ProVision automatically checks with the PMI server to see if there are updates available to either itself or to the connected recorder’s firmware (as shown in Figure 1). It’s now possible to find out instantly if a device has available updates with a single mouse-click.
Support for Ethernet and Cell Communication
One of the major advantages of using ProVision is that it supports communication via Ethernet and cell modem. More recently manufactured monitors (i.e. Revolution and Vision) support Ethernet communication and there is a distinct advantage to its use. With ProVision, each unit is assigned an individual TCP/IP address. This allows the user to view the information from multiple monitors simultaneously. Any location with a hardwired LAN port and any recorder containing a cell modem are capable of providing remote monitoring. This feature means it’s no longer necessary to travel to a recorder to perform firmware upgrades, check battery life, or change the setup values of a recorder. All of these tasks may be performed remotely. It’s now possible to download and review long periods of recorded data without having to roll a truck to retrieve the recorder.
Automatic Data Transfer
One of the side benefits of having a dedicated Ethernet connection is that it is possible to automate scheduled downloads. ProVision can automatically connect to and download data from a recorder. Setting recorders to download overnight or at predetermined intervals saves time. For recorders that have been installed for long term or permanent recordings, this capability eliminates the possibility of data overwrite. Even with up to 1 GB of memory, the length of a recording can vary from 1 month up to 1 year. As long as the recorder is set to download on a regular basis, the chance of overwriting important data can be virtually eliminated.
Real-time Readings
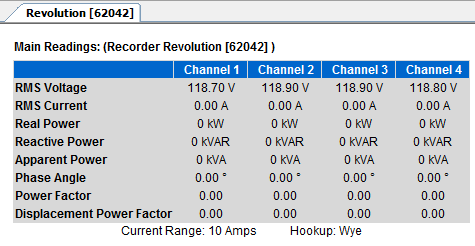
It’s now possible with ProVision to monitor, in real-time, readings from any PMI monitor connected via Ethernet or USB. Through the use of real-time readings, it is possible to monitor Voltage, Current, phase angle and several other values as shown in Figure 2. This allows for live diagnosis of issues such as loose neutral lines, phase issues and open lines. Real-time values can be displayed as a numeric table or a waveform graphic. The diagnostics function provides information on battery life, current firmware version and internal temperature of the recorder.
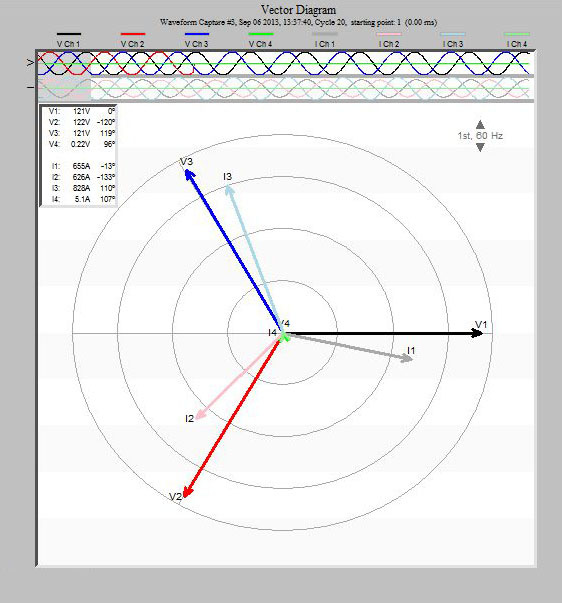
Live readings are especially useful for verifying a hookup while in the field. The vector diagram can be used to make sure CT polarities are correct, and that each voltage/current pair is correct, as shown in Figure 3 (for more information, download Vector Diagrams for Commonly Used Power Circuits HERE). With cell and Ethernet equipped Revolutions, live readings are available from the office.
In addition to live monitoring, ProVision can access newer features such as transient capture, interharmonics and CBEMA/ITIC data. Winscan will download new hardware (i.e. Revolution), but will skip unknown record types such as transients, interharmonics, and CBEMA data points.
Further Data Analysis
ProVision provides several advanced analysis functions not present in Winscan. The Significant Change Reference Graph is a specialized stripchart that shows “significant” changes in voltage with a 1 second resolution, regardless of the main stripchart interval. This can be considered a compressed voltage stripchart, which just shows important changes in voltage. Sensitive to 1 cycle RMS values, it is very helpful for getting a high-resolution look at voltage variations if the stripchart interval was long, or if the stripchart memory has wrapped around on an older recorder.
ProVision also implements the Total Demand Distortion (TDD) graph and report. TDD is a measure of current harmonic distortion, scaled by the overall system impedance. This is a much better method of evaluating the impact of current harmonics compared to the raw Total Harmonic Distortion (THD), since the absolute amplitude of the harmonics is scaled relative to the system impedance. A low system impedance can tolerate a higher level of harmonic current, since the voltage is affected less.
The ProVision Demand graph gives a stripchart of total power demand, using an adjustable averaging window. This graph, computed from the raw stripchart power data, is used for examining peak demand, and estimating transformer loading. Typically the demand interval is set to 5 or 15 minutes, which is usually longer than the main stripchart interval.
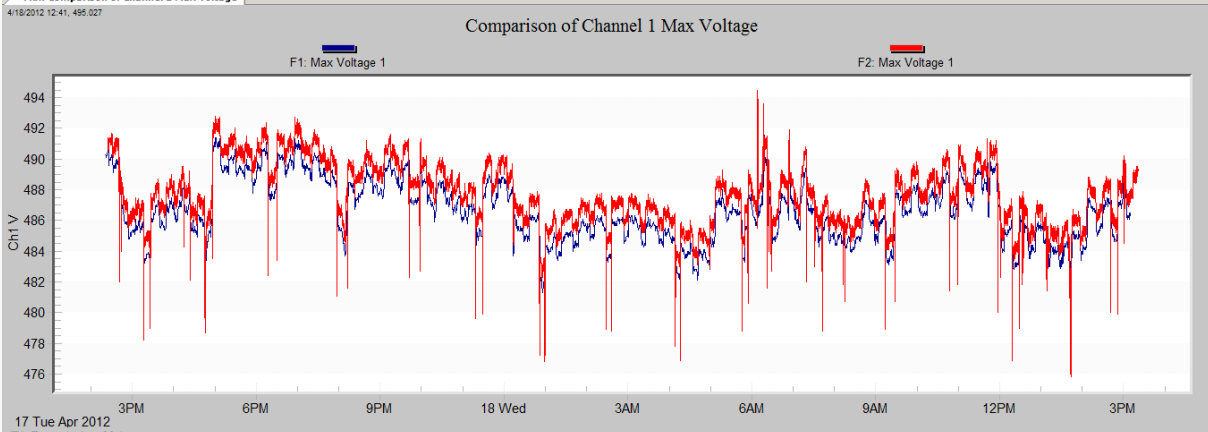
As shown in Figure 4, ProVision allows multiple files to be opened at once. Graphs from separate data files can be displayed at the same time, and a mixed graph can be created from those to show data from different files on the very same graph. These mixed graphs can be created on the fly, or saved as templates for reuse later. This cannot be done with Winscan.
Simultaneous Monitoring
In addition, ProVision can support communicating with multiple units simultaneously. Most useful for scheduled, periodic downloads through a network, ProVision supports multiple recorder connections for live real-time readings, for comparing different locations at the same time.
Another advantage of switching to ProVision is that, as OS developers are finally catching up with 64 bit software and are fully utilizing 64 bit hardware, ProVision is there with 64 bit compatibility. The current version of ProVision supports functionality in 32 bit OS as well.
Graph Annotations
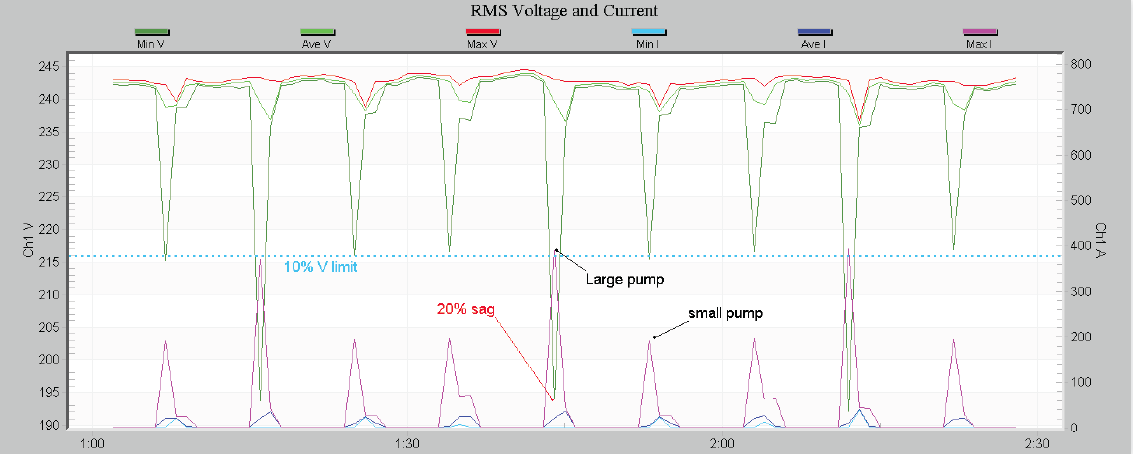
ProVision provides the ability to annotate graphs. A variety of annotation tools, such as text, arrows, and lines are available for marking points of interest on any graph (See Figure 5). Annotated graphs may be saved with the data file, so they’re available later. Winscan doesn’t have the ability to annotate graphs, or to save a customized graph with a data file.
Advantages of Using Winscan
Winscan, while running only in 32-bit mode, does offer a few possible advantages. Winscan requires less system resources than ProVision, and can run on older Windows systems, such as Windows 95/98. In a memory-limited system (e.g. 256 or 512MB), Winscan may be more feasible than ProVision. The Winscan user interface is simpler than ProVision, and may present an easier solution for those working exclusively with older recorders on older PCs. Winscan can communicate with the VP-1, and facilitates loading files from “legacy” recorders (circa early 1990s) that may have been saved with the original DOS applications.
| Feature | WinScan | ProVision |
|---|---|---|
| View Multiple Recorders | No | Yes |
| Automatic Updates | No | Yes |
| View Real Time Data | No | Yes |
| Compare multiple files | No | Yes |
| Graph Annotations, saved graphs | No | Yes |
| TDD, Demand graphs | No | Yes |
| Remote Accessible | No | Yes |
| View Transients, Interharmonics | No | Yes |
| ITIC/CBEMA graph | No | Yes |
| Compatible with VP-1 | Yes | No |
| 64 Bit OS Compatible | No | Yes |
Conclusion
Ease of use, time on job and advanced data analysis make ProVision the ideal choice for data analysis and troubleshooting.
