Abstract
Harmonics are distortions in the 60Hz voltage or current caused by non-linear loads on the system. Harmonics are of interest to utilities as they can cause damage to equipment, such as creating extra vibrations in motors or causing excess heat in transformers. Power Monitors, Inc. (PMI) ProVision software features advanced harmonic analysis features. One such feature is the ability to generate harmonic analysis reports. This paper will examine how to create a harmonic report in ProVision, describe the various pieces of the report, and also discuss when to use this report vs. other ProVision harmonic tools.
Opening a Harmonic Report
The Harmonic Report is the tabular version of the Harmonic Graph in ProVision. This harmonic information is calculated by ProVision from raw waveform data captured by the recorder. While the harmonic bar chart in the graph is useful for spotting patterns and getting a quick overview, the harmonic report is better for a more detailed analysis.
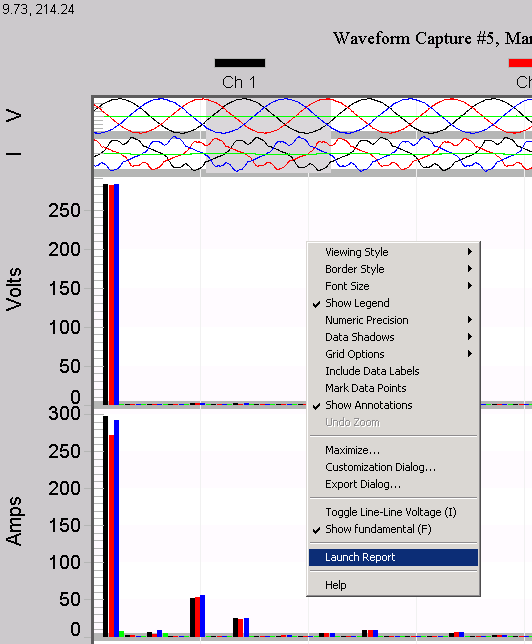
To see the Harmonic Report, it is necessary first to select the harmonic analysis via the graph. Once you have loaded a recording file, go to the main toolbar and click on “Graph”. In the drop down that appears click on “Harmonic Analysis” and “Magnitudes”. The harmonic analysis is computed by ProVision for the cycle shown in the grey rectangle at the top of the graph. Click and drag the rectangle to cover the cycle to analyze; ProVision will recalculate the harmonics as it moves. For harmonics, a “normal” cycle should be selected, so representative steady-state harmonics are computed, not the harmonics of a disturbance (unless that’s really what’s needed). Once positioned, right click on the graph that appears on the section that you wish to generate a report from, in this example we will right click on the Volts bar graph and select “Launch Report” (Figure 1).
A detailed report of harmonics present in the recording will appear. This report is a textual representation of the previous graph. The report can be exported to several formats, including CSV, by right clicking on the body of the report. There are several sections to the report, which we will discuss in turn. The sections are a report header, a section on Total Harmonic Distortion (THD) and other distortion measures, Harmonic Magnitude, and lastly a section on Harmonic Phase Angle.
Report Header
The report starts with the basic header information at the top of every ProVision report, such as the recorder used to make the recording, and the firmware and software currently installed on it. Next is additional information about the recorder, and the recording interval used.
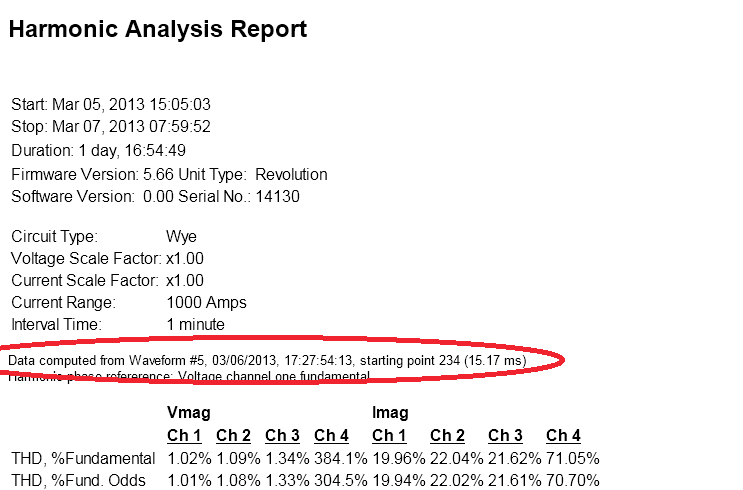
Next is the specific data source selected in the grey box on the graph screen (Figure 2). In this example, waveform capture #5 is used, and the cycle under analysis starts at point 234, 15.17 ms into the waveform.
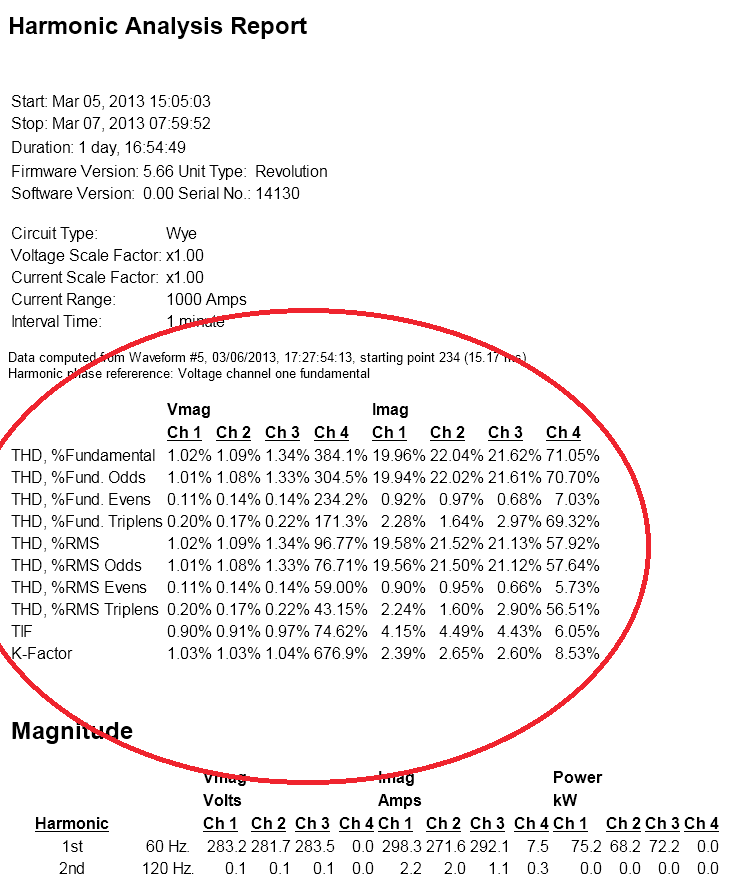
The next section (Figure 3) is a block of statistics computed from the harmonic data, including several THD measurements, TIF, and K-Factor values in this table are percents, with two main categories, THD Fundamental and THD RMS. These terms are defined here:
THD-F and THD-R
There are two typical definitions used when dealing with Total Harmonic Distortion. The two types of Total Harmonic Distortion are THD-F and THD-R. They both are figures of merit used to quantify harmonic levels in voltage and current waveforms; however, each one uses a different reference. THD-F is a comparison to the fundamental and THD-R is a comparison to the signal’s RMS value. For power systems, the THD-F is the most useful measurement especially when there is high harmonic content. The THD-R measurement can be prone to misinterpretation, which can easily lead to measurement errors when measuring larger distortions.
THD Fundamental
Total Harmonic Distortion in reference to (F) Fundamental, represents the ratio, in percent, of the voltage/current harmonic components relative to the voltage/current of the fundamental. When the reference is not indicated (i.e. simply THD), then it is usually assumed the reference is fundamental. For power systems, THD-F is by far the best measurement to use.
THD-R
Total Harmonic Distortion in reference to (R) RMS, is the ratio, in percent, of the voltage/current harmonic components relative to the absolute voltage/current RMS. Because this is related to an RMS base, all harmonic values must be calculated in RMS. Since no harmonic, or the fundamental, can be larger than the entire RMS value, the THD-R value can never be greater than 100%. In cases of large distortion, the value approaches 100%, and it is more difficult to distinguish similar readings, compared to the THD-F value (which can exceed 100%).
THD is further classified on the report as odd, even, and triplen harmonics. Even harmonics are simply the even number harmonics; harmonics 2, 4, 6, etc. Odd harmonics are the odd numbers, not including the 1st harmonic (the fundamental). Most loads create more odd harmonics than even harmonics. Triplen harmonics are odd multiples of the third harmonic.
Even Harmonics
While inspecting a sinusoidal wave, if both the upper half and the lower half of the wave are symmetrical, then no even harmonics are present. An asymmetrical wave indicates the presence of even harmonics. Even harmonics are an indicator of an unusual load in the system. Even Total Harmonic Distortion should be close to zero in a normal system. If the THD of even harmonics is a significant part of the total, further investigation is warranted.
Odd Harmonics
Odd harmonics make up most harmonic currents found in distribution systems. Of particular interest are the 5th and 11th harmonics. The 5th and 11th harmonic have a negative sequence, and when applied to some three-phase motors, they will try to run the motor backwards. A major source of the 5th, 7th, and 11th harmonics is 6-Pulse variable frequency drives (see the PMI white paper: Monitoring Variable Frequency Drives for more information).
Triplen Harmonics
Triplens are especially detrimental to grounded-wye systems with current flowing through the neutral. Normally balanced wye current cancels out in the neutral, but triplen harmonics add together in the neutral instead of cancelling. This can overload the neutral and cause excessive heating. Devices sometimes malfunction because the line-to-neutral voltage is badly misshapen by the triplen harmonic voltage drop in the neutral conductor.
Telephone Interference Factor (TIF)
TIF is a measure of the potential telephone noise caused by the harmonic distortions from a power system on nearby telephone equipment. It is a dimensionless quantity that depends upon a weighting factor derived from 1960 weighting curve by the Edison Electric Institute. This weighting factor is weighted heavier on frequencies that tend to cause interference in the audible range and are based on the response of the human ear. The higher the factor the more interference is being generated. Other forms of communication, besides telephones, are also affected.
K Factor
K Factor is a measurement of current harmonic distortion used in rating transformers. It’s used in calculating the value necessary to de-rate a transformer for harmonics. Harmonic current flow in a transformer causes increased heating (due to various losses in the core). Some of these losses increase linearly or even more than linearly with the harmonic number.
Magnitude
In the magnitude section of the report, harmonic magnitudes present in the cycle are broken down by frequency as shown in Figure 4. Amounts are represented in real units, i.e. voltage magnitude is represented in volts present in each channel, while current is represented as amps. The frequency and harmonic number are both shown.
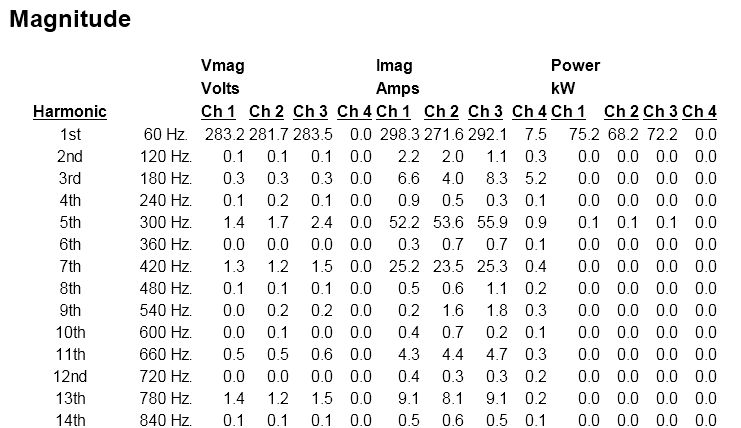
In addition, the real power at each harmonic is shown, computed by taking the product of harmonic voltage and current, and the cosine of the phase angle between them.
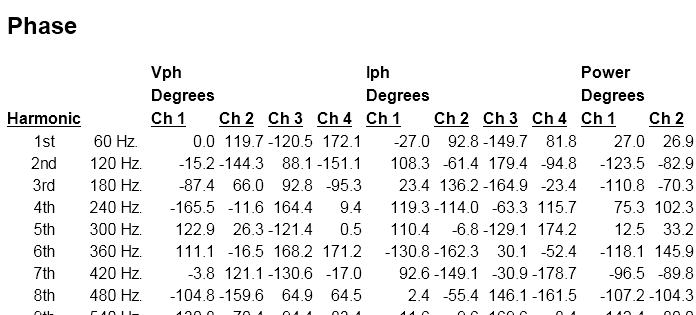
Phase
Phase measures the offset between each phase of power, in degrees. The phase angle for each voltage, current, and power are shown after the magnitudes (Figure 5). The channel 1 voltage fundamental is used for the phase angle reference for all harmonics and voltage and current channels. The power phase angle is the phase difference between current and voltage at that frequency.
Harmonic Report vs. Stripchart
ProVision also features harmonic stripcharts, which allow for long-term study of harmonics. An important difference between a harmonic stripchart and a harmonic report is that a harmonic report only shows harmonics for a one-cycle period. A harmonic stripchart may be more suited for a long-term trend study of harmonics present in a system, but requires more recorder memory, and selection of specific harmonics to record as stripcharts. The waveform-based method has the advantage of showing all harmonics, and with much less memory cost. It’s also useful for harmonic analysis of an existing recording, where no harmonics were explicitly enabled. For a detailed explanation of the strategies for using waveform capture for harmonic analysis in ProVision, see the white paper Harmonics From Periodic Waveform Capture.
Conclusion
The Harmonic Analysis Report is a powerful tool featured in PMI ProVision. It features a plethora of detailed data, presented in an easy to read format. In addition, the data can be exported to CSV and a number of other formats.
