Abstract
Power Monitors, Inc. provides a wide array of power quality test instrumentation. These devices are used to measure line voltage, current and power from or to a number of different locations. Users will note that on almost all occasions, when measuring voltage and current, the values are reported as the RMS (Root Mean Square) of the measured quantity. This whitepaper will discuss what RMS is, why it is used and how it is calculated.
What Is Root Mean Square (RMS)?
RMS (Root Mean Square) is exactly what it sounds like: it is the square root of the arithmetic mean of the squares of a set of numbers. Put more succinctly: take a series of number; square them; take the mean of these squared numbers and finally take the square root of the mean that was calculated.
Why Use RMS?
The RMS reading is a method for quantifying the “size”, or magnitude of a complex, time-varying waveform. With a constant DC signal, the actual voltage or current measurement is also constant, so there is no need for a more complex calculation. With AC signals, the instantaneous value is always changing, presenting the need for a way of measuring how “big” the signal is. Most AC signals are both positive and negative at different times, so the average value is usually zero – not a useful metric. For a pure sine wave, the peak amplitude could be used, since the waveform size is completely determined by that signal value, as shown below.
This is where the RMS calculation comes in. The RMS voltage, for example, actually gives you the equivalent of the same power dissipation in a resistive load that you would see were you to have a DC voltage of that same measurement. For example, an AC waveform at 120V RMS will cause the same power dissipation in a 1 ohm load a DC 120V source. The resulting current in each case will also be the same numeric value for the AC RMS signal and DC signal.
RMS vs Peak Values
So now we know what RMS is as a measurement function, but – how is it used in practice when measuring voltage and current?
The RMS value of the voltage or current as measured in a single cycle is significantly lower (about 29.2%) than the peak value. This is because the peak value is reached only for a short period of time. While it is a theoretical maximum output, the amount of time during the cycle that is spent at that peak measurement does not accurately convey the amount of “work” (the actual power dissipation in a resistive load) that is being done during that cycle.
For a sine wave of the form y(t) = A sin(2πft) the RMS value is calculated as the amplitude (A) divided by the square root of 2:
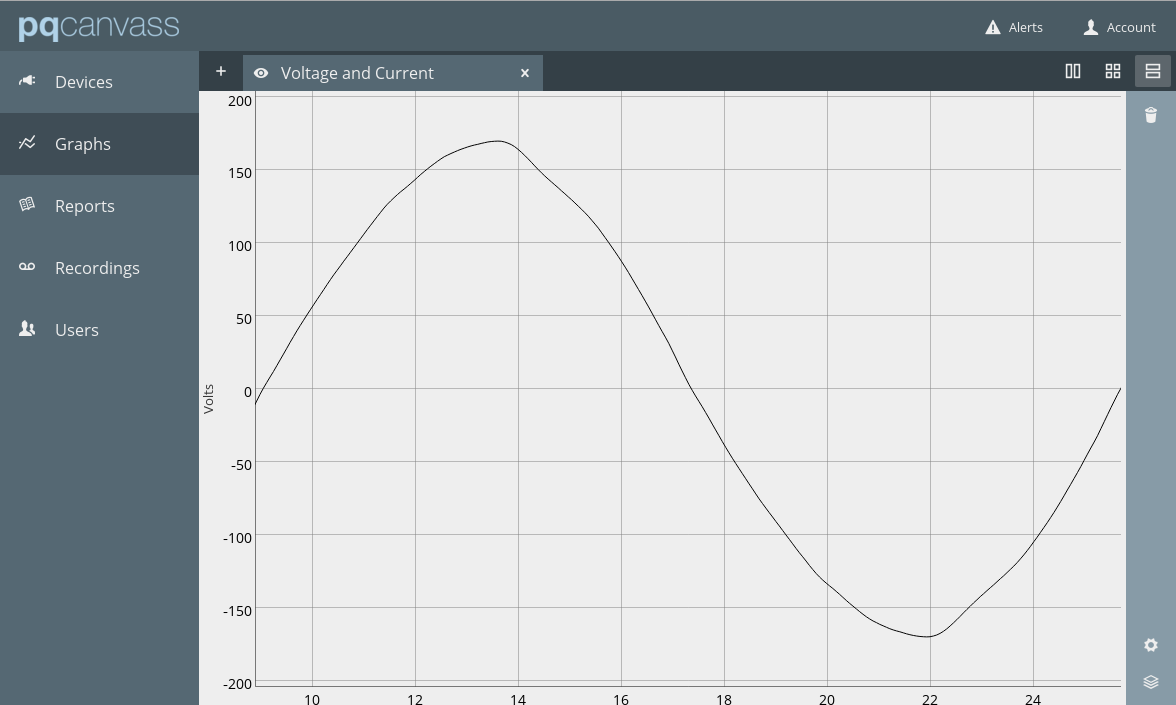
Figure 1 shows a single cycle of voltage for phase 1 as sampled by a cell Guardian graphed in the time domain. What the reader is seeing in this picture is a sine wave that is representative of the sum of each different harmonic component (fundamental, 2nd, 3rd, 4th, … 51st harmonic) over a single waveform period. Note the Max and Min labels in Figure 1: both are hovering around 173V.
The waveform capture that was selected for Figure 1 was triggered by a THD threshold setting of 5%. This particular waveform capture had a calculated THD of approximately 6%.
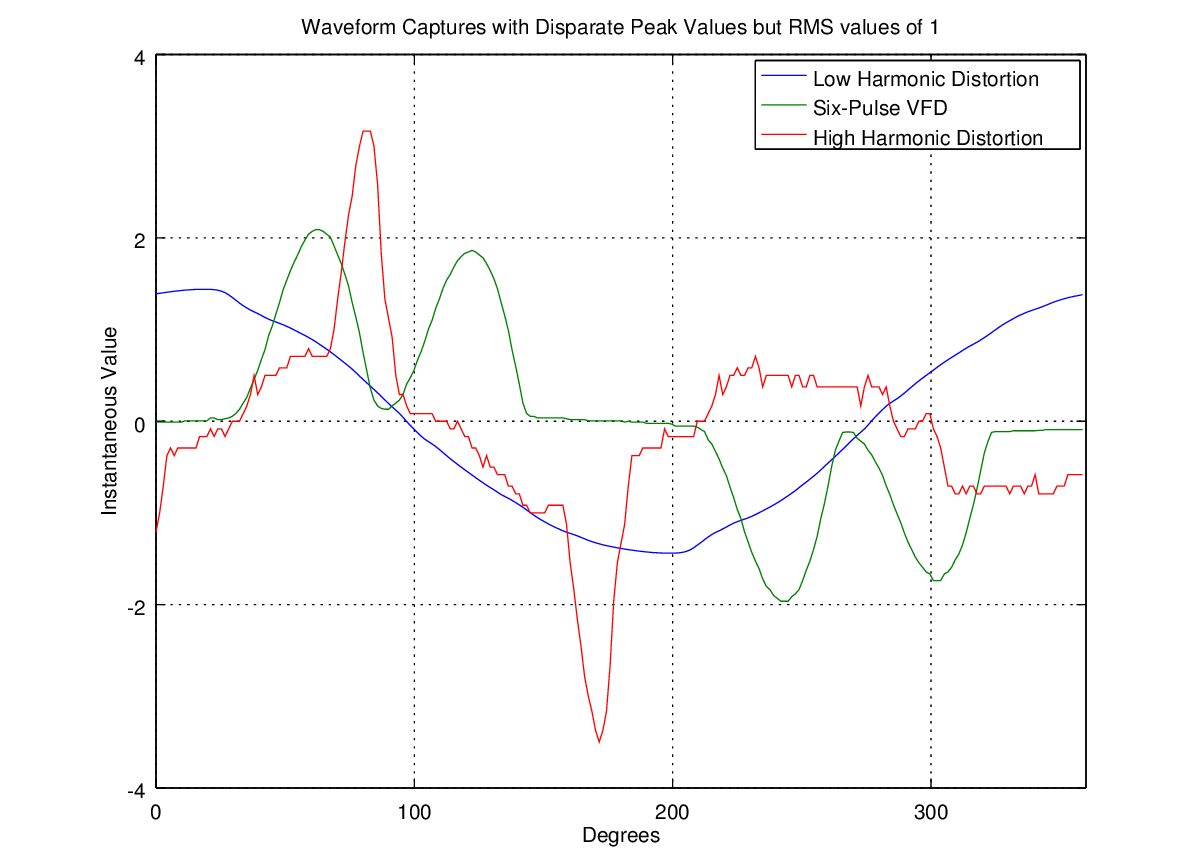
Figure 2 shows three different waveform captures whose peak values vary by a significant margin (a little over 2x in at least one case). What is immediately apparent about this graph is that, despite the fact that the peak values have a wide range, the RMS value of each waveform is exactly 1.00. This figure serves as a relatively clear example of how the peak value is not always an indicator of what the RMS value will be. Eyeballing any of the three waveforms in this figure would not necessarily indicate an equal “work factor” of each, especially when compared side-to-side. Yet each of these waveforms have the same RMS value. It’s clear from this example that the RMS value is a much better metric of overall signal magnitude than the peak value.
RMS and Harmonics
The RMS value is really a simple, efficient way of “summarizing” a complex waveform with a single number. Up to this point, we have focused on calculating the RMS value of a complex waveform in the time domain – but how are harmonics taken into account? Thanks to Parseval’s Theorem, it can be shown that the RMS calculation works in both the time or frequency domain equivalently:
This equivalence shows that the RMS value takes into effect all the harmonics of a complex waveform – each harmonic contributes directly to the reading, and the RMS value may be computed either from the raw waveform data, or from the harmonics themselves.
To illustrate this, we can actually calculate the RMS value of a complex waveform with its frequency domain (harmonic) magnitudes.
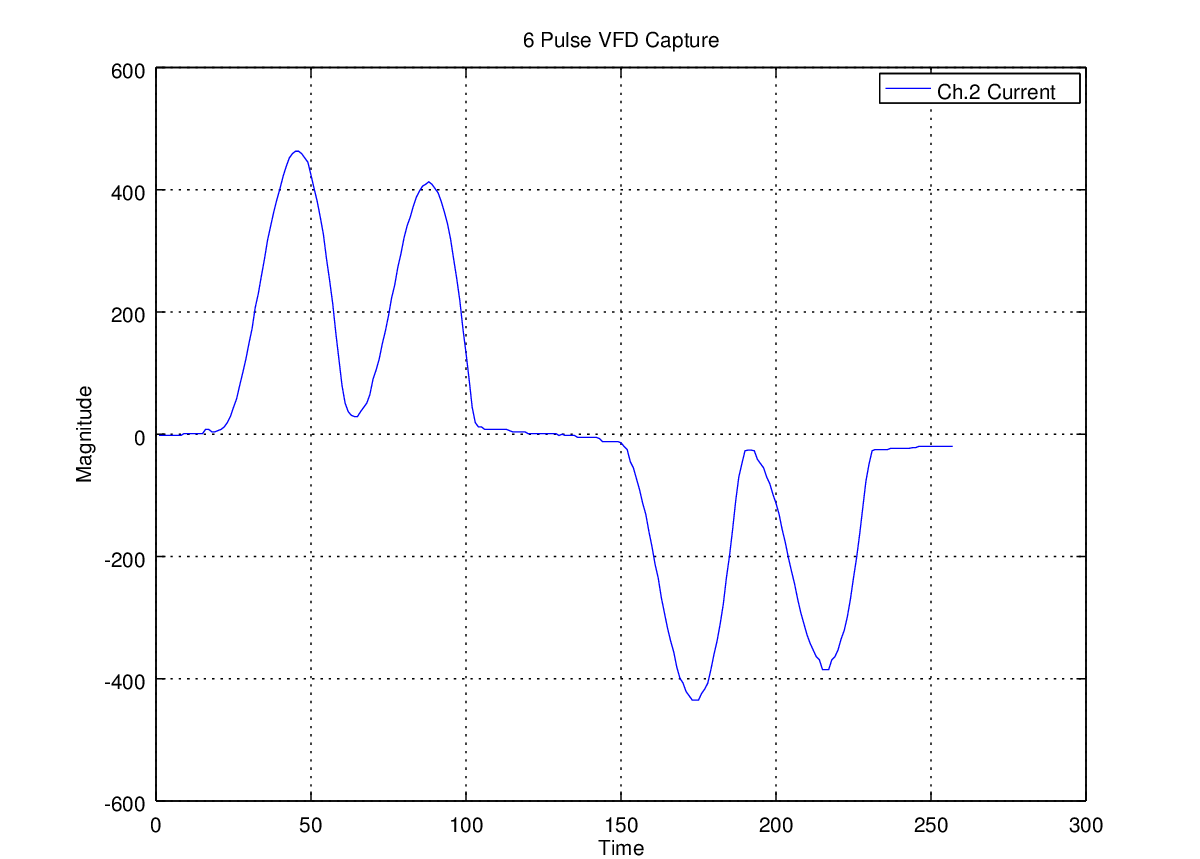
Figure 3 shows the typical current harmonic distortion for a six-pulse variable frequency drive. The graph is of the time domain, from which the author computed the IRMS value as approximately 221A.
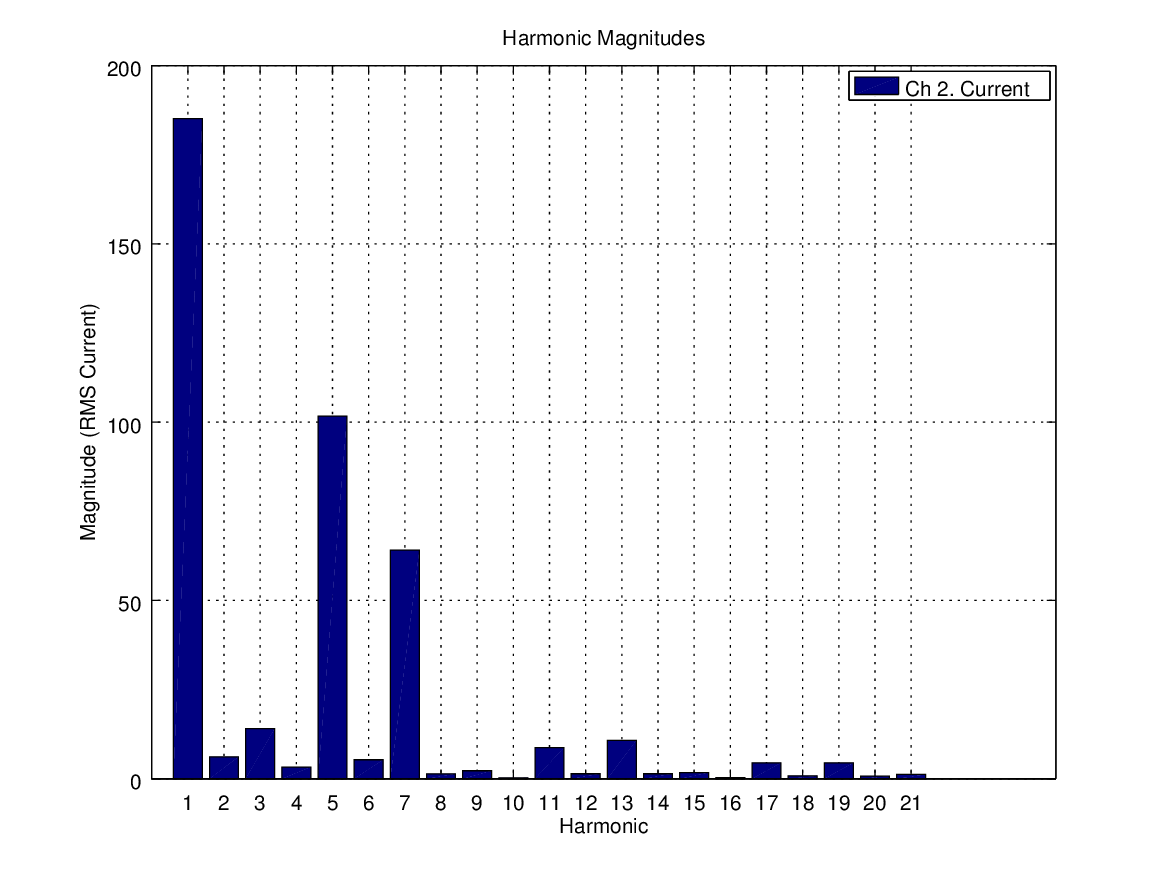
Figure 4 shows the harmonic decomposition (frequency domain analysis) of the same complex waveform with their respective RMS magnitudes. Note the harmonic spikes around the 6n±1 harmonics – this is typical in VFD applications.
After running the time domain values through an FFT to generate a vector of harmonic magnitudes, the author then ran the FFT-generated values through Parseval’s equation to recalculate the RMS value of the waveform and, once again, came to a value of ~221A.
Conclusion
There are several methods for measuring voltage and current in an AC system. In this paper we have discussed how to take the instantaneous readings for a voltage or current waveform and convert it to its RMS value; analyze a single cycle of the waveform in both the time and frequency domains; and have taken a look at the decomposition of the voltage waveform into its individual harmonic frequency components in order to get an understanding of where the instantaneous voltage value comes from. Finally, using Parseval’s Theorem, we were able to convert the frequency domain values produced by the waveform capture of a VFD to calculate the IRMS of the complex waveform, showing that the RMS value encompasses all harmonic information.
