Abstract
The job of any power monitor is to record all interesting data, and leave unrecorded the vast majority of boring, unremarkable data. The tricky part for a monitor is deciding which events are important. This is a problem of data reduction. Ideally, the enormous amount of data is reduced to a small report which just shows the important events and measurements. The sifting of data into specific record types accomplishes this task. Part 1 of this series covered all the non-triggered PMI record types (e.g. stripcharts, daily profiles, histograms, etc.) Part 2 reviewed triggered data types that operate at the one second time level. This whitepaper describes the cycle-level triggered record types: Significant Change, Event Capture, and GE Flicker. Sample-level triggered types, including Waveform Capture, Transient Capture, and ITIC/CBEMA will be covered in later parts.
Triggered Record Types
Data record types can be divided into two classes. The first is event driven. These record types are triggered by a combination of triggering logic and adjustable thresholds, often voltage-based. If a trigger condition is never met, nothing is recorded for that record type. As more triggers occur more records are collected for that record type.
The advantage of this class is that nothing is recorded unless something happens. If a trigger did occur, then the monitor logged the event for later analysis. This is a powerful data-reduction tool, and can reduce huge amounts of data into a few small records containing all the significant events. They are most useful for capturing voltage disturbances and power quality problems. Triggered record types include Waveform Capture, Transient Capture, ITIC/CBEMA, Event Change, Significant Change, Flicker, Loose Neutral, Power Outage, and Abnormal Voltage.
Non-Triggered Record Types
The second class of record types is not event driven. These record types are always logging data regardless of how interesting or important the data is. The classic example is a paper stripchart which continuously logs data. These record types include Stripcharts, Daily Profiles, Histograms, and Energy Usage. These record types are reviewed in part 1 of this series.
Significant Change
The Significant Change record type tracks quick (up to single-cycle) fluctuations in the line voltage, while ignoring gradual changes. Voltage events are timestamped to the second, and tabulated in a report and available graphically. If the report is empty, there were no voltage events that exceeded the trigger threshold. This is a quick way to gauge the voltage power quality because only voltage fluctuations exceeding the threshold are listed.
Trigger Logic
The Significant Change record type uses a single voltage threshold parameter. At the end of each second during the recording session, the largest and smallest single-cycle RMS voltages for that second are compared with the “standard” Significant Change voltage. This standard voltage starts as the nominal voltage picked by the recorder during the two minute countdown (typically 120, 208, 240, 277, or 480 volts). If the difference between the standard voltage and either the maximum or minimum voltage is more than the threshold, a Significant Change is recorded. In addition, the voltage (either the max or min) that causes the trigger becomes the new “standard” until the next Significant Change.
As an example, consider a “standard” voltage of 119 volts, and a threshold of 2 volts. After 40 seconds the voltage drops to 118 volts. No Significant Change is recorded because the 1 volt change is smaller than the 2 volt threshold. After another 35 seconds the voltage increase to 120 volts. The change is 2 volts, from 118 to 120, but no Significant Change occurs because 120 volts is only 1 volt greater than the “standard” of 119. After another 23 seconds the voltage increases to 121 volts. A Significant Change is triggered because the 1 volt increase created a 2 volt difference between the 121 maximum voltage for that second, and the 119 volt standard. The standard voltage is now set to 121 volts until the next Significant Change.
Only one Significant Change per second can be recorded per channel. If both the single-cycle max and min meet the threshold in the same second, the voltage that is furthest from the standard becomes the new standard.
What’s Recorded
When a Significant Change is triggered, the triggering voltage is recorded, along with a date and timestamp (to the second), and the channel number. Significant Change is recorded separately for each voltage channel (although they share the same voltage threshold parameter). If Significant Change memory is filled, Significant Change recording stops. All voltage channels use the same Significant Change memory. The amount of memory used for Significant Change is different for various PMI recorders, but every recorder can record hundreds, and most over one thousand records.
On most recorders, Significant Change is always enabled for recording. On some older recorders, enabling Flicker recording disables Significant Change recording.
Typical Settings and Suggested Uses
The default setting for the Significant Change threshold is 3 volts. This setting can be as small as 1 volt or as large as 8 volts. Normally, a threshold between 2 and 5 volts is appropriate, depending on the nominal voltage. A single-cycle disturbance such as a sag will trigger Significant Change if the sag is greater than the threshold. If this happens, the sag voltage becomes the standard, which will trigger another Significant Change if the voltage returns its previous level.
The Significant Change report is very useful for determining how often, and to what degree the line voltage is fluctuating. If there are no Significant Change records, then there were no fluctuations greater than the threshold. A Significant Change record can be correlated with the Stripchart by using its timestamp. Find the same time period in the Stripchart to see what the voltage and current were before and after. This may give some indication of the cause of the disturbance. All Significant Change records during a Stripchart interval will be included in a single Stripchart max/min/average data point. For example, if the interval is one minute, and six Significant Changes occur within one minute, they may all fall into the same Stripchart data point. (Of course they are still reported individually in the Significant Change report). The Significant Change report provides more detail than the Stripchart for these disturbances.
The Significant change report is also available in graphical stripchart form. The Significant change graph displays the voltage used as each channel’s standard, and this level changes at each Significant Change. Since Significant Change is always captured with 1 second resolution, this graph can provide finer time resolution than regular RMS Voltage stripchart, which is often set to 1 minute, or even 5 minute intervals.
A key advantage of the Significant Change report is that only one disturbance per channel can be triggered each second. If multiple disturbances occur during a second, the worst one is recorded. This limits the size of the report, making it much easier to analyze while still giving single-cycle response. If detailed disturbance information on a cycle basis is required, use the Event Change report. Event Change gives much more detail but is more complicated to examine. The timestamp of a Significant Change event can be used to find the same disturbance in the Event Change report for further analysis.
For even more detail, Waveform Capture is the next step. If the disturbance triggered Waveform Capture, the raw waveforms of the sampled instantaneous values of each voltage and current channel can be displayed. Again, the Significant timestamp is used to find the corresponding waveform.
Examples
A Significant Change report and corresponding graph are shown in Figure 1. Triggered events are given in tabular form, and also graphed as a stripchart. In recordings where remote communications are not available, the Significant Change data provides a very memory-efficient method of capturing voltage sags and swells.
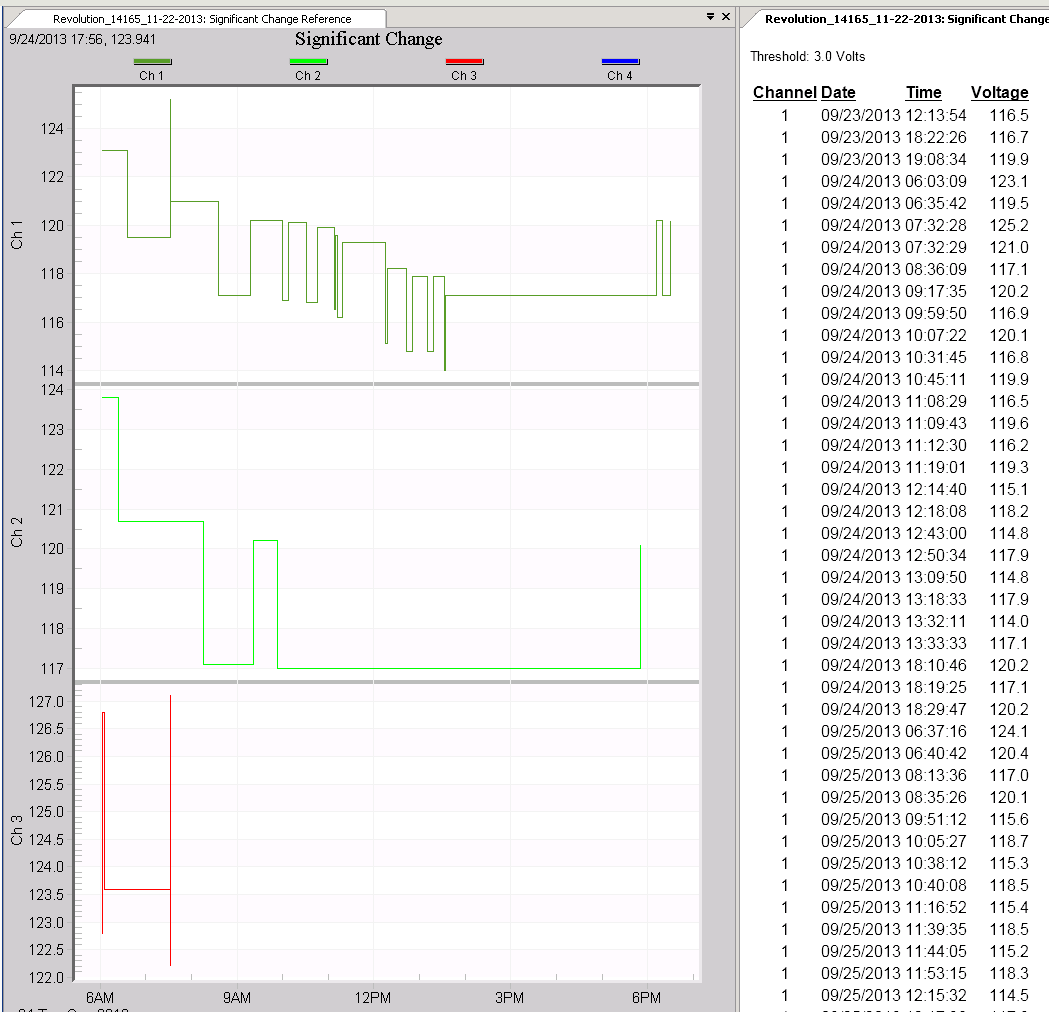
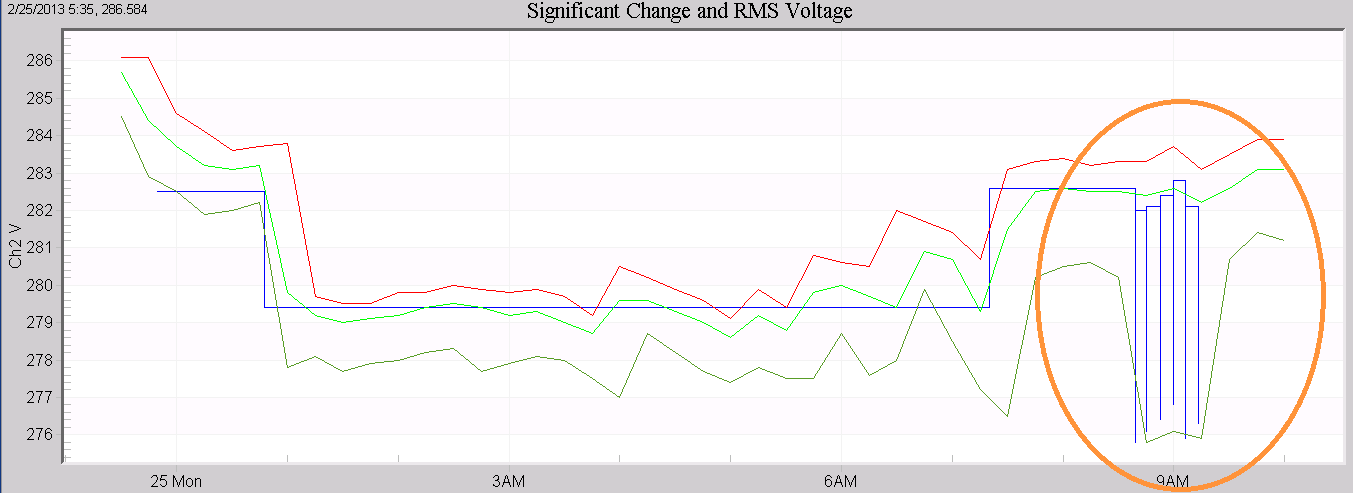
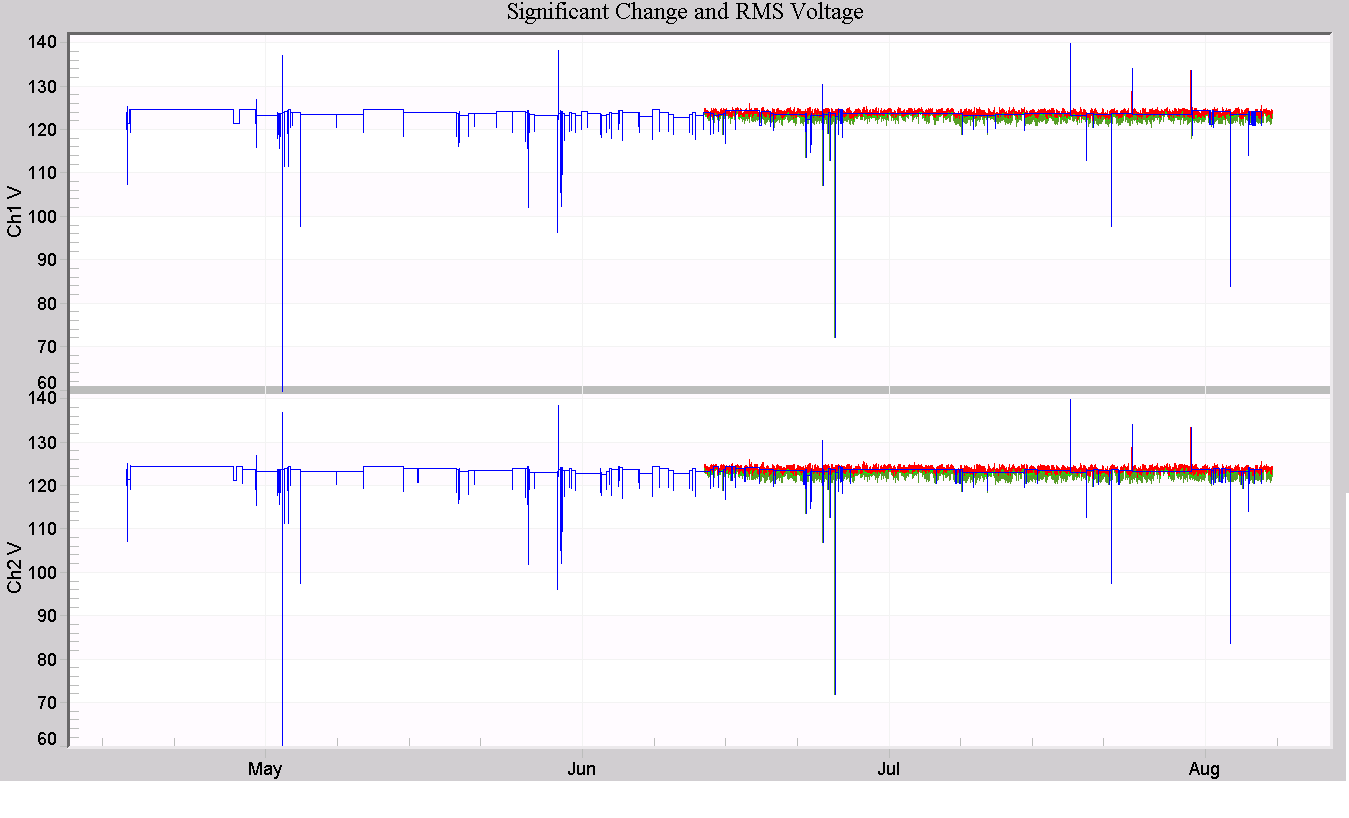
Figure 2, a standard RMS voltage stripchart is graphed along with the Significant Change. The stripchart interval is 15 minutes, limiting the time resolution for identifying voltage sags. The Significant Change provides 1 second resolution (circled in orange in the figure), showing that several sags occurred during single 15 minute intervals. Another situation where the Significant Change graph is useful is shown in Figure 3. Here, a long 112 day recording exceeded the stripchart memory, but the triggered Significant Change record type (blue trace) spanned the entire time, and with 1 second resolution. For very long recordings, this is the only voltage quality data that spans the entire monitoring period.
Event Change
The Event Change report provides detailed cycle-level information about each voltage disturbance. This is the most detailed report available short of actually examining raw waveforms with Waveform Capture. An event is triggered when the voltage moves past any of a series of trip points. Max and min voltages and currents during the event, the event duration (in cycles), and the current before and after the event are all recorded. Event Change is very useful for traditional voltage sags and other fast, but essentially RMS voltage events. Oscillatory transients and other waveform disturbances that have non-RMS components are best examined with Waveform or Transient Capture data.
Trigger Logic
Event Change triggering involves three parameters. The first, the Nominal voltage, sets a baseline voltage level. This is not the same nominal voltage selected by the Abnormal Voltage record type during the two minute countdown. The Event Change Nominal voltage is specified by the user, and is not picked by the recorder. The second parameter is the Threshold, in volts. The Threshold is added and subtracted to the Nominal to form voltage trip points. These trip points are created all the way down to zero volts and up to the maximum recorder voltage by using multiples of the Threshold. For example, a Nominal of 120 and a Threshold of 6 would create trip points at 120±6=114,126; 120±2×6=108,132; 120±3×6=102,138; etc.
The voltage region around the Nominal, but before any trip points (115 to 125 volts in the above example) is the Nominal Band. If the voltage moves from the Nominal Band to cross a trip point, an Event Change is triggered. This Event Change continues until the voltage either returns back into the Nominal Band, or moves past another trip point. Each time the voltage moves past another trip point, the existing Event Change ends and a new Event Change is triggered. The trip points can be visualized as a grid (every 6 volts in the above example) from zero volts to the maximum recorder voltage, and any time the line voltage crosses a grid line, an Event Change is triggered.
There is one exception to the previous paragraph. The third setting, Minimum Event Time, specifies in cycles how long to wait before allowing a new Event Change, if the voltage continues moving in the same direction. This setting is to prevent a slow sag from generating multiple Event Changes. For example, consider a Nominal of 120, a Threshold of 6, and a Min. Event Time of 10 cycles. The line voltage is 119 volts, and no Event Change has been triggered. Now a slow sag occurs. The voltage drops to 114 volts, triggering an Event Change. The next cycle, the voltage keeps dropping to 110 volts. On the third cycle, the voltage drops to 105 volts. This would normally cause the Event Change to end and a new one to be triggered, since the voltage crossed another trip point (at 108 volts). However, with the Min. Event Time set to 10 cycles, no new Event Changes can be triggered for 10 cycles, as long as the voltage continues to drop. If the voltage changed direction and started to rise, then the Min Event Time would not apply– if the voltage rose past a trip point, the existing Event Change would end and a new one would start. The Min. Event Time doesn’t prevent Event Change from capturing short events – rather it keeps a slow voltage change from generating multiple events.
Event Change can be triggered by any voltage channel. The triggering logic (and settings) are separate for each channel. Another channel may trigger its own Event Change while other channels have running Events, resulting in overlapping Events.
What’s Recorded
When an Event Change is triggered, the trigger time is recorded with one cycle resolution. The RMS current one cycle before the trigger is recorded. The direction of the voltage change, or slope, is also recorded. This is displayed in ProVision as a minus for a sag and a plus for a swell. While the event is occurring, the recorder keeps track of the max and min current and voltage values. When the event ends, the max and min RMS voltage and currents are recorded, along with the duration (in cycles). One cycle later the RMS currents are measured to record the currents after the event.
All voltage and current measurements are recorded for every channel, regardless of which channel triggered the event. If a sag occurs on three phases simultaneously, three Events will be triggered at the same time. These Events are recorded separately, even though they may have the same data in them.
Typical Settings and Suggested Uses
The Nominal voltage should be set as close as possible to the actual steady-state line voltage. If a circuit normally runs at about 117 volts, use 117 as the Nominal, not 120. Event Change is not for steady-state line voltage regulation problems (like the Abnormal Voltage report), but for quick sags and swells. The Threshold should be set small enough to catch problem events, but large enough to avoid filling up memory with unimportant data. A good start is 5% of the Nominal. The Nominal and Threshold can be set separately for each channel. These should be set accordingly if some channels see different voltage levels (for example, in a single phase setting where two channels are connected line to ground, and the third channel line to line.) To effectively disable Event Change on a channel, set its Threshold to something very large, e.g. 500 volts.
The Minimum Event Time is not as critical. Ideally, this is set to just larger than the slowest anticipated sag time. For example, if no sags (such as from motor starts, etc.) will take longer than 6 cycles for the voltage to drop to the sag value, the best Minimum Event Time is 7 cycles. This will prevent multiple Events Changes from the same voltage sag. Otherwise, as the voltage dropped lower and lower, past voltage trip points, Events would continue to be triggered. Ideally, only one Event is triggered for a single sag or swell. A typical value is 10 cycles. This is longer than most sags take to reach the final sag voltage.
Event Change provides cycle-level detail on sags and swells. A sag which merely shows up as a single point on the Stripchart can be analyzed in the Event Change report. Usually, Event Change is not the first report to analyze in a recording, due to its complexity. Check the voltage Stripchart for min or max voltages out of tolerance, or the Significant Change report for voltage fluctuations. If a disturbance needs further study, use the timestamp to find the fluctuation in the Event Change report. Here detailed information such as cycle duration, pre- and post-event RMS currents, etc. are available.
The most useful values are the duration and max and min voltages. This information shows how long the event lasted, and how low or high the voltage went. The cycle timestamp can be useful to determine how far apart several events were which occurred in the same second. The timestamp is also used to correlate an Event Change with other reports, such as Significant Change and Waveform Capture.
The pre- and post-RMS current can be used to determine whether the load being monitored caused a sag. Consider a sag that triggers an Event Change. If the current one cycle before the event is low, but the max current during the event is high, and the current one cycle after is high (or at least higher than the pre-trigger current), the monitored load probably caused the event. In-rush current from a motor start will cause this type of pattern: the high in-rush current pulls the voltage down, triggering an event. When the in-rush current peak is over, the voltage goes back up, ending the event. The final current is lower than the in-rush current, but higher than the current before the event.
Another possibility is a voltage sag where the current during the event is lower than the pre-trigger current (or about the same), and the post-trigger current is about the same. Here, the monitored load probably did not cause the event. Some other load pulled the voltage down, and the monitored load current dropped proportionately with the lowered voltage. When the voltage came back up, the current rose to its normal level also.
ProVision groups closely occurring Event Change records into super-events. A super-event is started when an Event starts on any channel. The super-event lasts until there are no running Events on all channels for at least an entire second. A complicated voltage disturbance may trigger several closely spaced or back-to-back Event Changes, but will be grouped into a single super-event for easier analysis.
Event Change is recorded separately for each voltage channel. If Event Change memory is filled, Event Change recording stops. All voltage channels use the same Event Change memory. The amount of memory used for Event Change is different for various recorder models, but every recorder with Event Change can record hundreds, and most over one thousand records.
Examples
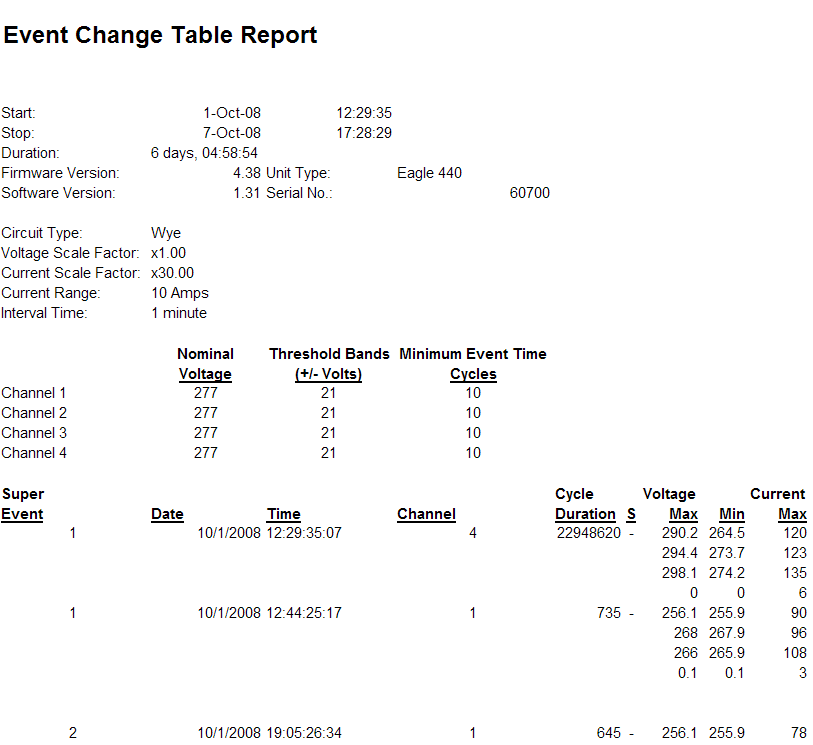
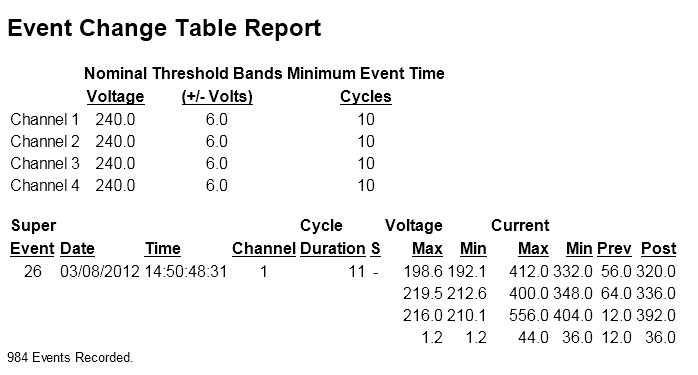
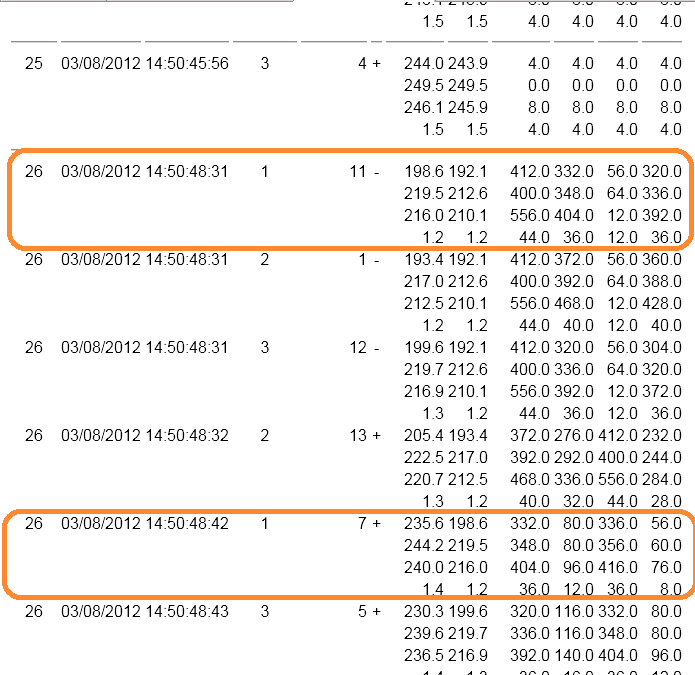
A basic Event Capture report is shown in Figure 4. The top of the report shows the settings for each channel, and for the single event shown, the 1-cycle min/max voltages and currents are shown for each channel (one channel per row). A close-up of a single event is shown in Figure 5. Here the triggering channel is Ch 1, the duration is 11 cycles, and this event is part of Super Event 26. The minus sign under the “S” column indicates a falling slope, i.e. a voltage sag.
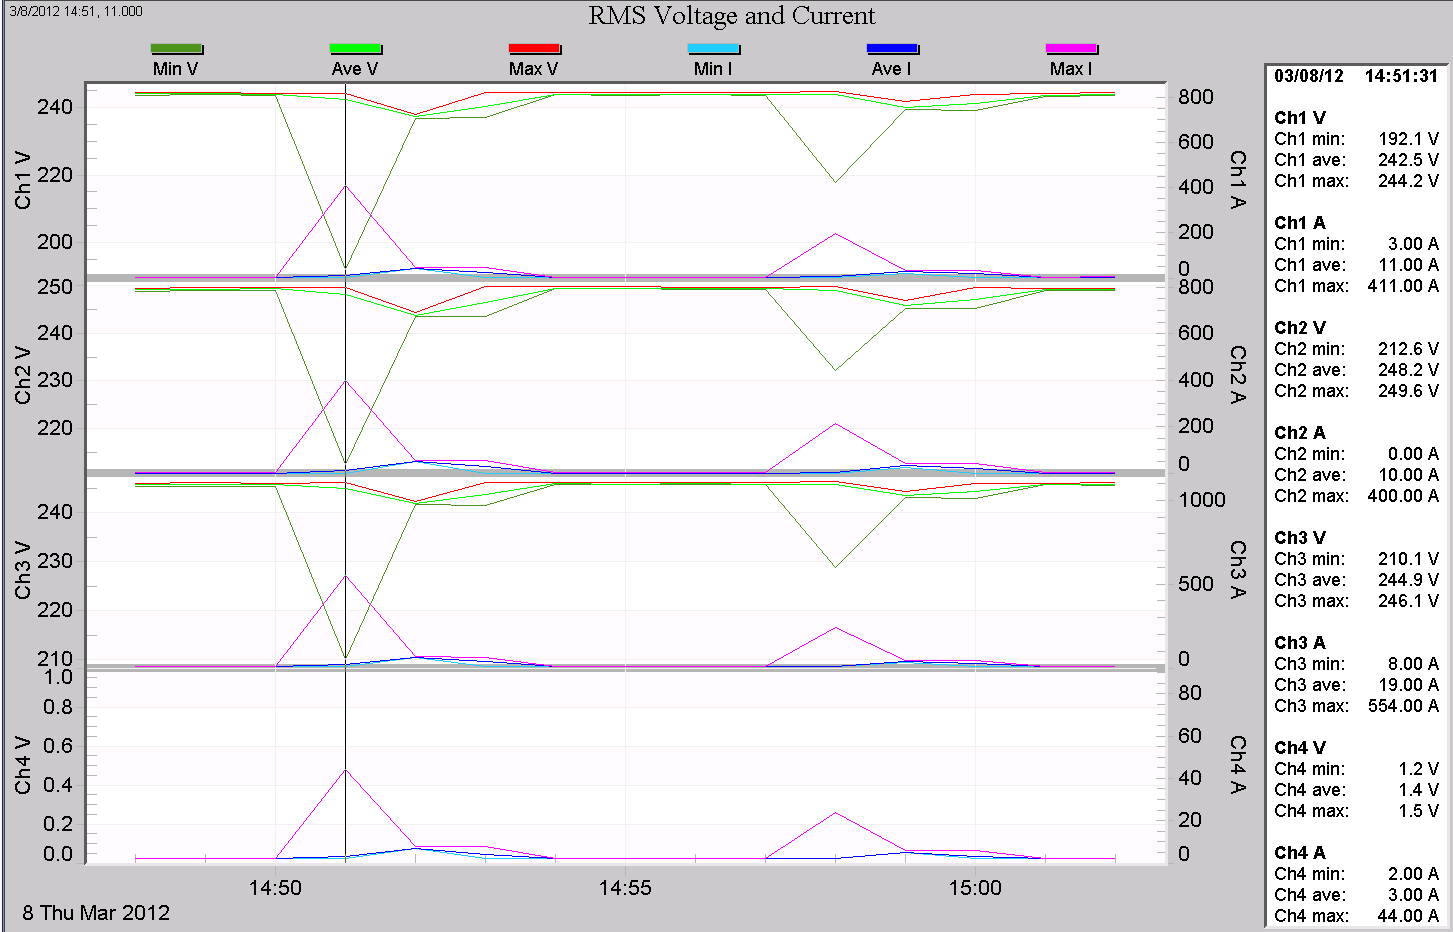
A more complex report is shown in Figure 6. This section of the report shows the full Super Event 26, which is composed of several adjacent Events Captures. The RMS voltage and current stripchart for this time period is shown in Figure 7, with the Point Table enabled on the time period examined. In this recording, a large 3-phase pump is causing deep voltage sags. The stripchart shows the worst-case voltage minimum, but doesn’t indicate how long the sag lasted, or any other details. The motor start is characterized by Super Event 26. The motor start sag caused two consecutive events: one for the initial sag, and one for the return to the new steady-state voltage. These two events are captured separately for each phase. The two events for phase A (channel 1) are circled in orange in Figure 6. The first, with a negative slope lasting 11 cycles, shows the voltage sagging to 192 volts. The current prior to the event was 56A, and after the event, 320A – a clear indication that the current was the cause of the sag. The second event lasted 7 cycles, with a positive slope (voltage rising), and shows the voltage returning to 236 volts. The event length is 11 cycles for the sagging half, and 7 cycles for the return to nominal for a total of 18 cycles comprising the entire motor start.
Flicker
The Flicker record type is designed to show voltage variations that cause lights to flicker. This flicker data type is based on the older IEEE Standard 141 definition, derived from the original GE flicker curves. This implementation is an event-based system, logging a flicker event when the curve is exceeded. The PMI Eagle, Guardian, and Revolution recorders also record flicker using the newer IEEE 1453/IEC 61000-4-15 method (IFL, Pst, Plt) in parallel with the traditional Std. 141 system. Although the newer IEEE 1453 method has several advantages over the older system, there are situations where the older method is more useful. A few advantages:
- User-adjustable parameters allow for customized flicker curves
- Event-based recording and explicit voltage variation limits allow for easier correlation to specific equipment operations, and flicker predictions based on known loads and system impedance
- Easier comparison with older recordings where only Std. 141 data was available
- Always enabled in modern PMI recorders; available in case flicker becomes a question after a recording is made
- The data is more understandable when explaining flicker to customers than the more abstract IFL and Pst values in IEEE 1453
The recorder defaults to the threshold of irritation curve from IEEE Standard 141. This curve is designed to show only voltage flicker that is perceived as irritating. When this occurs a flicker event is recorded with the time and magnitude.
Trigger Logic
A Flicker curve is specified by a list of allowable voltage thresholds, and a limit on their quantity in certain time spans. The default curve allows 5 voltage fluctuations of 1% or greater, in a ten second period; 10 fluctuations of 1.5% or greater, in a one minute period, and so on up to 10 fluctuations of 6% or greater, in a 24 hour period. In general, the larger the voltage variation, the less often it is allowed before triggering a Flicker record. There are nine pre-set time periods used, from 10 seconds to 24 hours. Each has an adjustable threshold percentage and event limit. If the voltage variations exceed the threshold percentage more than the number of times allowed by the limit, in a certain time period, then a Flicker record is triggered.
For example, with the default settings, if the voltage varies more than 1% over 5 times in a ten second period a Flicker record is generated. These variations also count for the longer Flicker time spans if they are large enough.
Flicker is computed once per second, based on the previous second’s one-cycle max, min, and one second average RMS voltage levels. The thresholds are given as a percentage. If the max, min or average differ from each other by more than the percentage for a certain time period, then a flicker event counter is incremented. If the counter value exceeds the limit for a certain time period, a Flicker record is triggered. Flicker is triggered separately for each voltage channel.
What’s Recorded
When a Flicker record is created, the date and time are recorded, along with the number of voltage events that exceeded the tolerance. The time span over which the flicker occurred is also recorded. Each channel is reported separately.
Typical Settings and Suggested Uses
The Flicker report is designed to show whether utility customers will perceive voltage variations as flickering lights. The default curve is programmed to generate Flicker events when a person would become irritated by the level of flicker. The IEEE Std. 141 also has a curve which shows when a person would just perceive flickering lights, but not become irritated. The validity of these curves depends on individual circumstances such as lighting (the curves assume 120V incandescent) and customer sensitivity.
The Flicker report is used both to confirm a customer complaint about flickering lights, and to measure progress in mitigating a problem. If no Flicker events were recorded, then no voltage variations occurred which exceeded the allowed limits, and the problem may have been solved. Since flickering light perception is so subjective, merely showing a customer a Flicker report which shows no flicker according to a standard curve may lessen the complaint by showing that the voltage variations are within standard limits.
Flicker is recorded separately for each voltage channel. If Flicker memory is filled, Flicker recording stops. All voltage channels use the same Flicker memory pool. The amount of memory used for Flicker is different for various recorders, but each can record hundreds, and most over one thousand records.
Flicker is not meaningful on neutral to ground voltage channels: only channels that are used to power lighting generate useful Flicker data. The threshold parameter is a percent change value, and applying a small percentage to an already small voltage creates tiny thresholds that are constantly exceeded, and in any case no lighting is being powered from the neutral.
On most recorders Flicker is always enabled for recording. On some very old models, enabling Significant Change recording disables Flicker recording.
Examples
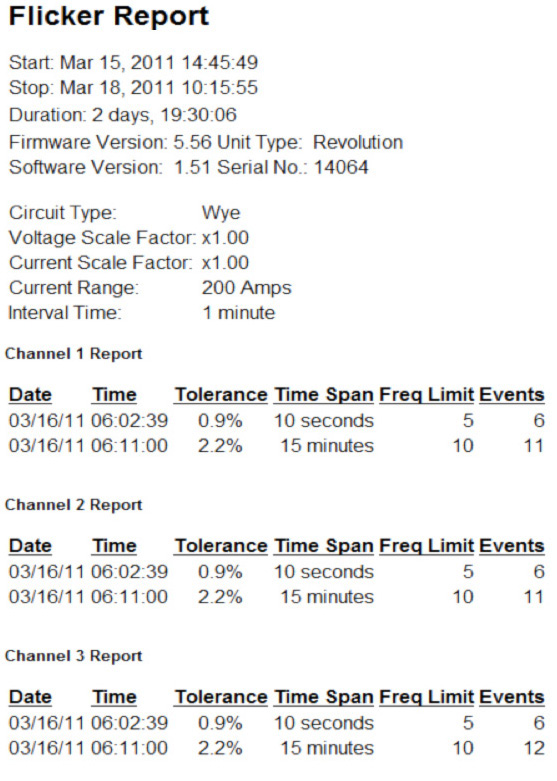
A typical Flicker report is shown in Figure 8. Here two flicker events were captured for each phase. The 10 second and 15 minute time spans were both exceeded. The explicit percent voltage limits, time span, and number of voltage exceedances in each capture are displayed, and are easy to relate directly to voltage events in the stripchart.
Conclusion
A summary of the cycle-level triggered record types used by PMI recorders has been presented, describing what’s recorded, any parameters to adjust, triggering logic, and some suggested uses and examples. Significant Change, Event Capture, and Flicker are important tools for quantifying and dissecting PQ events, and providing detail that generic stripchart or histogram information cannot provide. Existing at a level between slower stripchart data and very fast waveform capture, these cycle-level event-based data types provide information at just the right level for analyzing certain types of PQ events.
