Abstract
The job of any power monitor is to record all interesting data and leave unrecorded the vast majority of boring, unremarkable data. The tricky part for a monitor is deciding which events are important. This is a problem of data reduction. A recorder that captured every 60 Hz waveform during a week’s recording would never miss an event, but would present the user with billions of useless cycles. Conversely, a recorder whose thresholds are set incorrectly may not record anything. Staying somewhere between these two extremes involves a balance of thresholds, settings, and record types. The monitor will see an enormous amount of data on its voltage and current inputs– the Revolution sees over 432 billion samples per day! Ideally, all this data is reduced to a small report which just shows the important events and measurements. The sifting of data into specific record types accomplishes this task. This whitepaper covers continuous, non-triggered record types in part 1 and triggered data in part 2.
Triggered Record Types
Data record types can be divided into two classes. The first is event driven. These record types are triggered by a combination of triggering logic and adjustable thresholds, often voltage-based. If a trigger condition is never met, nothing is recorded for that record type. Triggered recorded types will be covered in Part 2 of this whitepaper.
Non-Triggered Record Types
The second class of record types is not event driven. These record types are always logging data regardless of how interesting or important the data is. The classic example is a paper stripchart which continuously logs data. There are no thresholds to set, although there may be a parameter to determine how often to collect data. The logged data is usually presented as a graph of data points. Although there may be a large amount of data, using a graph lets the eye pick out important data. Problems such as sags and swells are easy to see in the Stripchart graphs. In addition to voltage quality studies, these record types are used for finding daily trends in current or power values, measuring power factor, etc. The advantage of not having thresholds to set is that there is no question about what data will be recorded. The disadvantage is that sometimes there is no question that a lot of data will be recorded, most of it unimportant. For non-power quality data such as power factor measurement, there is no disadvantage since the purpose isn’t troubleshooting, but rather is to profile. These record types include Stripcharts, Daily Profiles, Histograms, and Energy Usage.
Remote Access and Memory Usage
Traditional PQ recorders have a finite amount of memory for data storage. In the past, managing this limited memory involved a tradeoff between different data types, thresholds, etc. to help ensure that the essential data was preserved. Modern recorders such as the Revolution, with up to 1GB of onboard memory, greatly eased the burden but still present a finite recording memory. The introduction of Ethernet and cellular remote access to the Revolution eliminates this problem altogether in two ways.
First, the PQ memory is effectively infinite with the use of automatically scheduled downloads in ProVision. For example, the Revolution may be configured to fill its internal memory with a one-week recording. If a weekly automatic download via cell modem (or Ethernet) connection is scheduled in ProVision, the Revolution is downloaded and reset each time, effectively offloading the bulk data storage from the Revolution to the downloading PC. With this setup, detailed high-resolution PQ recordings may be continued indefinitely. For basic load logging and voltage regulation monitoring, a Revolution may report 1-second average stripchart data continuously to PMI’s Canvass cloud-based data system. This web-based system works independently and in parallel with the ProVision-managed PQ recording, and is completely automatic. With Canvass no download is required – just log in with a web browser and stripcharts, daily profiles, and histograms are immediately available, with unlimited cloud storage.
Second, the Revolution can be configured to trigger email or text message alerts based on exceedances such as voltage, current, or power out of limits, or waveform capture triggers. These alerts work through PMI’s Canvass cloud-based system and provide instant notification of a PQ event. With that notification, ProVision can be used to download the Revolution to retrieve the full dataset, without waiting for the next scheduled download, or for field retrieval of the Revolution. These alerts actually remove the need for indefinite recording in some situations – the PQ data can be examined as soon as the event happens, rather than waiting for a long recording to end. This alert-based monitoring actually reduces the amount of field data needed for an investigation and shortens the time required to identify and start resolving a problem.
Stripcharts
The Stripchart is one of the most useful record types. In a single Stripchart graph, you can see power quality events such as single-cycle voltage sags and current surges, as well as long-term voltage trends. With the graph, an entire recording session can be examined at a glance. Comparing different measurement types together on the same graph is an especially powerful way to see correlations between changes in voltage and outside events, such as load switches, time of day, local generation, etc.
What’s Recorded
The only setting for an individual Stripchart is the Stripchart Interval. This Interval, which can be as small as one cycle to as large as four hours, determines how often the Recorder takes a Stripchart data point. Every Stripchart the Recorder is recording uses the same Interval setting. During the Interval period, the Recorder keeps a history of the largest and smallest one-cycle values for each Stripchart, as well as a running average. At the end of the Interval, the max, min, and average values for that time period are recorded as a Stripchart data point. For example, if the Stripchart Interval is set to one minute (a typical setting), at the end of each minute, the Voltage Stripchart will record the average RMS voltage, the minimum one-cycle RMS voltage, and the maximum one-cycle RMS voltage, all during that minute. All of the 3600 60Hz cycles during that minute are used to calculate the average, and for max/min detection.
These values are presented to the user as three traces on a graph: a maximum, a minimum, and an average. The average trace roughly corresponds to a graph from a paper stripchart recorder. The maximum and minimum graphs are unique, however. Each gives the worst case value for every Interval, with single-cycle measurement resolution.
For a one-cycle interval, there is no min/max/ave to record – the raw single-cycle values are logged in the “average” slot. RMS voltage, current, and all power quantities are available for one cycle interval recording.
Each Recorder has at least enough memory to record Stripcharts for at least a week with a one-minute Interval. Newer recorders such as the Revolution with up to 1GB of memory can log many stripchart data types at that rate (all power quantities, flicker, and many harmonics, for example). When the Stripchart data fills the Stripchart memory, the Recorder has two options: it can either stop recording Stripcharts, or go into “wrap-around” mode. In “wrap-around” mode, the oldest Stripchart data points are erased to make room for the new ones as they are collected, which allows the Recorder to always have the latest data. This choice is made by the user during the Initialization. If the “Enable Stripchart Wraparound” box is checked, the Recorder will go into “wrap-around” mode as needed, otherwise it will stop Stripchart recording when memory is full. This does not affect other record types. For example, if there is memory for one week of Stripcharts, and the Recorder was left in the field for three weeks, it would either have the first or the last week’s Stripchart data, depending on the wrap-around setting.
With Ethernet or cellular Revolutions, ProVision may be configured for automatic scheduled downloading. If ProVision is scheduled to download the recorder just before the stripchart memory fills, very high-resolution logging is possible with no recorder memory limitations.
Every PMI recorder can record a Stripchart of voltage. Most also have current capability, and advanced models such as the Seeker, Guardian, and Revolution can record stripcharts of all power quantities (kW, VA, VAR, PF, DPF), IEC/IEEE flicker, THD, harmonics, and even individual interharmonics (Revolution only). Typically, only a few are needed at one time. All the Stripcharts share the same memory, so enabling more Stripcharts reduces the total Stripchart recording time.
Typical Settings and Suggested Uses
There are three settings for the Stripchart record types. The primary setting is the Stripchart Interval. This time setting determines how often the Stripchart data is recorded. Since the Stripcharts always give worst case one-cycle max and min values, the Interval can be set to any time value without a loss of measurement resolution. For example, even if the Interval is set to 15 minutes, the maximum and minimum one-cycle RMS values for each 15-minute period are recorded. What is lost by setting the Interval to larger values is time information. If there is a voltage minimum of 90 volts RMS during a Stripchart interval, with the Interval set to 15 minutes, you are sure that voltage dipped that low for at least a cycle, but you don’t know when or how often or how long during that 15 minutes it happened. A smaller Interval, such as one minute, provides a finer time resolution. The smallest regular Interval, one second, gives excellent time resolution, but consumes memory 60 times faster than a one-minute setting. Often, the exact time of a voltage dip is not as important as the size– for this case, any reasonable Interval setting is fine.
The most common setting is one minute. This is a good balance between frequent data collection and long recording time. Since most loads that start and stop usually run for longer than a minute, the start and stop effects (such as inrush current) are easily spotted in the Stripchart. An example is an air conditioner load: a forty minute period of cycling on and off is obvious in the Stripchart graph as twenty data points at one load current, then twenty data points at low current, all connected by straight lines on the graph. The first interval of the high current period will probably have a much larger current maximum than the rest due to the starting current of the air conditioner. The voltage interval will probably have a dip at the same time.
The most frequent reason to use an Interval smaller than one minute is for large loads that cycle on and off more frequently than one minute. For example, if an elevator is causing power quality problems, and it only takes 10 or 20 seconds to start at one floor and stop at another, a one second Interval is probably necessary, otherwise the entire elevator travel will occur during a single Stripchart Interval. In this case, the Recorder should not be left to record for days since it would only hold the last few hours of Stripchart data. The best use in this case is to set the Stripchart to one second, then cycle the load (such as the elevator) for a while, in an attempt to reproduce the problem, then download the Recorder. In general, the Interval should be smaller than the quickest cycling time of a problem load.
The most frequent reason to use an Interval larger than one minute is to increase the recording time. Setting the Interval to two minutes doubles the recording time, without a serious loss of time resolution. Other common settings are five and fifteen minutes, used to match metering or billing increments or regulatory time periods.
The one cycle interval is a good choice for motor start studies, UPS switchover, etc. These recordings are usually very short and completed while on-site. The one cycle interval is especially useful in conjunction with a very long waveform capture, allowing the entire motor start, UPS switchover, or other equipment operation to be fully captured at every level of detail possible.
The second Stripchart setting is the “Stripchart Wrap-Around” mode. The best setting for this depends on how the Recorder will be used. Some users leave a Recorder at a problem site until the customer calls with a power quality complaint. The Recorder is set to a small Interval such as one minute or thirty seconds, and Wrap-Around is enabled. Because Wrap-Around is enabled, the Stripcharts always have the latest few days of data in memory, by discarding the old data. The Recorder is downloaded and has the most recent days of Stripchart data in memory, no matter how long it was recording. This recent data will have the voltage disturbance in it. Other users will disable Wrap-Around, and leave a Recorder at a problem site where the power quality problem will definitely occur soon. The Recorder will record the first week or so of Stripchart data, then stop Stripchart recording. The Recorder can be downloaded at any time later, knowing that the beginning of the recording session is locked in memory, and will not be overwritten. Other users always download the Recorder before it fills up Stripchart memory, which make the Wrap-Around setting irrelevant. The choice depends on how the Recorder will be used. The factory default setting is for Wrap-Around to be enabled.
For catching intermittent problems at a one-cycle interval, or for long-term monitoring with very small intervals (such as 1 second), a networked or cell-based Revolution may be left in the field, relying on ProVision automatic downloads or email/text message alerts. The automatic downloads essentially give unlimited memory for stripchart recording. Alert notification allows for a manual remote download while the event is still in memory.
The third Stripchart setting is which Stripcharts are enabled. For voltage-only Recorders, there is no choice: a voltage Stripchart is always recorded. For Recorders that can record current, the current Stripchart can be turned off to extend the recording time of the voltage Stripchart. It is usually better to increase the Interval time instead of disabling current to get more recording time. For more advanced recorders, there are many more Stripcharts to enable or disable. The choice depends on what information is needed. If a power factor study is being performed, for example, turn on power factor, and possibly apparent power and displacement power factor. If a power quality problem is present, only voltage and current may be necessary although adding Total Harmonic Distortion (THD) and IEEE flicker is recommended, given the extended memory in the Seeker and Revolution. The total recording time is shown by ProVision as Stripcharts are enabled and disabled during the Recorder setup. Another method to increase Stripchart memory is to reduce the number of recorded channels. If only three channels are needed on a 4 channel recorder, changing the number of channels from four to three gives 25% more recording time.
For quantities such as power factor, phase angle, THD, etc. often the average is much more important than the one-cycle max and mins. The max and min traces on the graph may be turned off so that they don’t obscure the average trace. Many of the PMI custom graph templates have been optimized to show only the min, average, or max, as appropriate.
Examples
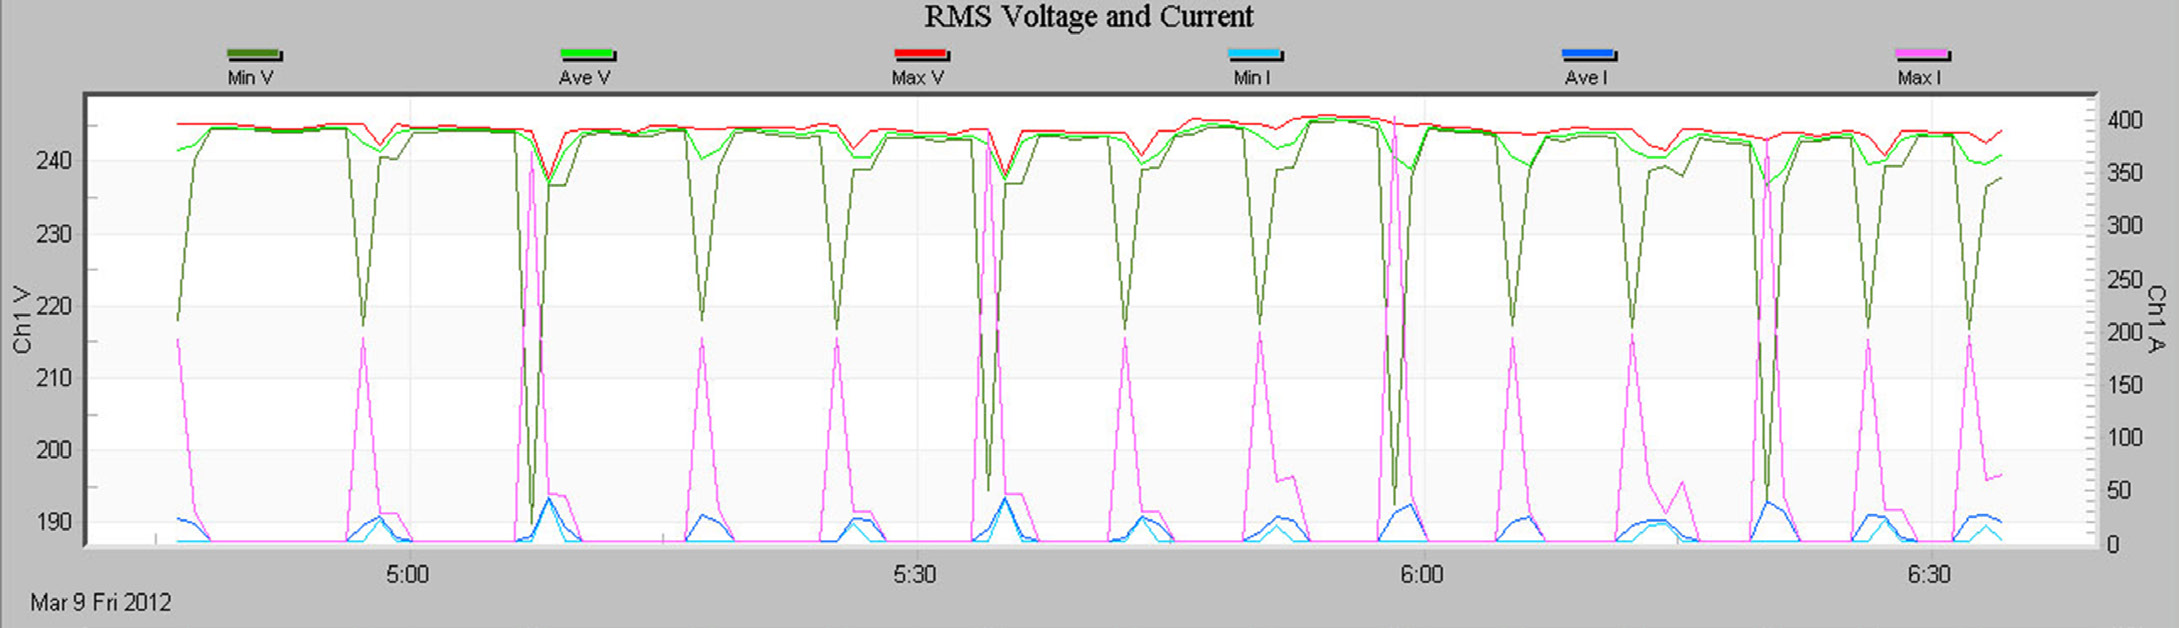
A basic one-channel RMS voltage and current stripchart are shown in Figure 1. Min, average, and max values are shown for a voltage and current channel. Voltage uses the left y-axis, and current the right y-axis, so they can share the same plot but have separate scale values. The graph shows the RMS voltage sagging as the current spikes – in this recording, two different pumps are monitored, one large pump, and one small one. The large pump pulls the voltage down to 80% of nominal during the 350A start. The exact correlation between the current spikes and voltage sags indicates that the pumps being monitored are the source of the sags.
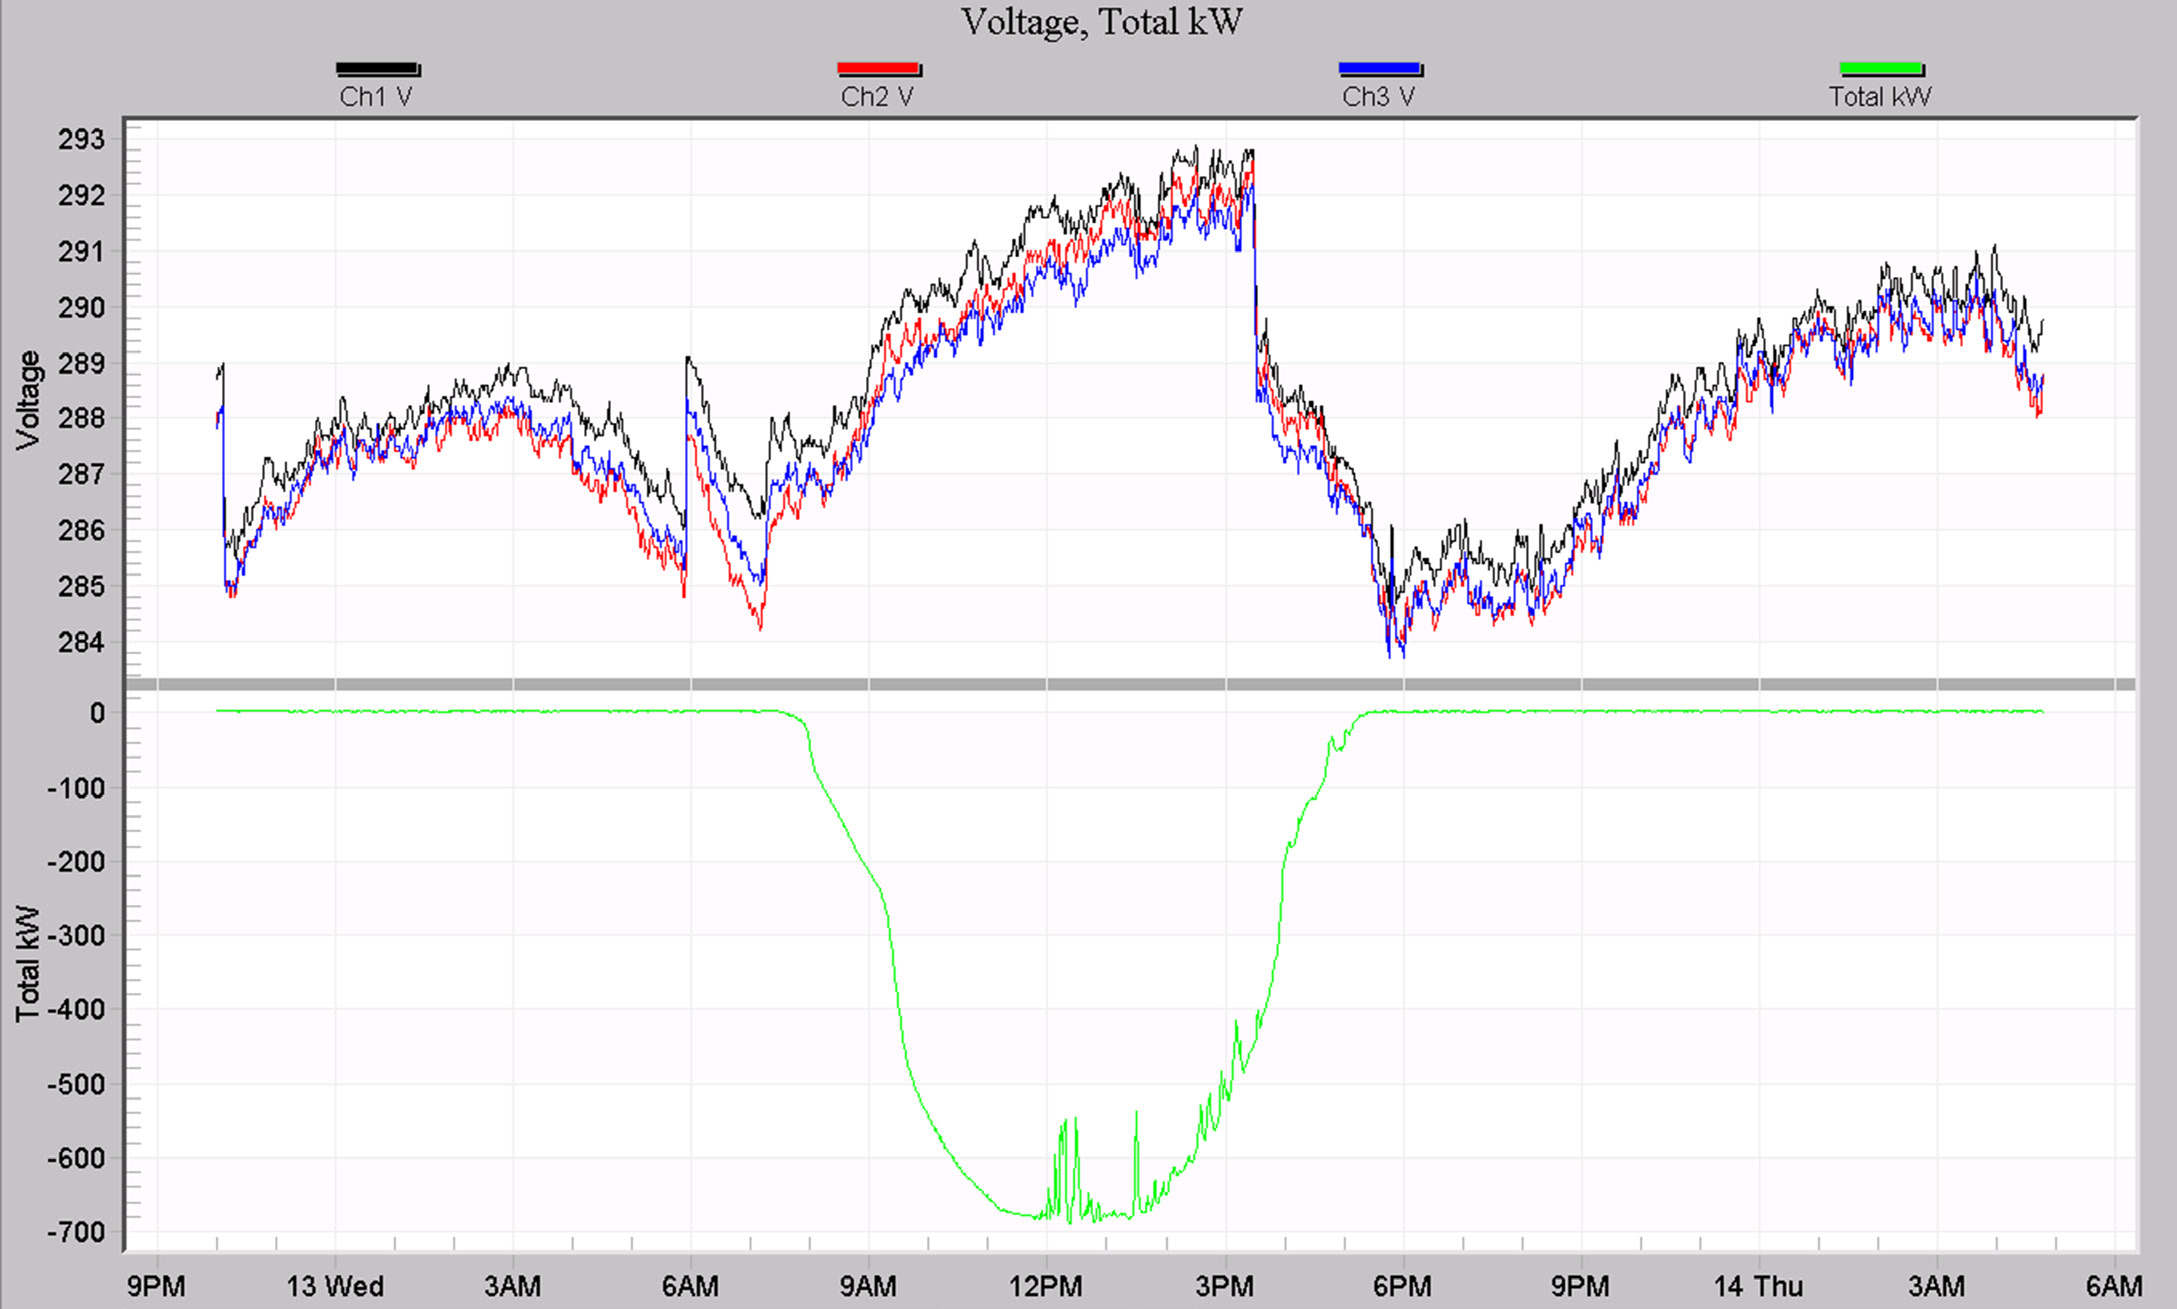
Figure 2 shows a custom graph template from stripchart data. The top plot is RMS voltage for 3 phases, and the bottom plot is the total power generated from a photovoltaic array. The RMS voltage rises as the PV system contributes up to 700 kW into the system, until a local regulator kicks in to lower the system voltage just after 3 pm.
Daily Profiles
The Daily Profiles are used to spot daily trends in voltage, current, power factor, etc. The entire recording session is combined to form the “average” 24-hour day, which is plotted on a graph like a stripchart. Power quality issues are usually not addressed with Daily Profiles (except perhaps consistently low or high line voltage or harmonic distortion). Rather, average line conditions such as regulation voltage, load current, etc. are profiled.
What’s Recorded
Each measured quantity has only one Daily Profile per channel in a recording session. For example, there are four voltage Daily Profiles in a recording session, one per channel. The Profile is averaged over the entire recording session. This average is created by dividing the 24-hour day into 96-time periods, each 15 minutes long. During each 15 minute period, the Recorder computes the average value for that Profile (voltage, current, etc.). This 15-minute average is then averaged with all the previous days’ averages of that 15-minute period. For example, the first Voltage Daily Profile data point is the average voltage during the 15 minute period from 12:00 am to 12:15 am averaged again over the entire recording time. If a Recorder is recording for a week, then this 12:00-12:15 am period is averaged seven times over the entire week.
There are no settings for Daily Profiles. All available Daily Profiles in a Recorder are always enabled, regardless of the settings for any other record types. Memory does not run out for a Daily Profile; it just keeps averaging as long as the recording session lasts (there is a practical limit of about a year). Some older recorders record just a voltage, or voltage and current profile. The Seeker, Guardian, and Revolution record a Profile for voltage, current, real, reactive and apparent power, power factor, displacement power factor, voltage and current THD, and phase angle. The Profiles are always enabled, even if the corresponding measurement in the Stripchart was not enabled. For example, in a Seeker, Revolution, or Guardian, voltage, and current THD Daily Profiles are always recorded, even if THD stripcharts or individual harmonics were not enabled. This is a big advantage for the Daily Profile.
Suggested Uses
Daily Profiles are typically used to profile or characterize a parameter, such as average load current or power factor. Since the Profile is supposed to reflect average line conditions, the more loads included in the recording, the better the average. Monitoring a single small load such as a small office building would not create a very good profile of distribution line conditions (such as distribution line power factor), since the building would be a small part of the total distribution load. Voltage is somewhat of an exception in that anywhere can be a good place to create a profile: every other load (at least those nearby) will see the same distribution line voltage. The ideal location for creating power factor profiles is where a PFC would be placed to correct power factor.
The voltage Daily Profile is normally used to identify voltage regulation problems or other steady-state low/high voltage issues. The current Profile can be used to identify daily trends in load current. This is also possible with the apparent power Profile. Power factor and reactive power Profiles can be used to set PFC timers to correct for power factor only when necessary during the day. The voltage and current THD Profiles show when harmonic distortion is present during the day.
The more days the Recorder records, the better the average created by the Profile. A recording session that just lasts a single day doesn’t incorporate any daily averaging at all, although it does still provide a 24-hour trend. Since a Profile starts with all zeros, a recording session that doesn’t even last 24 hours will include some 15-minute blocks with the data still zeroed. A recording session that doesn’t even last 15 minutes will have all zeroes for a Daily Profile.
A Stripchart can also be used for profiling tasks, but is not ideal. The stripchart interval is usually set to an interval faster than 15 minutes; a fast interval can show too much information, making it hard to form a good average Profile. Often the stripchart only has enough memory for a week or two, limiting the averaging time; the Daily Profiles have no such limit. Most importantly, the stripchart does not divide the data into an averaged day period, so it can difficult to spot daily trends in the graph.
Examples
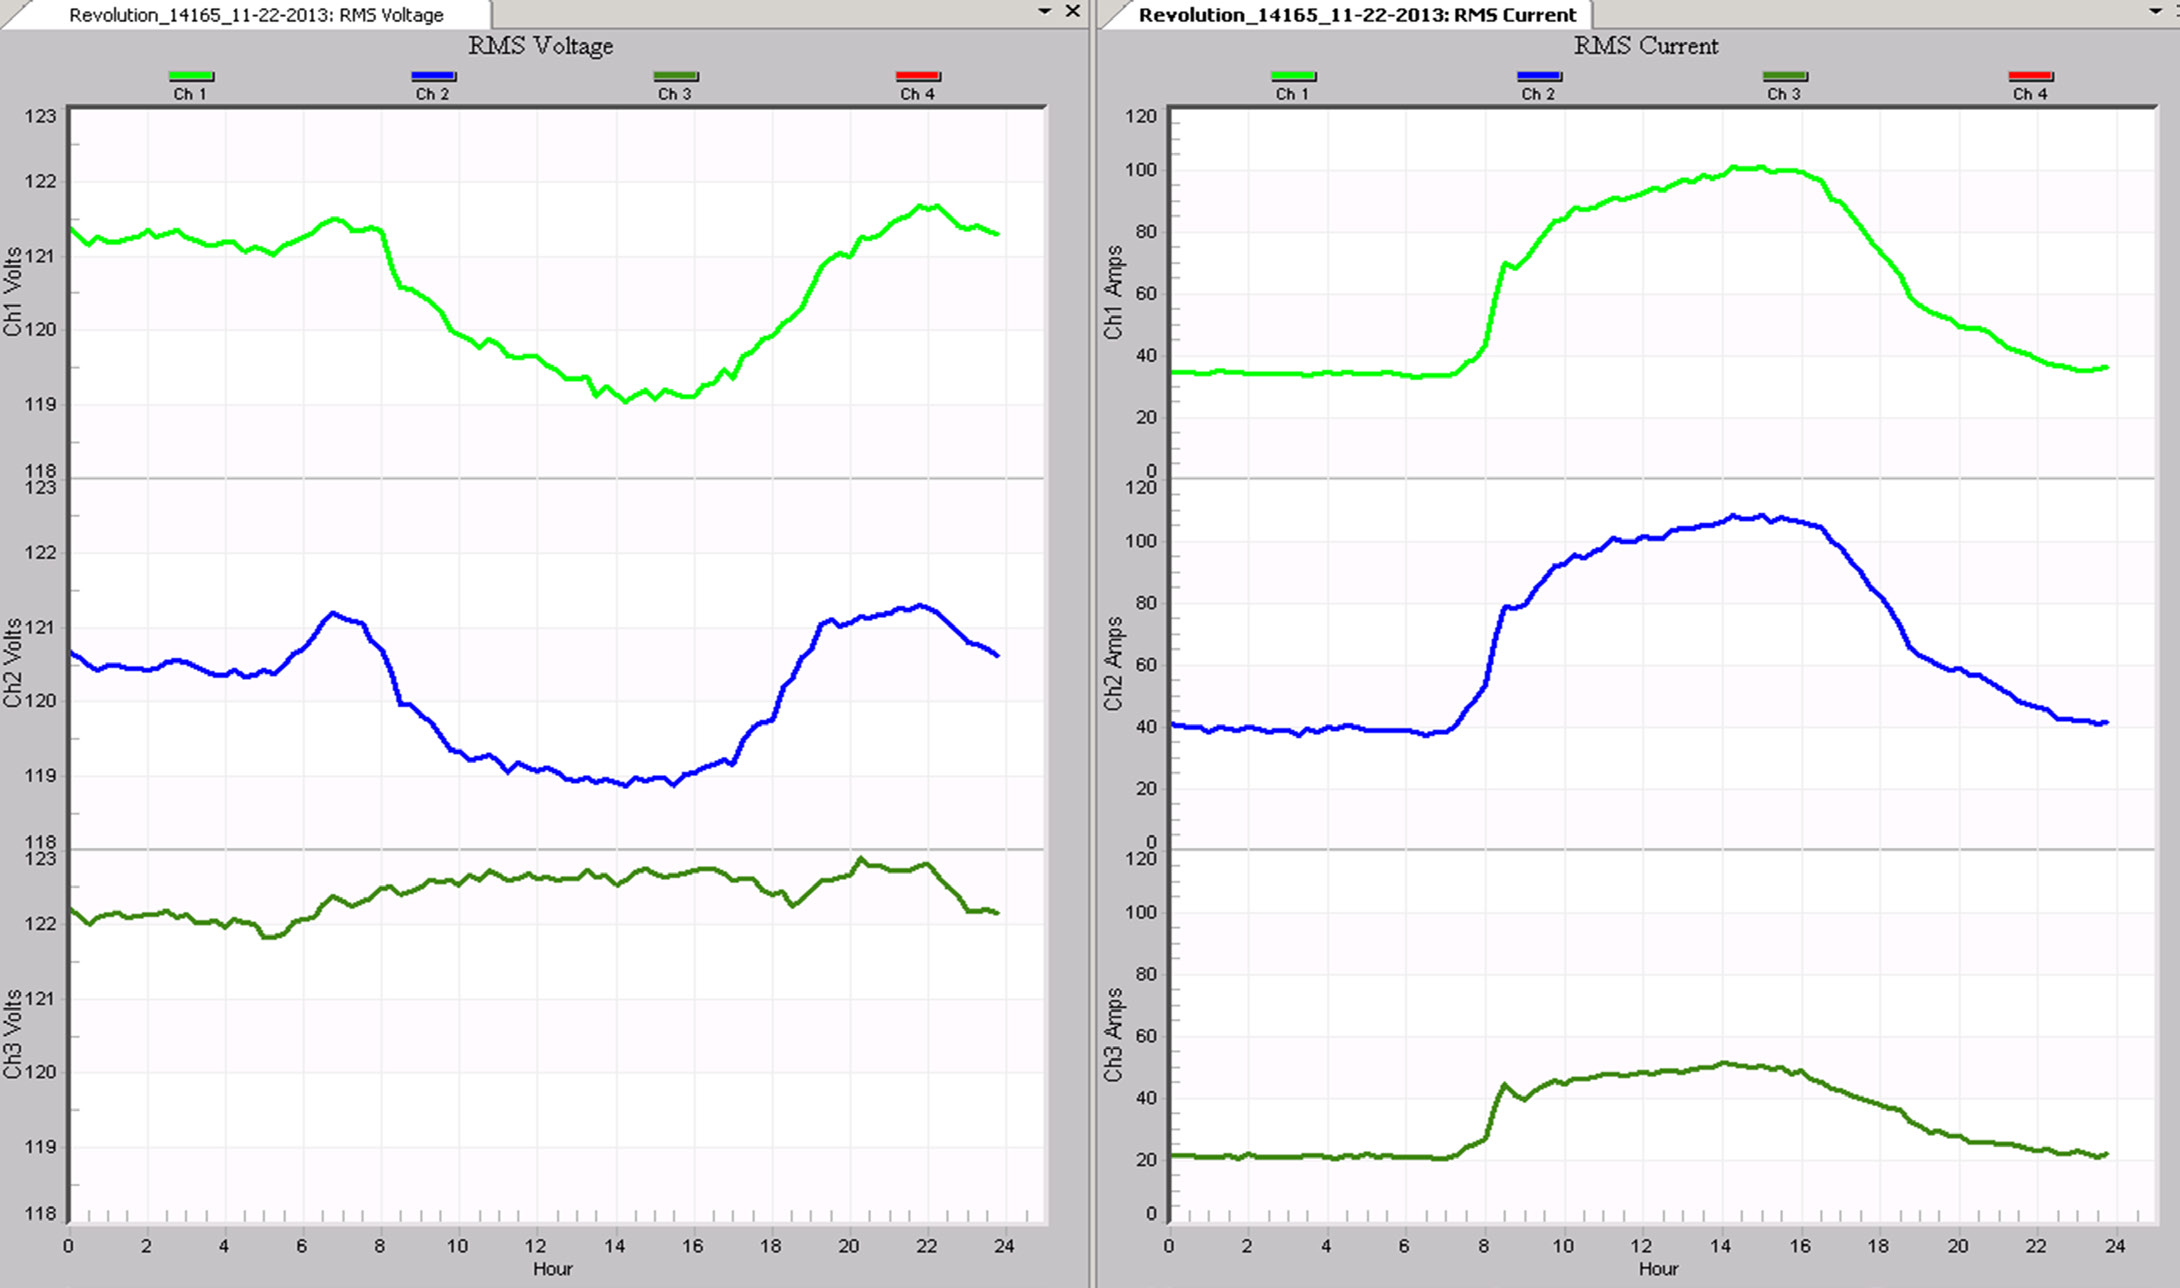
A typical RMS voltage profile is graphed next to RMS current in Figure 3. The voltage on phases A and B sag several volts during the day (from around 8 am to 6 pm), at the same time the load current increases. Phase C’s voltage actually rises a bit during the same time, and the Phase C current is much smaller. Local regulation is increasing the voltage during the day, and the loads on the transformer secondary are pulling the voltage down on phases A and B, more than the regulators are compensating for.
Cycle Histograms
The cycle histograms contain valuable power quality information as well as information for distribution line profiling. Questions such as “what were the absolute highest and lowest RMS voltage?”, “how many cycles was the voltage below 80 volts?”, and “what are the most common load currents?” are easily answered. The histograms also contain the raw data necessary to answer more complicated statistical questions such as “what is the probability of a voltage sag below 100 volts?” and “what high and low limits does the line voltage meet 99.99% of the time?”. Where the Daily Profiles give average current, power factor, etc. for distribution profiling, the histograms show what values are the most common– the “mode” in statistical terms.
What’s Recorded
A Histogram divides a measurement range into many bins. For example, in the Revolution, the voltage Histogram divides the 600V voltage range into 600 bins, each one volt wide, giving a bin for zero volts, a bin for one volt, two volts, all the way to 600 volts. After each 60Hz cycle is measured, the voltage is rounded to the nearest volt and “put” in the appropriate bin. The bins are really counters that count how many cycles were at that voltage. If the 108-volt bin has a count of 45, then there have been 45 cycles with an RMS voltage of exactly 108 volts sometime during the recording session. The Histogram throws away time information: those 45 cycles could have occurred any time during the recording session. They may have been 45 cycles in a row, or three 15-cycle sags, or 45 isolated sags spread out during the entire recording session. (To recover the time information, use the Stripchart or an event-based report.)
Every Stripchart max and min value will have a non-zero count in the corresponding Histogram. For example, if the voltage Stripchart shows six sags to 108 volts sometime during the recording session, there should be a count of at least six in the Histogram at 108 volts. The count will probably be somewhat larger unless each sag was only one cycle long.
There are no settings for Histograms. All available Histograms in a Recorder are always enabled, regardless of the settings for any other record types. Memory does not run out for a Histogram; it just keeps classifying measurements into the bins (by incrementing the bin counters) as long as the recording session lasts. Older PMI recorders may only compute a voltage cycle Histogram for each voltage channel. Any PMI recorders that can measure current and power also records cycle Histograms of current, real, reactive, and apparent power, power factor, displacement power factor, and phase angle.
Suggested Uses
The power of the Histogram is that every cycle is included in the report. Every cycle during the recording session is reflected in the count of one of the bins. If all the counts in a Histogram are totaled, the result is how many cycles the recording session lasted (minus any time under a power outage without battery ride-thru).
Histograms are presented as a bar graph and a report. The report is in some ways easier to read than the graph. The absolute highest and lowest voltages during the recording session are found by finding the highest and lowest bins with a non-zero count. At that point, you also know how many cycles the voltage was at those extremes, and by glancing at the nearby bins, you know how many cycles the voltage was near those extremes. For example, if all the bins below 110 volts are zero, then you immediately know that there was not even a single cycle of voltage below 110 volts anytime during the recording session. If the count at 111 volts is 1,352,200, then the voltage was at 111 volts for over 6 hours (1,352,200/(60×60×60)). By totaling the counts for all the bins in a voltage range (for example, 0 to 90 volts), you find how many cycles the voltage was in that range.
More complicated power quality questions can be answered by exporting the histogram data to a spreadsheet. By dividing each count by the total of all the counts, the histogram data is normalized, and can represent a sample probability distribution function. If a normal, or bell-shaped probability distribution is fit to this data, a standard deviation is created that can be used to answer “what high and low limits does the line voltage meet 99.99% of the time?”. A cumulative sum over the data will convert the distribution function into a sample cumulative probability function. Correlations between channels can be performed by comparing the probability functions of channels. For the voltage histogram, most of the time the user is interested in the few cycles that are outside certain limits, not the vast majority of cycles that are perfectly normal. These few cycles usually represent power quality issues. The current, power, and power factor histograms are useful for distribution line or load profiling. For these histograms, the few cycles at the extremes are usually unimportant: the vast majority in the middle is the good data.
Examples
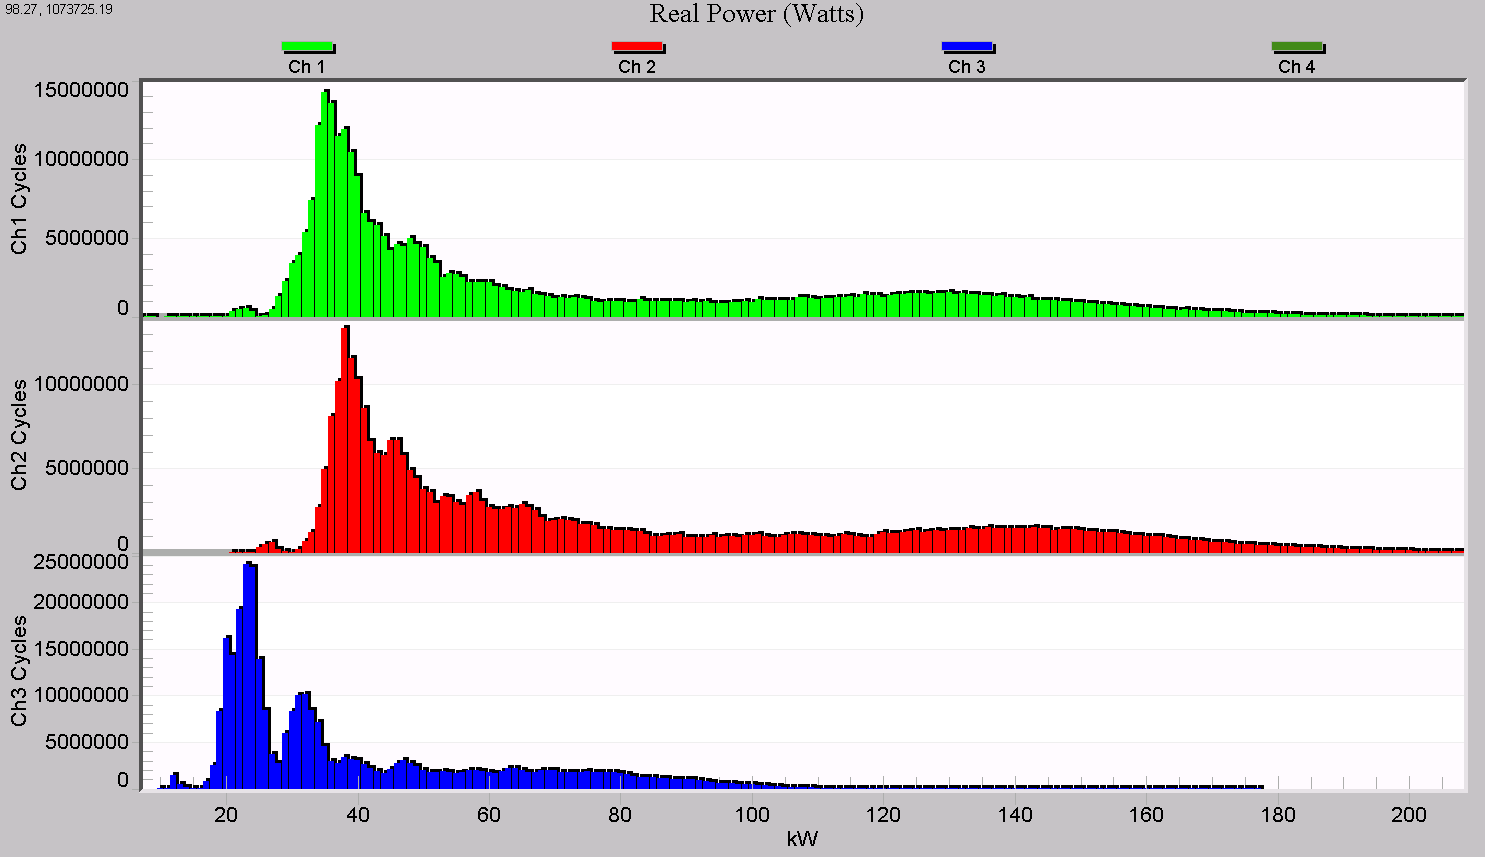
Figure 4 shows a 3 phase real power cycle histogram graph. Most of the load is under 60 kW, but there are significant tails reaching higher – likely motor starts and other quick surges in power. Phase C (blue) is shaped much differently than the other two and is lower overall. This is indicative of an unbalanced load, and could be creating a voltage unbalance problem at this location.
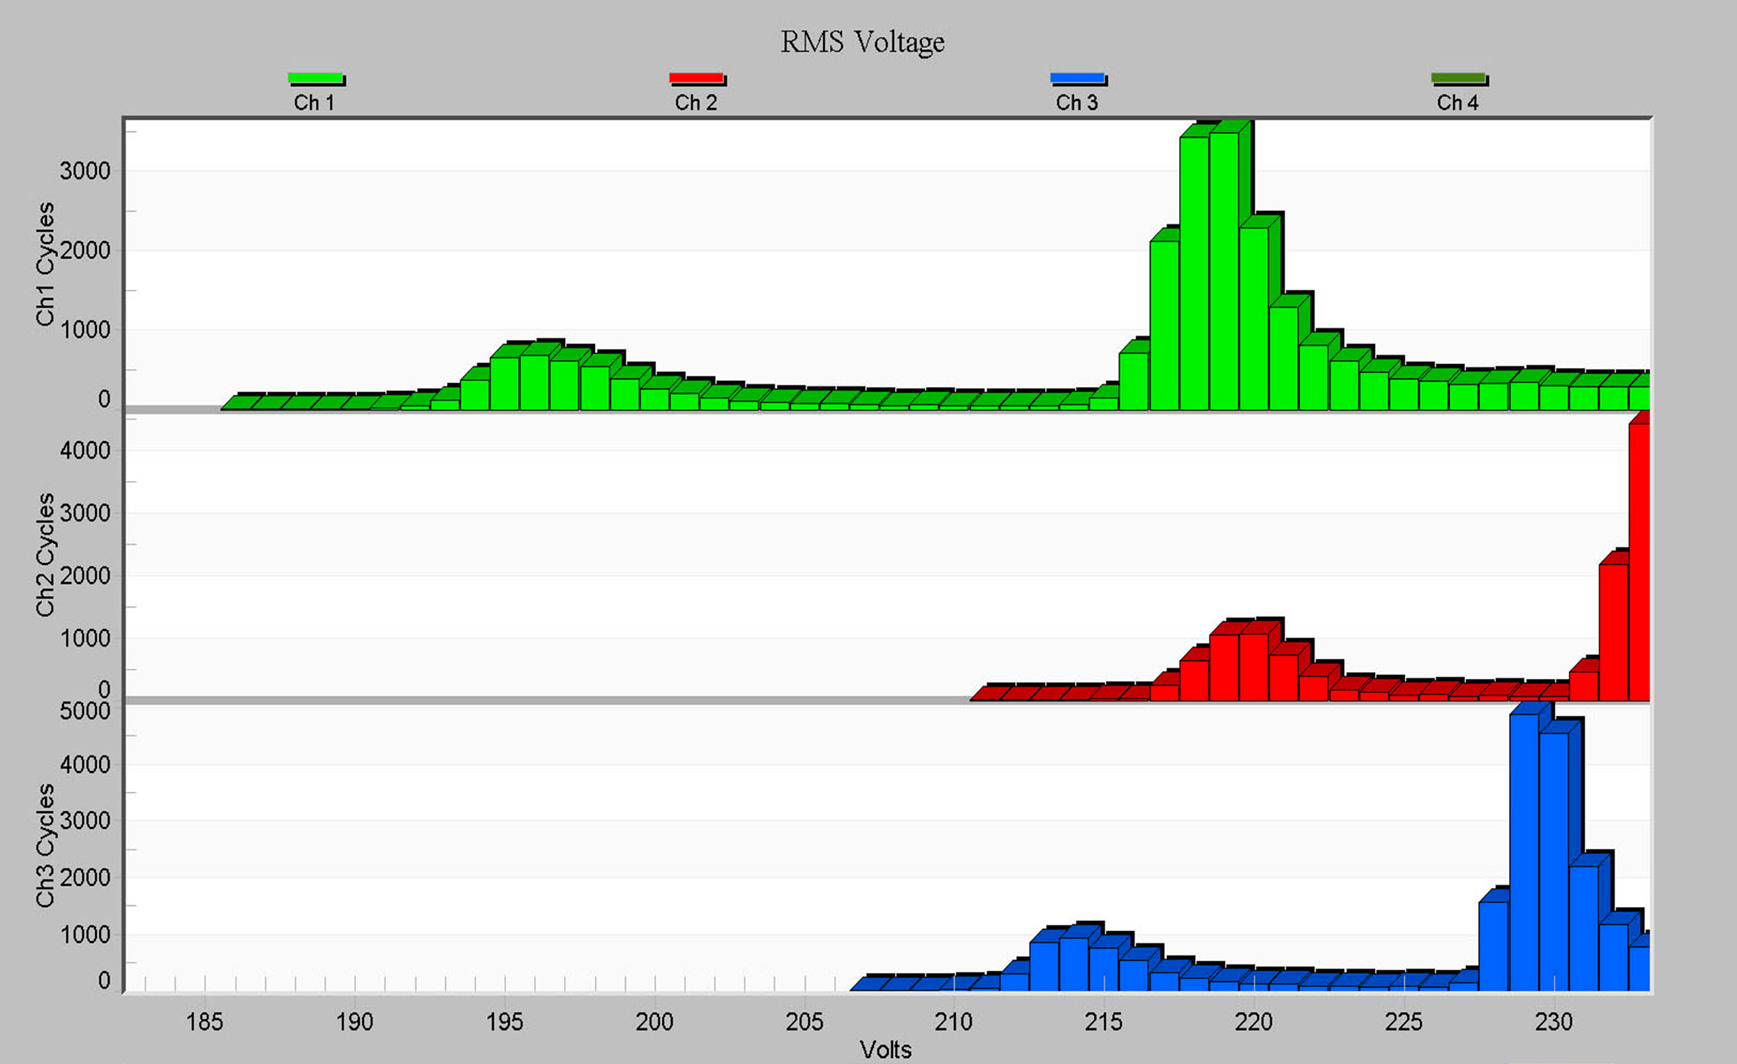
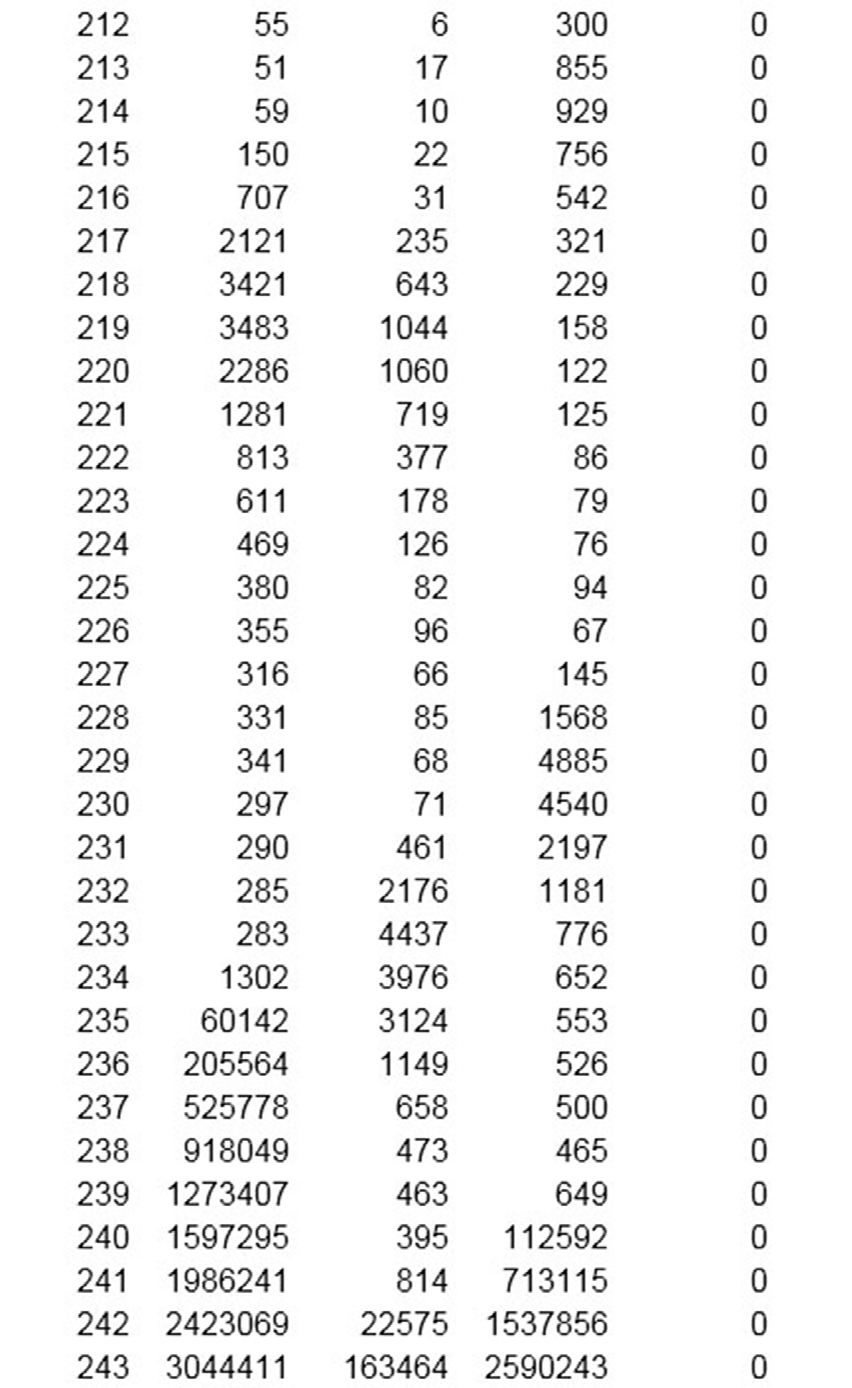
A close-up of the RMS voltage histogram and the corresponding report data are shown in Figures 5 and 6. Many cycles were near 195V and 220V, indicating possibly two different types of loads repeatedly sagging the voltage to these values. They likely correspond to the sags seen in the stripchart data for this recording, from Figure 1.
Minute Histograms
The Minute Histogram provides a much “smoother” version of the Cycle Histogram. Quick sags and swells are averaged out of the data, to show the nominal voltage or current level every minute. Voltage regulation problems are easy to see in the Minute Histogram.
What’s Recorded
The Minute Histogram is similar to the Cycle Histogram. During each minute of the recording session, the voltage is averaged (every cycle is included). At the end of the minute, the Histogram bin counter for that average value is incremented. The result is a Histogram of one-minute average voltage, instead of one cycle voltages. For example, if the voltage were 123 volts for 55 seconds, then 115 volts for 5 seconds, the average would be 122 volts, and the 122-volt bin counter would be incremented. If the Stripchart interval is also set to one minute, then the Stripchart voltage averages will match the Minute Histogram counts.
Like the Cycle Histograms, there are no settings for the Minute Histogram. All available Minute Histograms in a Recorder are always recorded, regardless of the settings for any other record types. Memory does not run out for a Minute Histogram; it just keeps classifying measurements into the bins (by incrementing the bin counters) as long as the recording session lasts.
All Recorders record a voltage Minute Histogram. Recorders that can measure current also record a current Minute Histogram. The voltage Minute Histogram graph is divided into a Nominal Voltage and Abnormal Voltage graph – voltage bins outside the nominal values as defined in the Abnormal Voltage report type are separated, so that baseline voltage and exceedance voltages may be graphed separately.
Suggested Uses
The voltage Minute Histogram can reveal voltage regulation problems. Ideally, the line voltage should be at the same value every minute. The larger the spread in the Minute Histogram, the more the voltage is varying. The center of the spread is (hopefully) the target regulation voltage. This information is also present to an extent in the voltage Stripchart, depending on the recording interval and amount of memory. Because the Stripchart spreads out the voltage averages as a time graph, it can be more difficult to gauge how long the voltage was at certain levels (although it may be easier to see why the voltage was moving).
The Minute Histogram is also better for this analysis because it does not run out of memory and is always set for one minute averaging.
The current Minute Histogram shows average load current on a minute basis. The maximum and average load currents are easily spotted on the Histogram as the edge and the center of the current spread. Again, this information is usually in the current Stripchart, but not as easy to see.
The cycle Histograms can also be used for voltage regulation problems and load profiling, but the Minute Histograms can be easier to read since the fast one-cycle events have been averaged out.
Examples
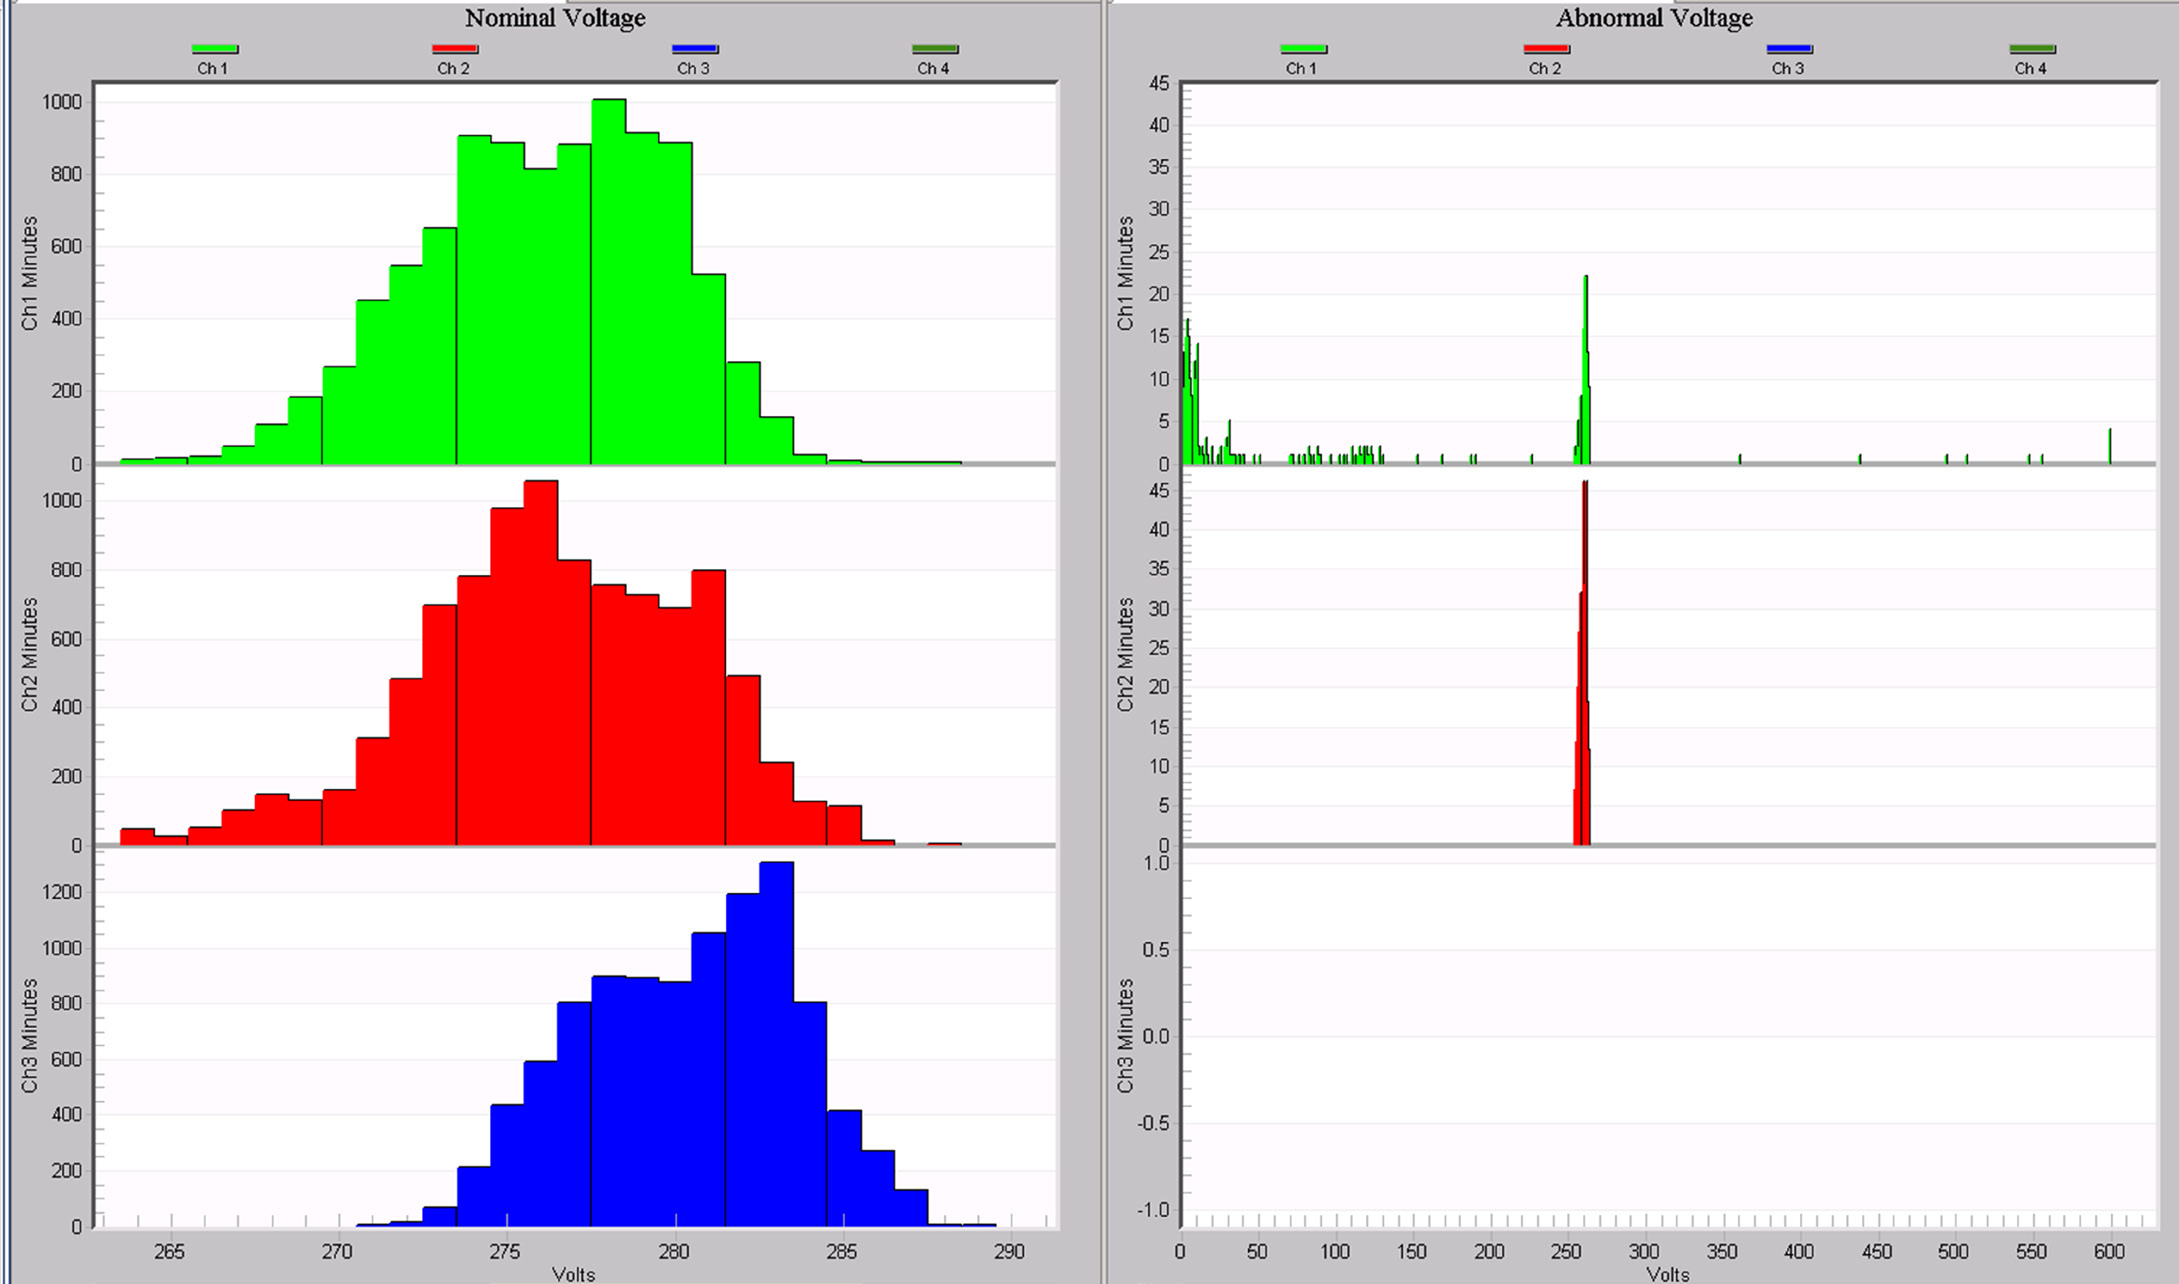
The Nominal and Abnormal Voltage histograms are shown in Figure 7. This data is from the same recording as the previous cycle voltage histograms shown in Figure 5. Note that channel 3 (blue) doesn’t show any readings in the Abnormal histogram – although there were short-term low voltages on that phase, on a 1-minute basis, the measurements were within limits.
Energy Usage
The Energy Usage report shows the accumulated real, reactive, and apparent power measured by the Recorder. The accumulated real power is energy, in kilowatt-hours. The accumulated reactive and apparent powers are kilovar-hours and kilovolt-amp-hours, respectively. These totals are for the entire recordings session and are only available on Recorders which can compute power.
What’s Recorded
Each cycle, the real, reactive, and apparent power values are computed and added to the running totals for the recording session. These values include the effects of voltage and current harmonics. The accumulated powers are totaled separately for each channel for a wye hookup. With a delta hookup, the individual phase powers cannot be measured, only the total. In this case, the three phase total real, reactive, and apparent power values are totaled and reported.
Negative power values are included in the accumulation. For example, if a load is both absorbing and generating power (at different times, of course), the accumulated power will reflect it. A line that varies from leading to lagging power factor may have a small accumulated reactive power reading, even though at different times the actual reactive power flow was large. This would happen if the negative VARs accumulated during the periods of leading power factor mostly canceled the positive VARs during the periods of lagging power factor.
Suggested Uses
There are no settings for the Energy Usage report. This report can be used to measure the energy consumption of a monitored load, or accumulated reactive power in power factor studies. A revenue meter that doesn’t total negative power, or doesn’t include the effects of harmonics may show readings that differ from this report.
Examples
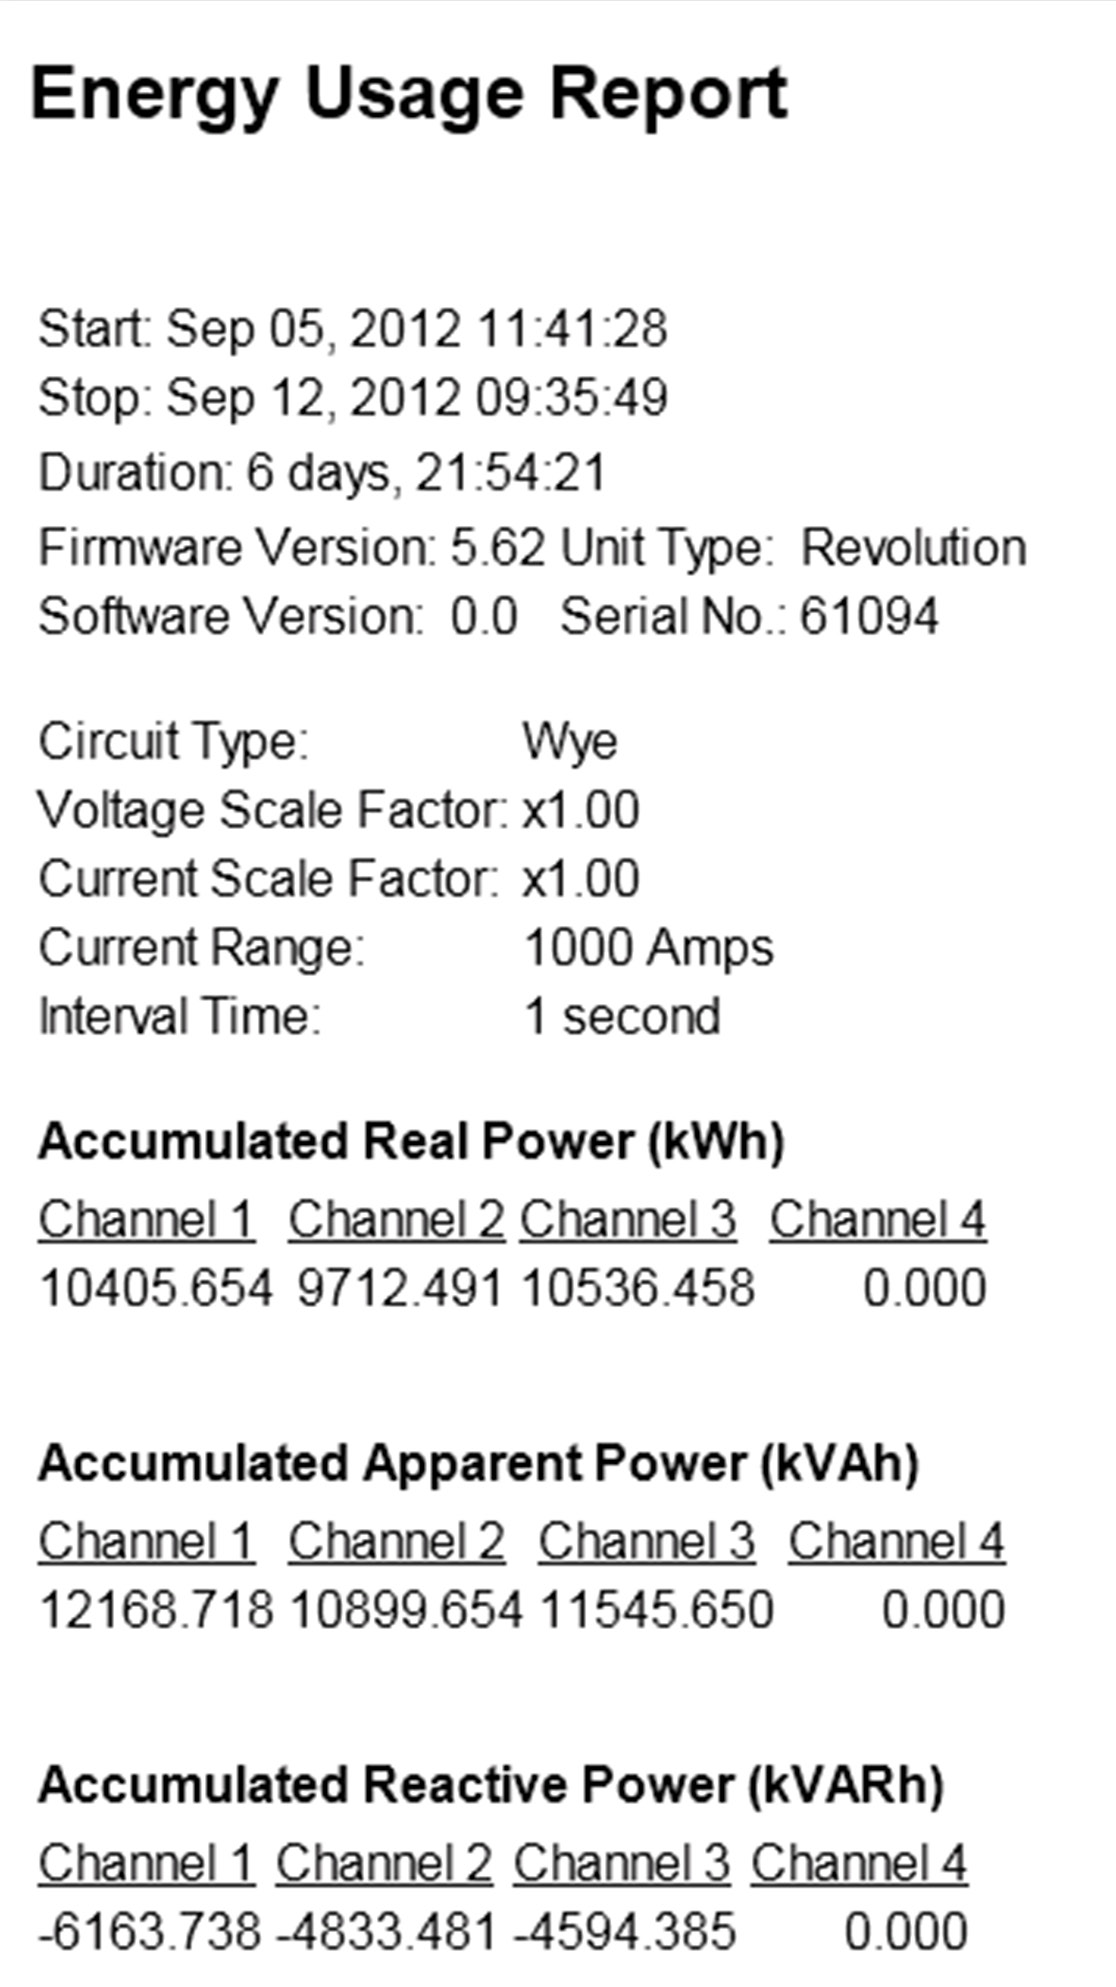
Figure 8 shows a sample of the Energy Usage report. The real, reactive, and apparent usage for each phase is tabulated.
Conclusion
A quick summary of the non-triggered record types used by PMI recorders has been presented, describing what’s recorded, any parameters to adjust, and some suggested uses and examples. The Stripchart, Daily Profile, and Histogram graphs/reports are important tools for profiling distribution voltage, current and PQ parameters, and especially for correlating movements in one measurement type with another. The Stripchart is the key data type for discovering correlations, and the bulk of recorder memory is reserved for them. The Daily Profiles and Histograms have the advantage of always being enabled, with no parameters to adjust, and thus present in every recording.
