Abstract
This white paper covers and explains three of IEEE’s most common Flicker definitions: IFL, Pst and Plt. The GE Flicker Curve and how other measurements standards compare to the GE Flicker Curve will be covered briefly; for more information on the GE Flicker curve please refer to the whitepaper “Application of the GE Flicker Curve.” The focus of this paper is to provide a better understanding of IEC 61000-4-15 and how IFL, Pst and Plt are derived.
Flicker’s Definition
When most power consumers refer to flicker, it is usually in reference to an inconstant or wavering light. A more precise definition of lamp flicker quoted from the IEC technical vocabulary is, “The impression of unsteadiness of visual sensation induced by a light stimulus whose luminance or spectral distribution fluctuated with time”. Excessive flicker perceived involves the eyes and the brain; if it continues for a long enough time, it can be very irritating and annoying to a customer. At what point this flicker becomes irritating or even perceivable varies from person to person and depends on a number of factors. Some of these factors include a person’s age, neurological, psychological and overall health, and the individual’s critical flicker frequency. The individual’s critical flicker frequency (CFF), also referred to as flicker-fusion, occurs within a range of about 5 to 50 Hz. Under normal steady state power conditions, most people would observe an incandescent light bulb to be emitting perfect steady light as if the power source was DC even on a 60 or 50 Hz system. The CFF gradually decreases with age in adults; however, there remain some differences from person to person even at the same age. In some situations, humans can perceive visible changes in light output with as little as 0.25% changes in the RMS voltage that powers the light source.
The Cause of Flicker
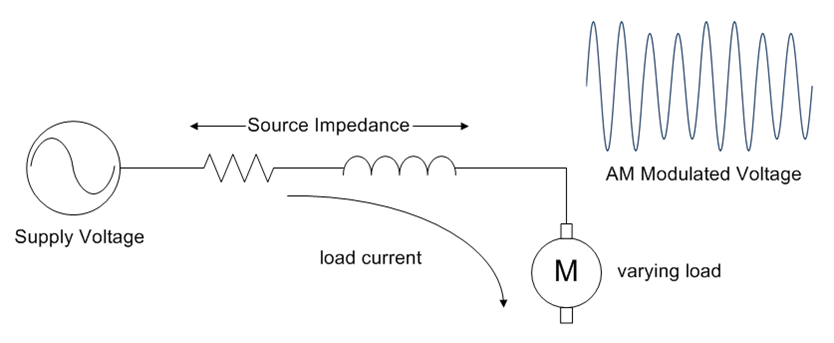
Flicker is due to a load change which produces a voltage drop across a system’s impedance which, in turn, causes variations in the voltage applied to lighting equipment (Figure 1). Among the industrial loads that cause flicker are starting of large induction motors, arc furnaces and electric welders. In residential areas, flicker can be caused by loads like heat pumps, air conditioners, ovens, small welders and even hair dryers. The effects of flicker can be more pronounced when there is high impedance or a loose connection. Sometimes excessive flicker can be a warning sign to check for loose connections. Ohm’s law suggests that where there is a voltage drop in series with the load, I2R, heat is being generated and in some cases could be a fire hazard. Figure 1 shows how a varying load across the wiring impedance causes the modulation on the line voltage.
Standards of Defining Flicker: The GE Flicker Curve, IEEE 141
There are several major standards that have been developed over the years to quantify flicker. The first of these standards was IEEE 141, the GE Flicker Curve, which was developed from research done in 1921 on human response to light fluctuation. The GE Flicker Curve is a calculation of frequency based on the number of voltage dips, not the number of changes. This flicker curve used square-wave step changes in line voltage at a constant frequency as shown in Figure 2. The percentage of the voltage dip equals the delta voltage divided by the line voltage. The GE flicker curve is made up of two curves, the borderline of visible flicker and the borderline of irritation as shown in Figure 3.
Flickermeter Measurements
The GE flicker curve measurements, although good for their time, have several shortfalls that have been addressed by the IEC 61000-4-15 (IEEE 1453) flickermeter measurement. For example, the GE flicker curve is based off of square wave type changes in the voltage variation at a constant frequency. IEC 61000-4-15 is based on many loads resulting in more random and varying fluctuations, not just simple square wave voltage variation at a constant frequency. Flickermeter measurement standards are typically included in power quality monitors, but not in simpler standalone test equipment. The flickermeter standards described in IEC 61000-4-15 standardize flicker monitoring across different manufactures.
Functions of the IEEE 1453 Flickermeter
The flickermeter standards require a normalized input voltage. It demodulates a flicker signal 60 Hz peak fluctuation waveform, filters and weights the flicker signal, samples the instantaneous flicker signal (IFL), and then performs statistical analysis of the IFL. From this information it is able to calculate Percentile Short Term flicker (Pst) and from that it can calculate Percentile Long Flicker (Plt). See Figure 4.
Flickermeter Definitions and Equations
IFL, Instantaneous Flicker Level, is directly based on the IEEE 1453, IEC 61000-4-15 standards. As its name implies, IFL quantifies voltage fluctuation at a given instant. Phenomena that would cause a sudden voltage sag to occur, such as a low impedance load suddenly being switched on, would immediately cause a change in the IFL data. IFL calculations are based on studies conducted on humans that provided an eye-brain sensitivity curve for different modulating frequencies regardless of how often the fluctuations may occur.
Pst, Percentile Short Term flicker is based on IEEE 1453, IEC 61000-4-15 standard. Pst is a measurement associated with noticeable flicker of incandescent lights due to fluctuation of the AC voltage that powers the light. The “P” in Pst stands for the flicker severity factor. “P” can be evaluated on a 10 minute basis in which the “ST” stands for Short Term. Short Term is defined over a 10 minute interval versus Plt where the “LT” stands for a Long Term interval of 2 hours.
Plt or Percentile Long Term flicker is also based on the IEEE 1453, IEC 61000-4-15 standards. Plt is the measure of long term flicker used for determining the combined effect of several randomly operating loads. Plt is a root mean average of the Pst value over 12 period sliding time span.
Plt values above 1.00 are generally considered a potential issue. During the development and testing phase, 1.00 was established as the value where half of all people tested indicated that the flicker level was noticeable and found it to be irritating. Plt can be computed by software after a recording by using only the Pst data. Figure 5 shows recommended flicker limits to avoid complaints. Figure 6 shows a comparison of IEEE 141 the GE Flicker Curve and IEEE 519 Flicker Curves, Threshold of Irritability.
| Compatibility Levels | ||
|---|---|---|
| Voltage Level | Pst | Plt |
| <35 kV, >35 kV <230 kV | 1.0 | 0.8 |
| Planning Levels | ||
| Voltage Level | Pst | Plt |
| Low, Med. V | 0.9 | 0.7 |
| Med. V, 1 kV – 35 kV | 0.8 | 0.6 |
| High V – EHV | IEEE 519 | |
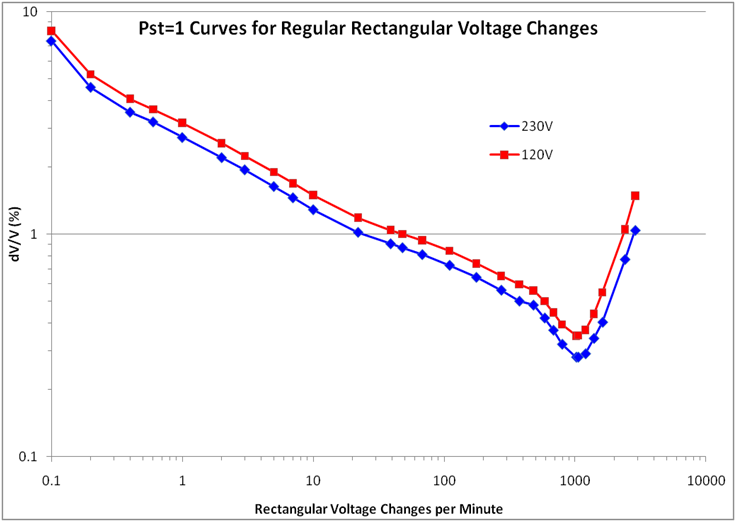
The original versions of IEC standard are based on the effect of voltage fluctuations on 60 watt, 230 volt system as shown in Figure 7. As the graph shows, the 120 volt bulb is not as sensitive to voltage fluctuations because the larger filament size for a given amount of watts has a longer time constant, thus a slower change in illumination. The 120 volt weighting curve is used in the United States in the flickermeter implementation of IEC 61000-4-15.
Finding the Source of Flicker
PMI recorders conform to the IEC 61000-4-15 flicker conformance tests. These include the Revolution, Seeker and Guardian. Each of these recorders is tested to IEC conformance before shipping.
In Figure 8, IFL vs. load current is shown using the ProVision stripchart function. IFL is very useful for locating the source of flicker.
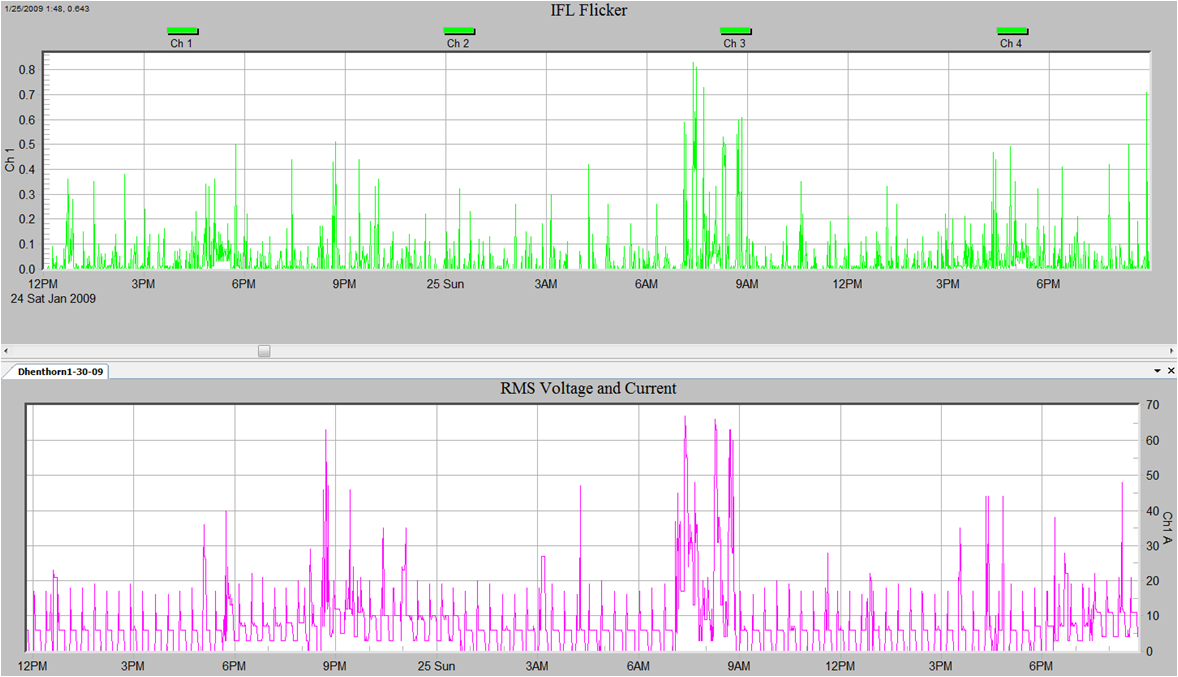
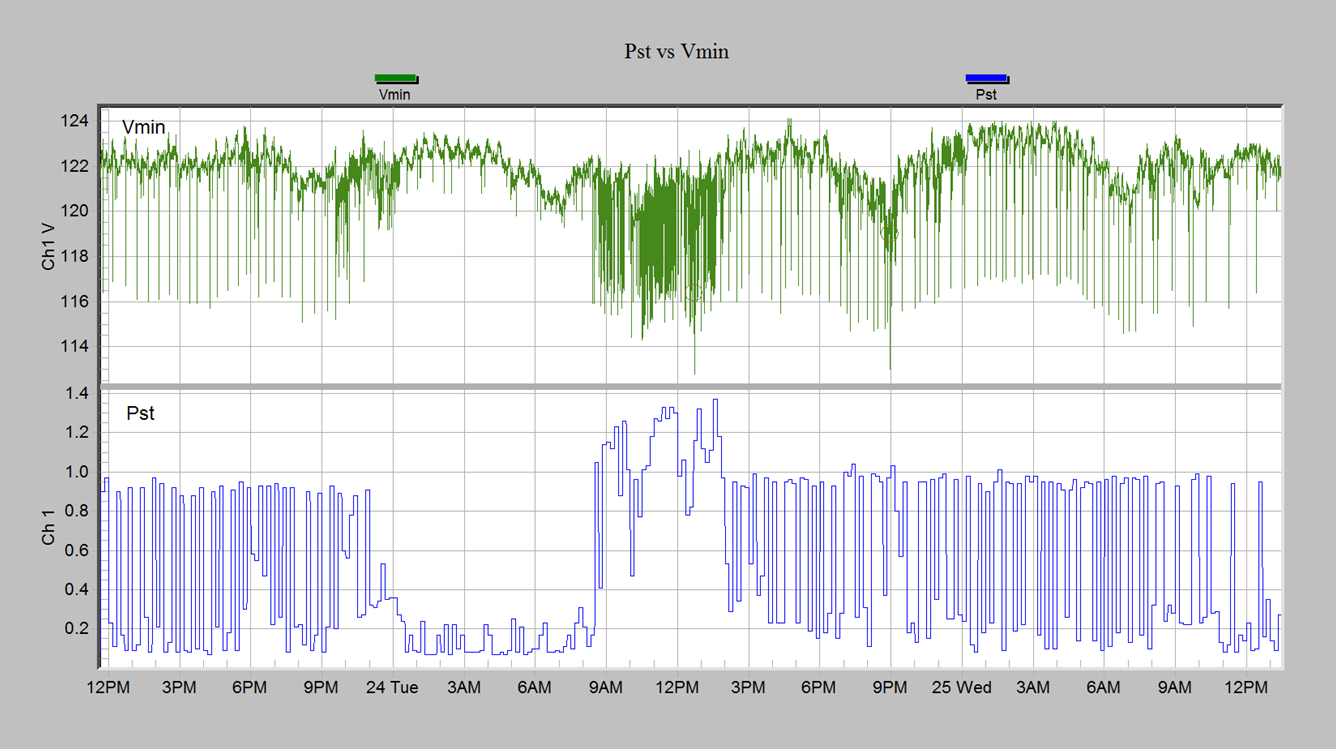
Figure 9 shows Pst vs Voltage Fluctuations time trend plot captured by a PMI Revolution. Pst is used for determining the severity of the flicker.
Nowadays the short-term flicker severity value Pst and the long-term flicker severity value Plt are the commonly used quantities for the characterization of flicker level in an electrical network in the majority countries in the world. But in some areas of the Far East such as Japan and Taiwan, power companies use other criterion for the assessment of voltage fluctuation, the voltage flicker index ΔV10 which characterizes the actual flicker with respect to an equivalent value of the voltage modulation component with the frequency of 10 Hz. There are a lot of attempts to find a simple and reliable approach for converting from one index to other by multiplying the index with a factor, but no universal method has been developed.
Conclusion
- IFL stands for Instantaneous Flicker Level and quantifies voltage fluctuations at a given instant. IFL is very useful for locating the source of flicker.
- “P” stands for Flicker Severity Factor.
- The “st” in Pst stands for Short Term, evaluated on a 10 minute basis. Pst is used for determining the severity of the flicker.
- The “lt” in Plt stands for the Long Term interval defined as 2 hours.
- Plt is a root mean average of the Pst value over 12 period sliding time span.
IEEE 1453 is currently the preferred measurement method compared to the IEEE 141, the older GE Flicker Curve method, which is based on a simple square-wave voltage variations at a constant frequency.
PMI recorders can be user configured to make both flicker measurements. IEEE 1453 is the suggested method for measuring flicker because it more accurately accounts for complex voltage fluctuations which are more common in real world flicker situations, and it standardizes flicker monitoring across different manufacturers.
The human perception of flicker varies somewhat from one person to another. Scientific studies of flicker’s effect on human sensitivity and tolerance has helped set the standards for today’s electrical power quality. Understanding the standards and monitoring the compliance of the power quality in reference to those standards can help provide a better quality of life for everyone. PMI’s ProVision software and PQ analyzers support several critical flicker measurements including Pst and Plt.
