Abstract
It is very important to have recommended guidelines and practices in place regarding power quality monitoring with the use of consistent terminology and definitions of power quality phenomena. This is the basis of the IEEE 1159 Standard. It allows for clear and consistent communication between engineers, technicians and others involved in power generation and distribution system.
The IEEE 1159 and the IEC 61000 both cover power quality standards, but unlike the IEC 61000, the IEEE 1159 is a recommended guideline which is very informative, but not a national standard enforced by law.
Purpose
IEEE Standard 1159 is a document that specifies the recommended practices for monitoring electric power quality. The understanding of the IEEE 1159 standard enhances the ability to convey information about a power quality issues or phenomena and allows the assignment of accurate quantitative information aiding in the knowledge in what actions need to be taken to ensure and maintain proper power quality. In the past, because of the different segments of the technical community using different definitions and terminologies to describe electromagnetic effects, it was sometimes difficult, if not impossible to establish effective communication causing delays in understanding the power quality issue and thus delaying the solutions.
The IEEE Standard 1159-2009 is an 81 page document which is a revision of the original 1159-1995 release and all of its content could not be covered in a single white paper. For the purpose of this paper, I will focus on part 3 of the document: the definitions. I will note other PMI white papers under each basic definition to allow a better understanding of each topic.
3.1 Flicker
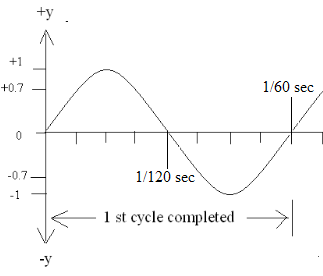
Flicker is defined as the impression of unsteadiness of visual sensation induced by a stimulus whose luminance or spectral distribution fluctuates with time. Technically, flicker refers to fluctuations in light flicker, but from a power quality standpoint voltage variations are the underlying cause. Flicker is a unique PQ issue in that the symptom is customer perception and irritation, not equipment mis-operation. This makes it difficult to quantify and mitigate. There are two flicker standards – the older GE flicker curve (Figure 1), and the newer IEEE 1453 method. The GE method was developed many decades ago, and is based on a single rectangular modulation of the AC 60Hz waveform. This is expressed as “dips per minute”, relating how often the RMS voltage changes by a certain fixed percentage with the likelihood of customer irritation. The newer method is much more advanced, and able to handle multiple voltage sag sources at irregular intervals. The result is a set of three readings over time – instantaneous, short-term, and long-term flicker levels.
For more information, please read the following PMI white papers: Understanding IEEE Flicker, IFL, Pst, Plt; Application of the GE Flicker Curve; Flicker Standards Used by PMI Recorders; and Strategies for Investigating Flicker.
3.2 Fundamental Components
Fundamental components is related to the fundamental line frequency, either 50 or 60 Hz of the Fourier series of a periodic quantity. This refers to first harmonic of a distorted AC waveform, which is the 60Hz component in the US. It’s a pure sine wave (Figure 2) at the power line frequency. With no harmonic distortion, the fundamental is the entire AC waveform. A pure sine wave has three parameters – amplitude, frequency, and phase. The frequency is the power line frequency, and amplitude and phase can be determined from a Fourier harmonic breakdown.
A good white paper for measuring and monitoring the Fundamental Line frequency is entitled Measuring Frequency with PMI Recorders.
3.3 Imbalance or Unbalance Voltage or Current
Imbalance or unbalance voltage or current is related to the ratio of negative sequence component to the positive sequence component, normally expressed as a percentage. This can also be expressed as the maximum deviation from the average divided by the average. This quantifies the difference in amplitude among the three phases of voltage or current. Voltage unbalance of more than a few percent can cause overheating of motors and large electronic loads. The ratio of voltage to current unbalance can also present a sign of impending equipment failure. Some related white papers are Measuring Voltage Unbalance, and Hidden Delta Voltage Unbalance.
3.4 Impulsive Transient
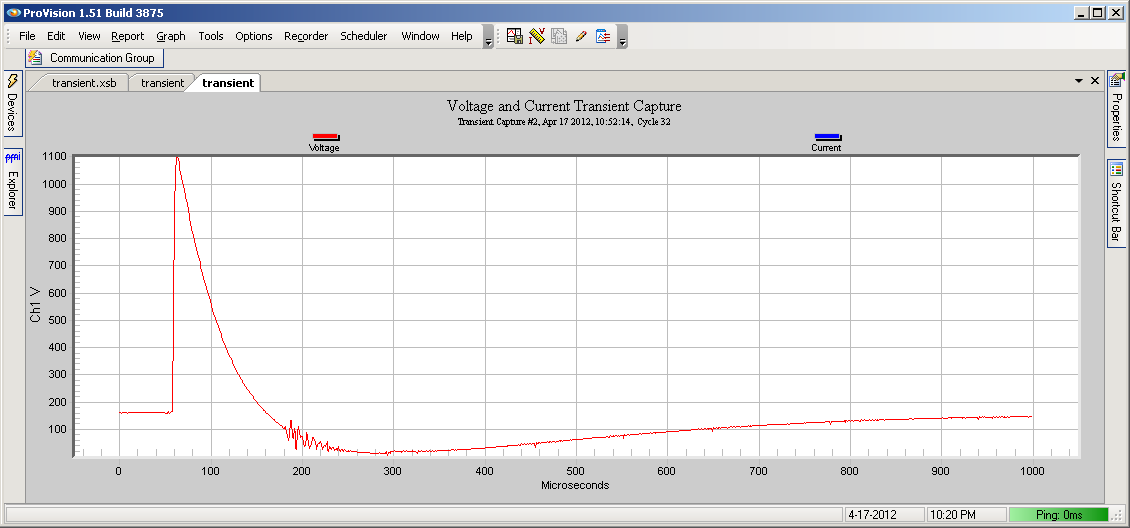
An impulsive transient is defined as a sudden non-power frequency change in a steady-state condition of voltage or current that is unidirectional in polarity. Impulse transients (Figure 3) are very fast events, typically in the tens of microsecond range. These are caused by nearby lightning strikes or switching events. The typical distribution impedance attenuates these very quickly, so they don’t propagate very far down a power line. Please read the white paper on Transient Capture with the Vision and Revolution, and for more information on transient please check out PMI’s Advanced Transient Assessment Class.
3.5 Instantaneous
Instantaneous is used to quantify the duration of a short-duration RMS variation as a modifier in reference to a time range from 0.5 cycles to 30 cycles of power frequency. For the US, this is from 8.33 milliseconds to 1/2 second, and is much slower than an impulsive transient. Most voltage sags and swells are in this time frame. Typical offenders are motor starts, short recloser events, etc.
3.6 Interharmonic Component
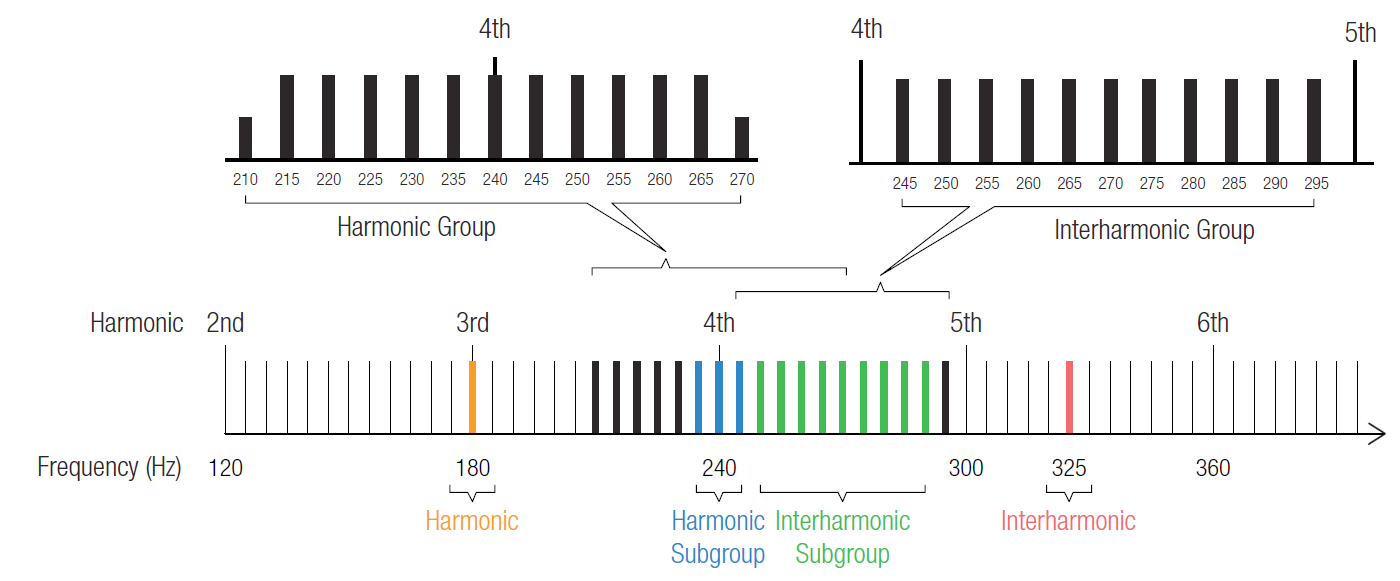
An interharmonic component is a frequency component of a periodic quantity that is not an integer multiple of the frequency at which the supply system, line frequency is operating, such as 50 or 60 Hz. These are components between the standard harmonic frequencies. Interharmonics (Figure 4) can be produced by AC inverters from solar generation, fast load variations from rotating machinery, or non-synchronous loads such as arc welders. A few PMI white papers on this definition and related topics are Defining Interharmonics; Calculating Interharmonics with Raw Waveform Data, and Interharmonics in ProVision.
3.7 Long-Duration RMS Variation
A long-duration RMS variation is a variation of the RMS value of a voltage or current measurement from the nominal for a time greater than 1 minute. This relates to momentary interruption, temporary interruption, sustained interruption, undervoltage or overvoltage. Issues here are more related to voltage regulation or reliability rather than voltage sags or other event-driven problems. The whitepaper Voltage Regulation with Daily Profiles shows a method for analysis.
3.8 Momentary Interruptions
A momentary interruption is a type of short-duration RMS voltage variation where the complete loss of voltage <0.1 per unit system on one or more phase conductor is for a time period between ½ cycle and 3 seconds. If the voltage is above 0.1 pu, it’s considered a voltage sag.
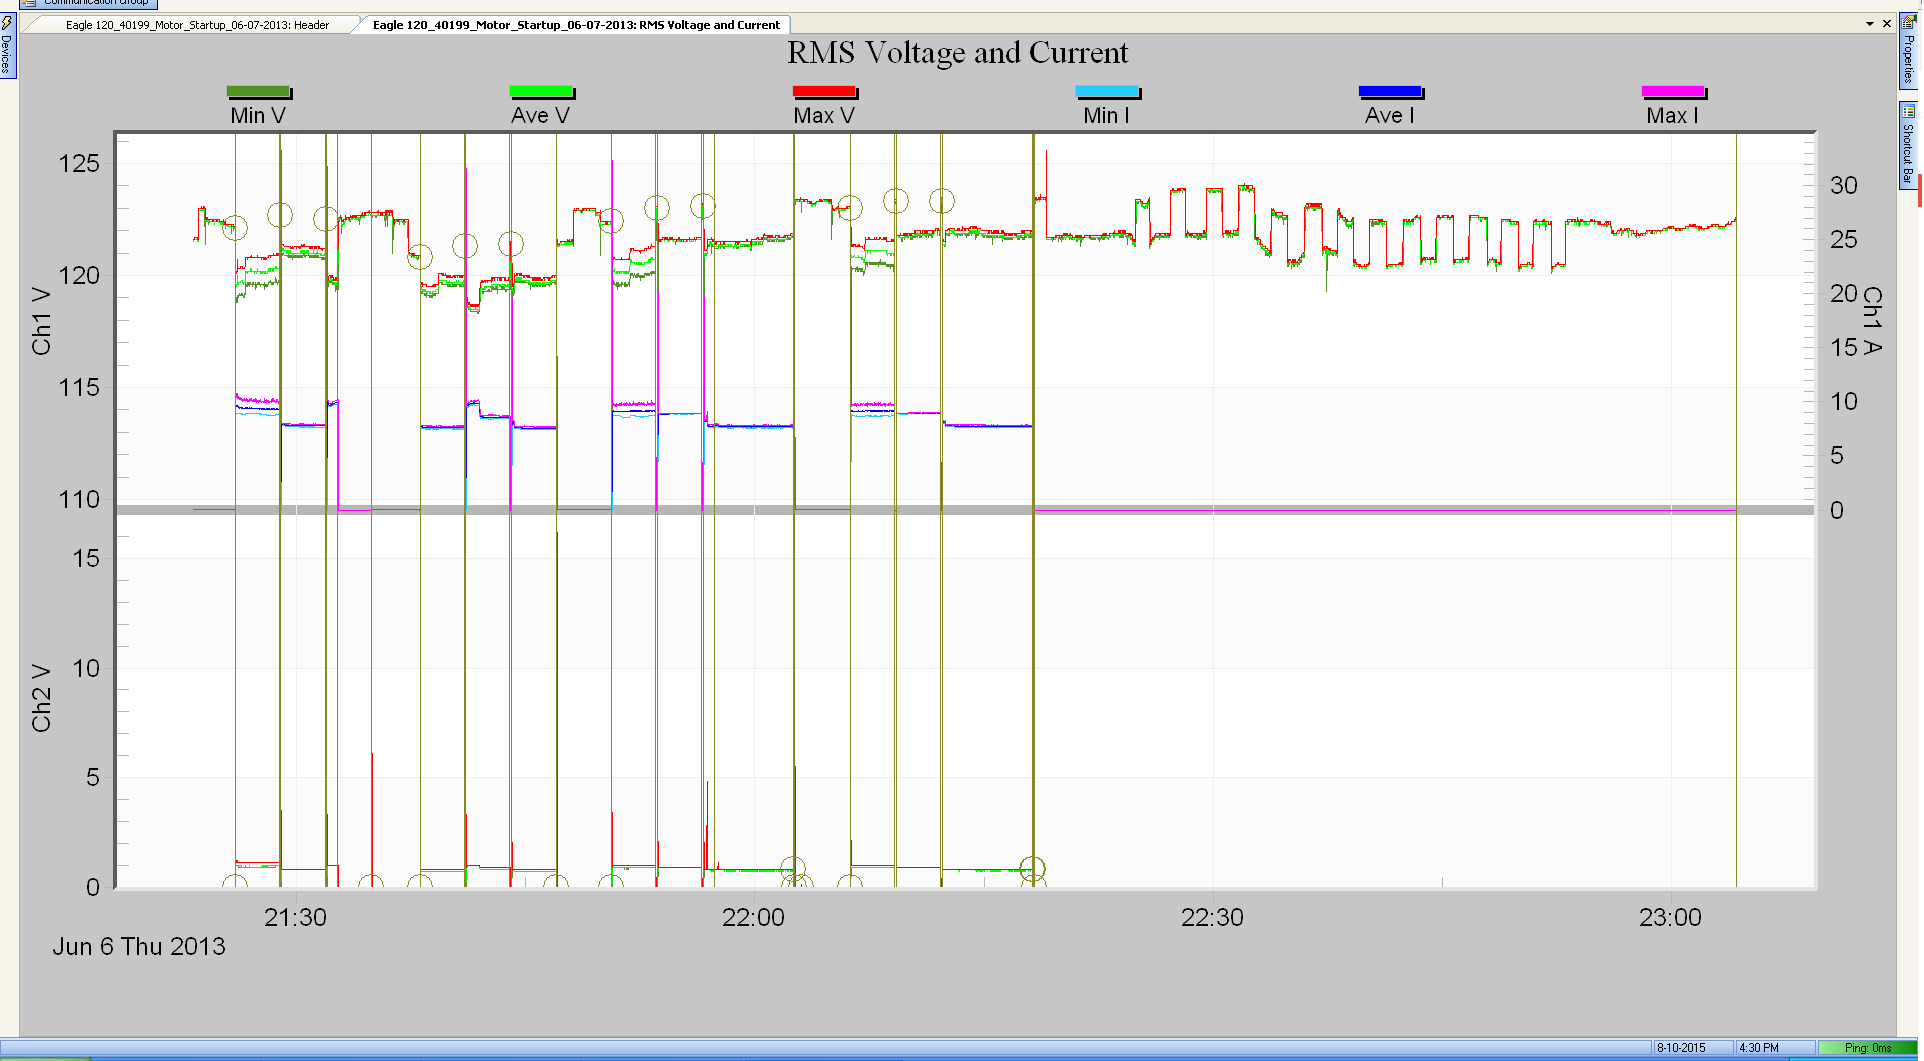
3.9 RMS Variation
RMS variation is a term often used to express a variation in the RMS value of a voltage or current measurement from the nominal. This can be related to sag, swell, momentary interruption, temporary interruption, sustained interruption, under voltage and overvoltage. An example graph is shown in Figure 5. For more information please check out the following PMI white papers: Machine Shutdowns Due to Voltage Sags; Spot Sags, Loose Neutrals, THD with Custom Graphs; Event Capture Function; Identifying the Source of Voltage Sag; RMS Capture graph in ProVision; Waveshape Triggering For Waveform Capture; and Measuring Abnormal Voltage.
3.10 Short-Duration RMS Variation
A short-duration RMS variation is defined as a variation of the voltage or current from the nominal for a time greater than 1/2 cycles of the power frequency but less than or equal to 1 minute. When the RMS variation is voltage, it can be further described using a modifier indicating the magnitude of a voltage variation (e.g., sag, swell, interruption) and possibly a modifier indicating the duration of the variation (e.g., instantaneous, momentary, temporary). This includes the “instantaneous” category above. Many PQ events are in this range — anything longer is usually a regulation issue.
3.11 Sustained Interruption
A sustained interruption is a type of long-duration RMS voltage variation where the complete loss of voltage <0.1 per unit on one or more phase conductors is for a time greater than 1 minute. For outage reporting statistics, interruptions longer than 1 minute are usually counted differently, as they may last for an extended period of time while the problem is corrected in the field.
3.12 Temporary Interruption
A temporary interruption is a type of short-duration RMS variation where the complete loss of voltage <0.1 per unit on one or more phase conductors is for a time period between 3 seconds and 1 minute. Interruptions in this range are usually corrected automatically with reclosers or other switching, and are not classified with longer interruptions where manual intervention is necessary.
3.13 Voltage Change
A voltage change is a variation of the RMS or peak value of a voltage between two consecutive levels sustained for definite but unspecified durations. This is a regulation PQ issue, and can be caused by mis-operation on a tap changer, or local generation causing changes in line voltage. Please check the Measuring Abnormal Voltage and Significant Change Report and Graph white papers for voltage changes, and voltage fluctuations.
3.14 Voltage Fluctuation
A voltage fluctuation is a series of voltage changes or a cyclical variation of the voltage envelope. These voltage fluctuations are the usual cause for light flicker, and are often only a problem if the light flicker becomes objectionable. The IEEE 1453 flicker standard is the best method for quantifying these fluctuations.
3.15 Voltage Interruption
A voltage interruption is the disappearance of the supply voltage on one or more phases. It is usually qualified by an additional term indicating the duration of the interruption (e.g., momentary, temporary, sustained).
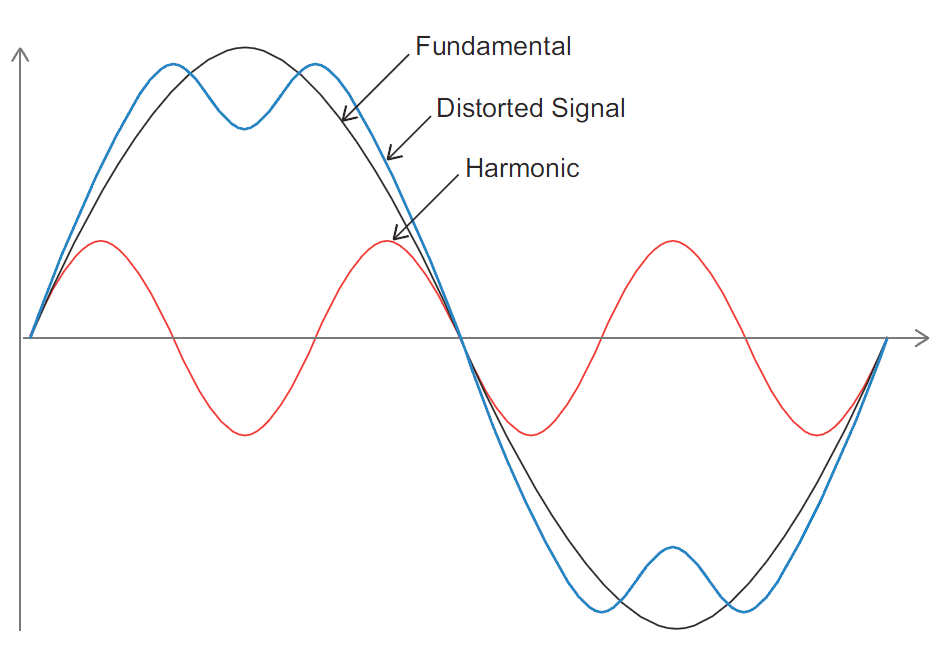
3.16 Waveform Distortion
Waveform distortion is a steady-state deviation from an ideal sine wave of power frequency principally characterized by the spectral content of the deviation. This is shown in Figure 6. This is a broad category that covers harmonic and interharmonic distortion. The key here is “steady-state”. This excludes transients and ringing from switching events, etc. Harmonics and interharmonics are steady-state distortions that persist over many cycles (and seconds). Any type of steady-state distortion may be analyzed with harmonic and interharmonic breakdowns.
PMI’s white papers on Understanding Total Harmonic Distortion and Understanding Harmonics can shed some light on waveform distortion.
With an understanding of the IEEE 1159 guidelines, it is important to have systems in place to monitor power quality. One of the main reasons to monitor power quality is to identify power quality issues before they cause customer issues and sometime equipment failure leading to widespread power outages. It is important to recognize the source of the power quality issue and by being aware of how the network’s impedance changes results in power measurement changes. As specified in the IEEE 1159, when looking for certain types of power quality issues, sometimes where in the network you monitor can be just as important as what you monitor.
Conclusion
The IEEE 1159 is basically a recommended guideline that provides the user with a consistent set of terms, definitions and practices for describing power quality phenomena. The focus of this white paper was on the IEEE 1159 definitions. Understanding the definitions is the first step in understanding, and proper implementation of these guidelines allows the operator to make useful measurements of power quality related phenomena. This includes the appropriate techniques along with the monitoring location for a given measurement, enhancing the value of the data collected for useful analysis of power quality issues. The IEEE 1159 also keeps everyone on the same page, including the equipment manufacture, the vendors that market’s the equipment and the end user. On top of IEEE 1159 specifying the practices to obtain the most accurate measurements possible, it does it in such a way to allow the measurements to be made as safely as possible. The IEEE 1159’s table of contents covers 8 distinct power quality topics, and in future white papers we will cover more of them.
