Abstract
Power Factor (PF) is a measure of the efficiency of electric power delivery to a load. Traditionally the phase shift from inductive loads was the major cause of poor PF and was straightforward to correct. Today’s harmonic loads create even worse power factor, and the correction is much more difficult. Here an overview of how harmonics affect power factor is given, and how this mechanism differs from the traditional problems with inductive loads.
Power Factor Definition
Power Factor (PF) is defined as the ratio of Watts (W) to Volt-Amps (VA):
Interpreting this as a measure of efficiency, the expression compares the amount of power delivered to a load (W) to the amount of power burden presented seen by the distribution system (VA). Volt-Amps is simply the product of the RMS voltage and RMS current:
and is representative of the “apparent” load supported by the system, regardless of the billable power delivered to a customer. In the VA computation, line voltage and load current are equally a factor, but in reality the line voltage can be assumed to be roughly constant. This leaves the load current as the most important parameter. Variation in the current phase angle will not affect the RMS value, but can have a large impact on the Watts portion of the PF expression. How the current phase and waveshape affects real power is the key to understanding the difference between inductive and harmonic load effects on efficiency.
Real Power
Real power at any instant in time t is the product of the voltage and current at that instant:
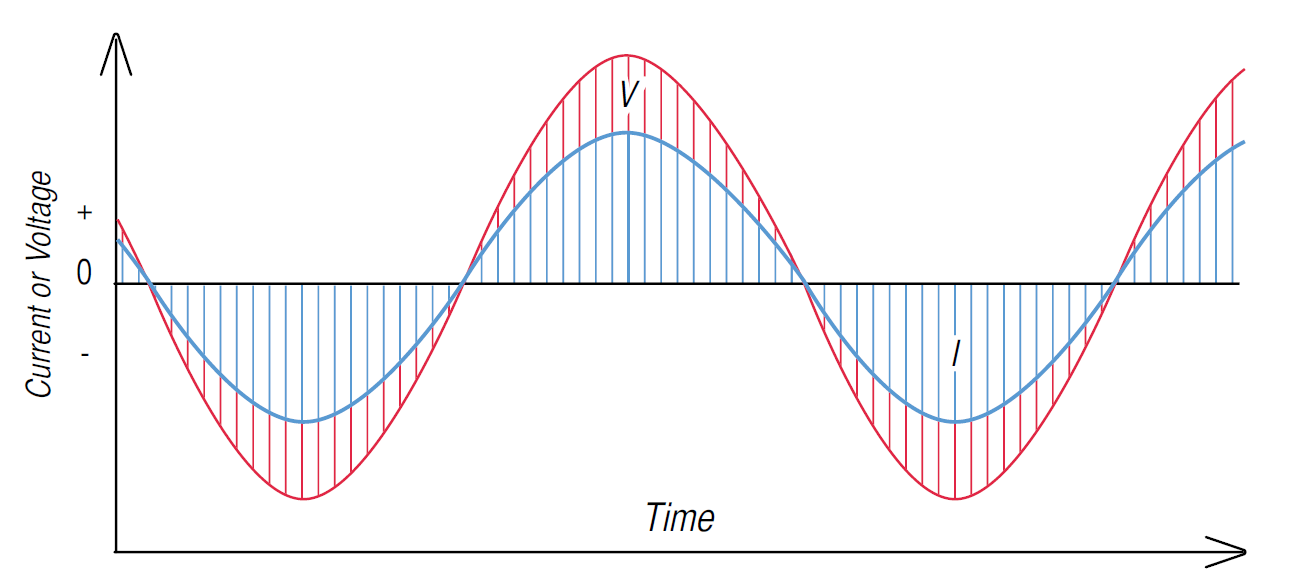
Energy delivered to a load is the integration of the real power over time. The convention here is that positive power is transferred from the source (utility grid) to the load (utility customer), and negative power is returned from the load back to the utility. The continuously varying AC voltage results in a continuously varying real power, but the periodic nature of the waveform from the 60 Hz driving frequency presents a natural averaging period to compute single real power quantity, much like the RMS measurement. For a resistive load, the current follows Ohm’s law, and thus the current waveform shape mirrors the voltage exactly. Figure 1 shows the sine waves for voltage and current in this situation. The instantaneous real power is the product of the two sine values at any instant in time; the plot of the real power waveform is shown in Figure 1. Two items to note:
- Even though the voltage and current sine waves are sometimes negative, the real power is never negative — since the voltage and current sine waves are exactly in phase, each is either positive or negative at the same instant. This means their product is always positive
- The real power varies between zero and a peak; the average power over the cycle is exactly 1/2 the peak value
Power Factor with Undistorted Waveforms
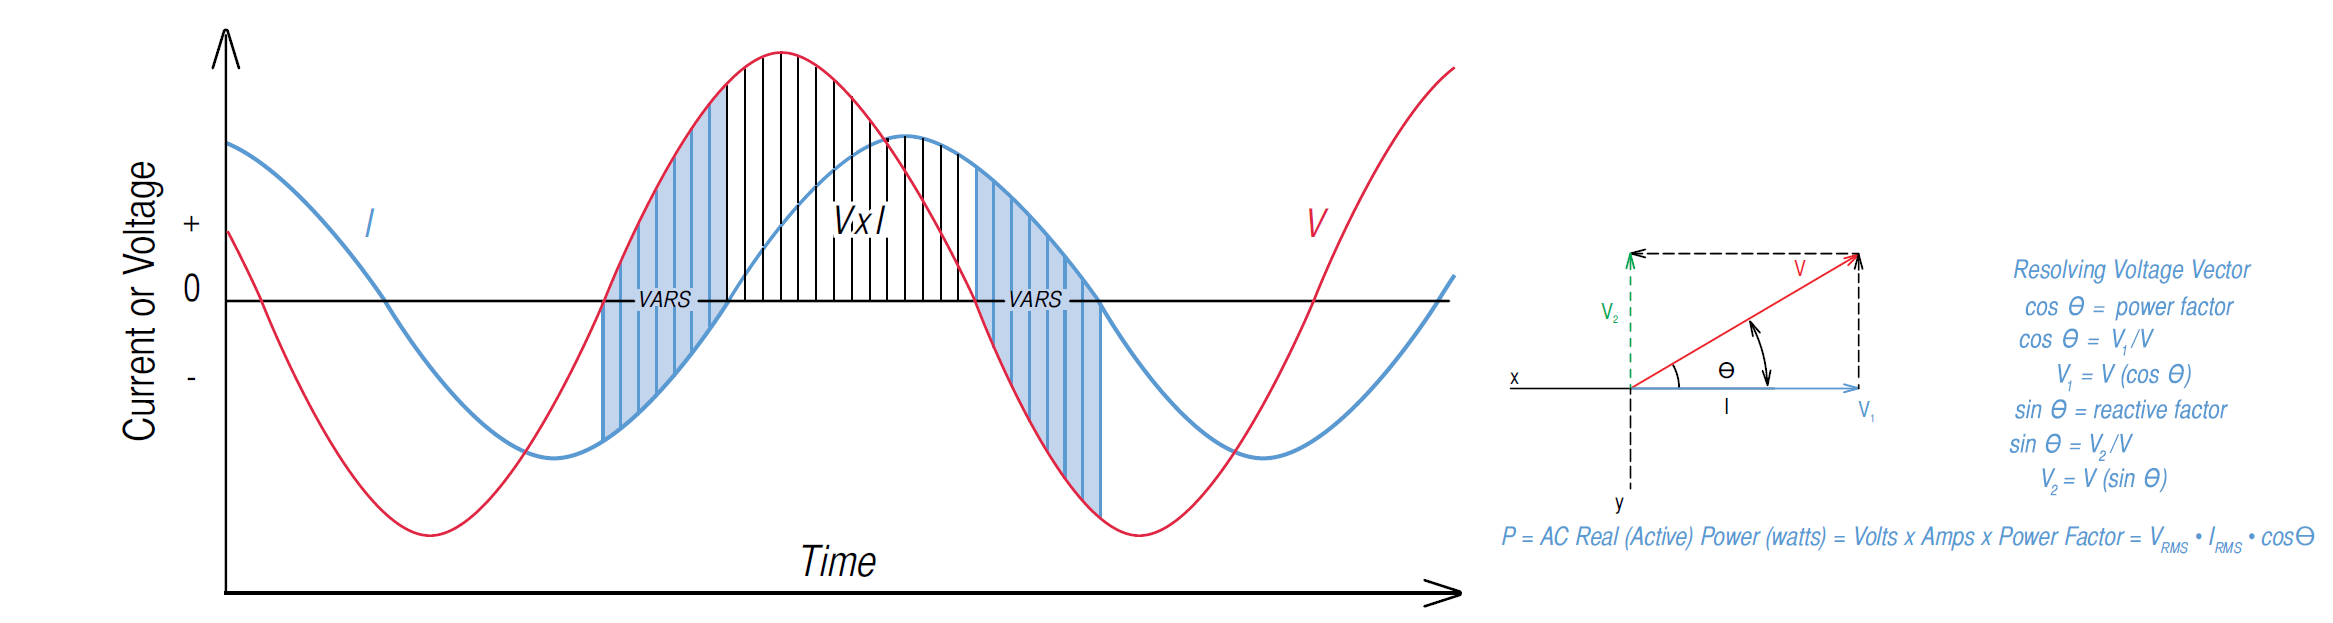
An inductive load will shift the current waveform with respect to the voltage (Figure 2). With the current sine wave shifted in time from the voltage, there are now portions where the instantaneous V×I product is negative (shaded in blue). Current flow during this time doesn’t contribute to delivering real power to load, yet it is still carried by the system as reactive power (Volt-Amp-Reactive, or VARs). A physical interpretation of this reactive power is energy that is delivered to a reactive load (e.g. an inductive motor), then returned back to the utility each cycle. Transferring this energy back and forth each cycle accomplishes no work, but adds to the system inefficiency through resistive losses and heating from extra current.
The precise relationship between real, reactive, and apparent power and the phase angle is described by the familiar phasor diagram and equations in Figure 2. For pure sine waves, PF = cosθ. With zero phase angle, PF = 1.00, and all current contributes optimally to delivering real power (W=VA). With a 90 degree phase angle, no current delivers net power, (W=0), and a 180 degree phase angle results in negative power (W= -VA).
Power Factor with Distorted Waveforms
Traditional low power factor from inductive loads is relatively straightforward to correct — simply shift the current back in phase with the voltage by adding capacitance to cancel out the inductance. With harmonic currents, the situation is more difficult to correct because the root cause is not a simple phase shift.
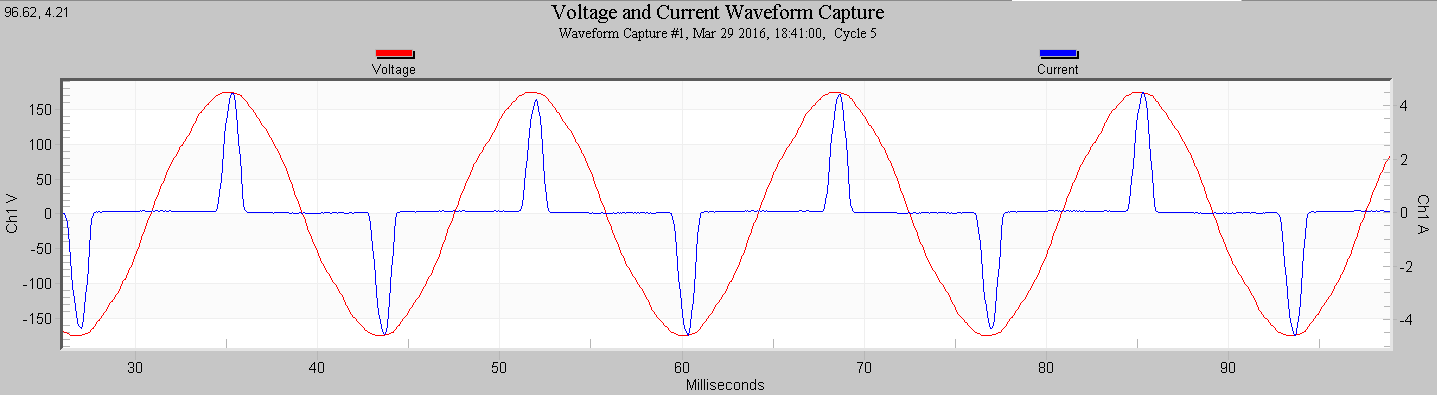
Consider the single-phase nonlinear load shown in Figure 3. This is a typical electronic switch mode power supply waveform. The current is drawn in very narrow pulses near the peaks of the voltage waveform. Here are the details for a typical cycle in Figure 3:
| RMS Voltage | 122.7 V |
| RMS Current | 1.33 A |
| Real Power | 86 W |
| Reactive Power | 2 VAR |
| Apparent Power | 162 VA |
| Power Factor | 0.531 |
| Displacement PF | 1.000 |
| Phase Angle | -2° |
| V THD | 2.2% |
| I THD | 155.7% |
The current THD is very high, at over 150% relative to the fundamental. The PF is very low at 0.531, yet the phase angle is just -2 degrees — very little phase shift. The current peaks are almost exactly at the peak of the voltage waveform, where the V×I product is a maximum for a given current level. Most electronic power supplies are constant-power — a decrease in voltage causes an increase in current to maintain a certain desired power output. Consequently, shifting the current left or right would place the current spike at a lower voltage point on the sine wave, with a corresponding increase in current to get the same V×I product (i.e. power). Increasing the current for the same power adds to system inefficiency — more resistive losses, etc.
Notice that the traditional relation that the equation VA = √(W² + VAR²) doesn’t hold here. Harmonics are contributing to the VA product, so it’s larger than the combination of real power and VARs would suggest. In this example, real power = 86 W, reactive power is just 2 VAR, and apparent power is 162 VA. The distribution system is burdened by 162 VA, yet just 86 W of power is delivered, and the current is already ideally positioned in terms of phase shift.
If the current is already at the optimal phase shift, what’s contributing to the poor power factor? The answer is harmonic currents. Mathematically, it can be shown that no power can be delivered by the product of a 60 Hz fundamental and a harmonic current sine wave. For example, Figure 4 shows a pure 60 Hz sine wave (red) with a pure 5th harmonic (300 Hz) current waveform (blue). The V×I product is plotted in bold green. There are portions above zero (positive power) and below zero (negative power), and the net over an entire cycle is zero. Changing the phase shift of the current changes the real power waveform shape, but the net power over an entire cycle is always zero. Sine waves at different periods are orthogonal functions, and this property is actually essential for their use in the Fourier transform used to decompose a complex waveform into harmonics.
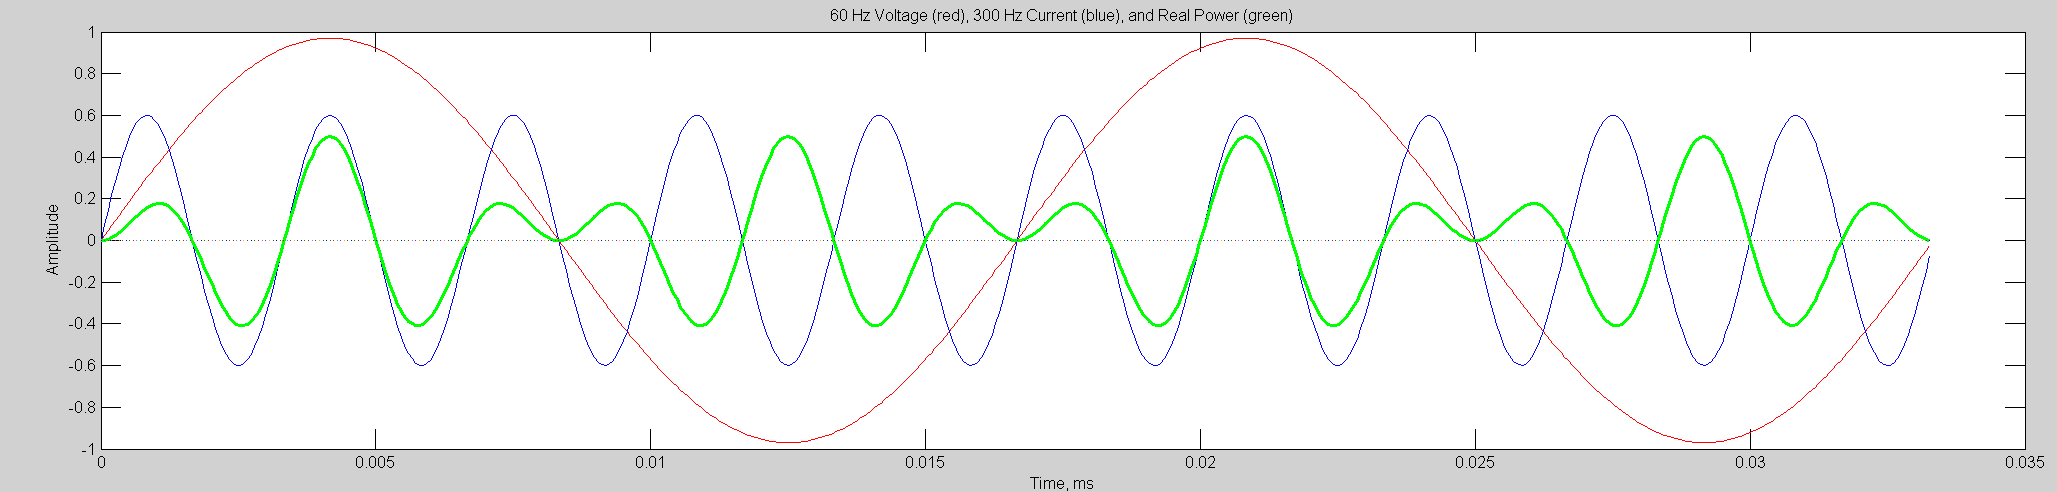
Due to this property, only voltage and current sine waves at the same frequency can produce real power. In theory, if there is voltage content at the 5th harmonic, then current at the 5th harmonic could deliver some amount of power in addition to the 60 Hz portion. Voltage THD is usually very low (under 5%) compared to the current, thus voltage harmonics are not a significant contributor towards overall power, regardless of the magnitude of the corresponding current harmonic at the same frequency. Consequently, harmonic currents in general do not contribute to the “W” portion of the PF expression.
As described in the white paper Understanding RMS Measurements, each harmonic magnitude contributes to the RMS value. From that paper:
where x[n] is the nth point from a raw voltage or current waveform of N samples, and X[k] is the kth harmonic magnitude of that waveform.
This equation illustrates that each harmonic contributes its magnitude equally to the RMS total. Apparent power is the product of the RMS voltage and RMS current, and thus each current harmonic increases the VA value as well. Consequently, harmonic currents do contribute to the “VA” portion of the PF expression. Additionally, the harmonic phase angles are not present in the above equation, and have no effect on the overall RMS value.
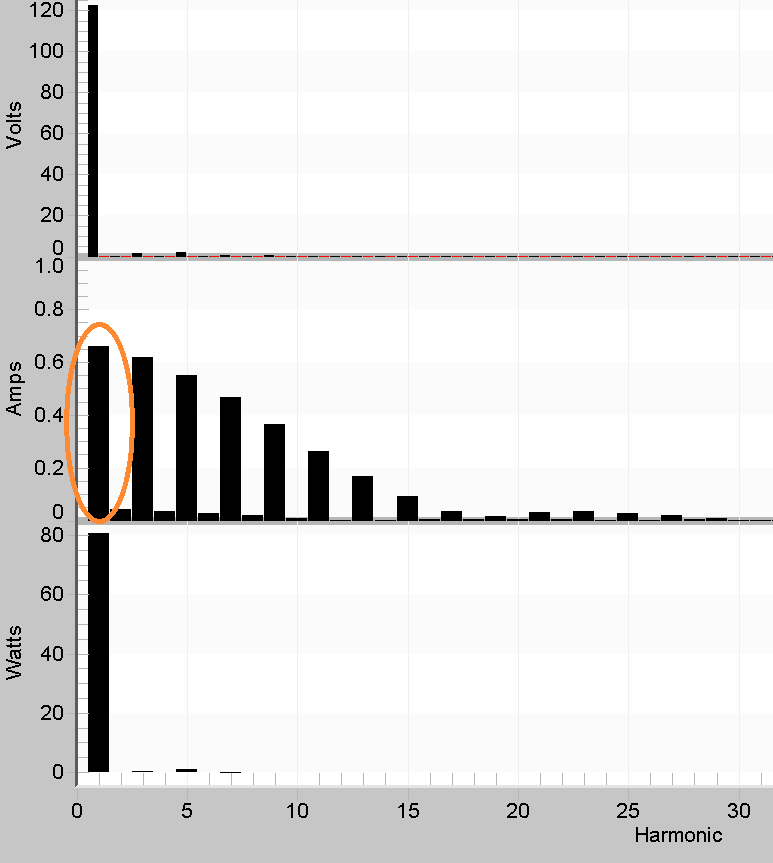
In Figure 5, the harmonic decomposition of the voltage, current, and power is shown. The top bar chart shows that the voltage is relatively undistorted. The fundamental is 122V, representing most of the RMS value. Small 3rd and 5th harmonic values can just be seen. The current shows severe distortion. The fundamental amplitude is 0.66A (circled in orange), with the 3rd almost as large at 0.62A. The odd harmonics up to the 15th are all significant. The harmonic power is shown on the bottom plot. The power at the fundamental is 81W, nearly the entire consumption, with 1 W at the 5th harmonic.
The RMS current of 1.33A is comprised of all those current harmonics, but only the 0.66A of fundamental current is contributing any real power. The addition of harmonics is roughly doubling the RMS current, and thus the apparent power (VA). Since the real power is unaffected, the power factor is halved (reflected in the 0.531 reading).
As shown above, harmonic currents have no effect on the numerator of the PF expression, but can only increase the denominator. The result is that harmonics decrease the power factor, but differently than phase shifts from reactive loads. The physical interpretation of the harmonic contribution to poor power factor is that harmonic currents present a burden to the system, but deliver little or no power, either real or reactive. Changing the phase angle between voltage and current has no effect on this contributor to low power factor. Unlike the reactive 60 Hz case, where a phase angle shift affects real power, in the harmonic case there is no real power contribution to be affected.
Mixed Loads
It’s also possible for both reactive and nonlinear loads to reduce the power factor in combination. In a complex case with mixed loads, it’s necessary to separate the 60 Hz phase shift portion of the power factor from the harmonic contribution. The displacement power factor (DPF), defined as the cosine of the phase angle between the fundamental (1st harmonic) of voltage and current, provides the 60 Hz portion. In the above nonlinear case, the DPF was 1.00, reflecting the fact that the current spike was already positioned ideally at the peak of the waveform. In the mixed case, the PF and DPF may be low, but will still have different values. Power factor correction capacitors may be used to correct the DPF back to unity. This will leave the harmonic contributors to poor power factor as reflected in the PF reading. If further reduction is needed, the harmonic currents must be reduced with a tuned filter. Unfortunately, adding PF correction capacitors could increase the level of harmonics due to resonances with inductive loads. It’s important to measure the harmonic levels before and after installing correction capacitors to verify that harmonic levels are reasonable. Tuned filters or other harmonic mitigation techniques may be used to reduce the nonlinear current.
Conclusion
An understanding of how traditional inductive and modern nonlinear loads reduce power factor is essential for taking the correct steps to reduce system losses. Inductive loads create a phase shift in current, which decreases real power for the same apparent power. This may be mitigated with correction capacitors to shift the current back. Nonlinear loads don’t reduce real power, rather they increase the apparent power presented to the system. This mechanism is not affected by phase shifts, and harmonic filters may be needed to improve the power factor.
