Abstract
Harmonic power is a complex and often misunderstood topic. This leads to misinterpretations, including using a harmonic power analysis when the measurements aren’t physically meaningful. An overview of harmonic power is provided here, along with guidelines for when to use these measurements, and when not to.
AC Power Review
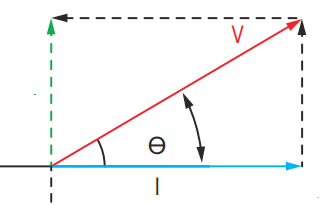
Before discussing harmonic power, it’s helpful to review the simpler case of pure 60 Hz AC power. The familiar power triangle with real, reactive, and apparent power gives the relationships:
Real power = W = VI cos Θ
Reactive power = VAR = VI sin Θ
Apparent power = VA = VI
Where V and I are the RMS magnitudes of the sine waveforms of voltage and current, and Θ is the phase angle between them (see Figure 1). These equations hold true for any sinusoidal voltage and current frequency, not just 60 Hz. Since harmonics are simply sine waves at multiples of the fundamental (60 Hz) frequency, the equations also work for an individual harmonic signal.
Harmonic Power
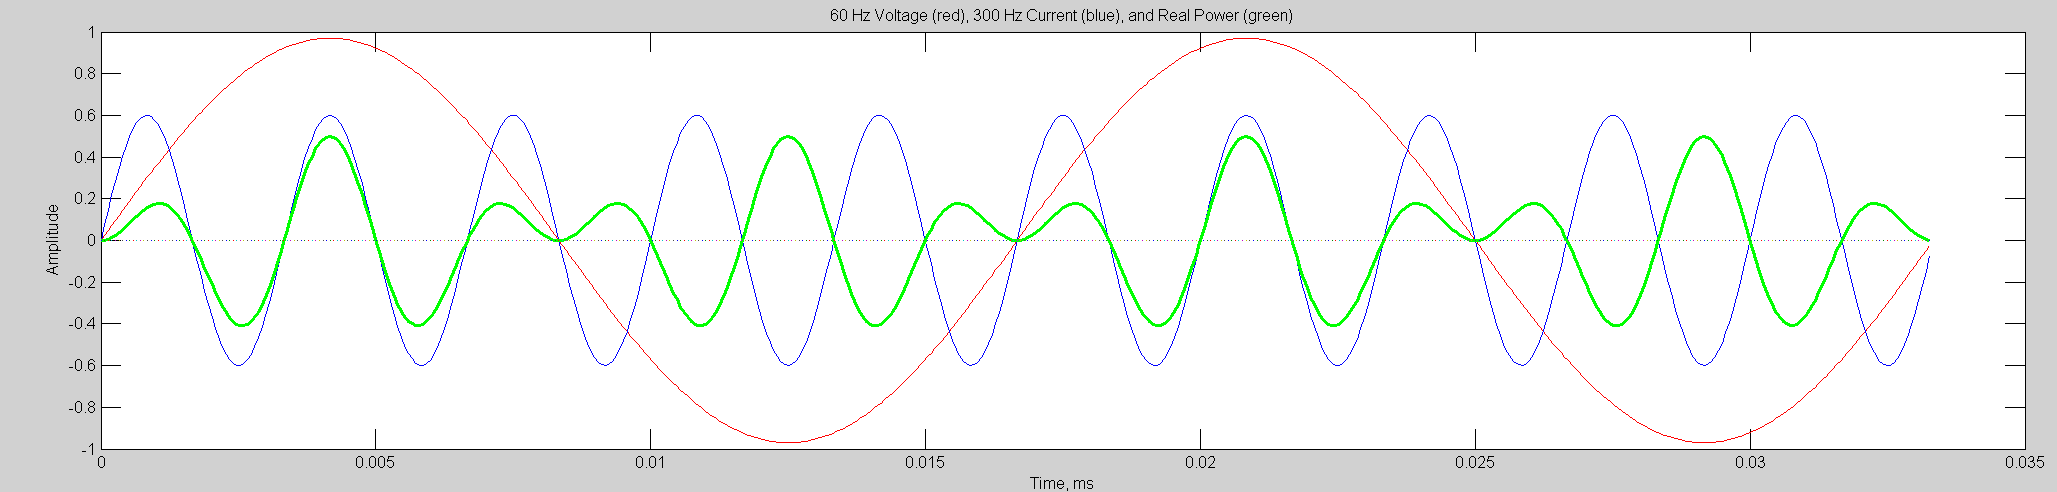
Harmonics have another mathematical property that makes these power equations even more applicable, which are known as orthogonal functions. This property is key to the math behind the harmonic analysis, and essentially this means that they can be analyzed independently. One result is that only pairs of voltage and current sine waves at the same frequency can produce non-zero real power. For example, if there is harmonic current at the 5th harmonic (300 Hz), there is no mathematical way for that current to contribute real power unless there is also 5th harmonic voltage present. Any non-5th harmonic voltage multiplied with the 5th harmonic current will generate instantaneous real power which will cancel out later in time. Figure 2 shows an example of 60 Hz voltage (1st harmonic), with 5th harmonic current. The instantaneous real power (green) is the product of the two waveforms. This real power waveform has equal parts above zero and below zero – net real power is zero. Unless the voltage and current sine waves are at the same frequency, there can be no net real power. This is a direct result of the orthogonality of sine waves, and allows the simple real power expression for sine waves to be applied separately to each set of harmonic voltages and currents pairs.
Consequently, each set of voltage and current harmonic sine waves has its own power triangle, just like Figure 1, with its own real, reactive, and apparent power. The total power is simply the sum of the harmonic powers. If a specific harmonic power is positive, it adds to the total; if it’s negative, it reduces the total power.
It’s important to note that the voltage waveform must be sufficiently distorted to result in harmonic power. If the current is distorted but the network is stiff enough that the voltage distortion is low, the net harmonic power will be low. It’s possible for voltage and current THD to both be elevated, but with no harmonic power if the elevated harmonics are different for voltage and current.
Viewing Harmonic Power
Harmonic power is most easily viewed in ProVision using captured waveforms. Choose Graph, Harmonic Analysis, Magnitudes, and select a waveform capture to analyze. This will launch an interactive graph that shows a “mini waveform” at the top, and harmonic bar charts below (see Figure 3). Use the mouse to drag the grey rectangle in the mini waveform to select a cycle for analysis. For harmonic power studies, choose a steady-state “normal” waveform, not a disturbance. ProVision computes the voltage, current, and power harmonics and plots them as bar charts.
Typically the 60 Hz power is much larger than any harmonic power. Turn off the fundamental bars by right-clicking the graph and unchecking “Show Fundamental.” This will autoscale the graphs so that the harmonic powers are more easily seen (as in Figure 3).
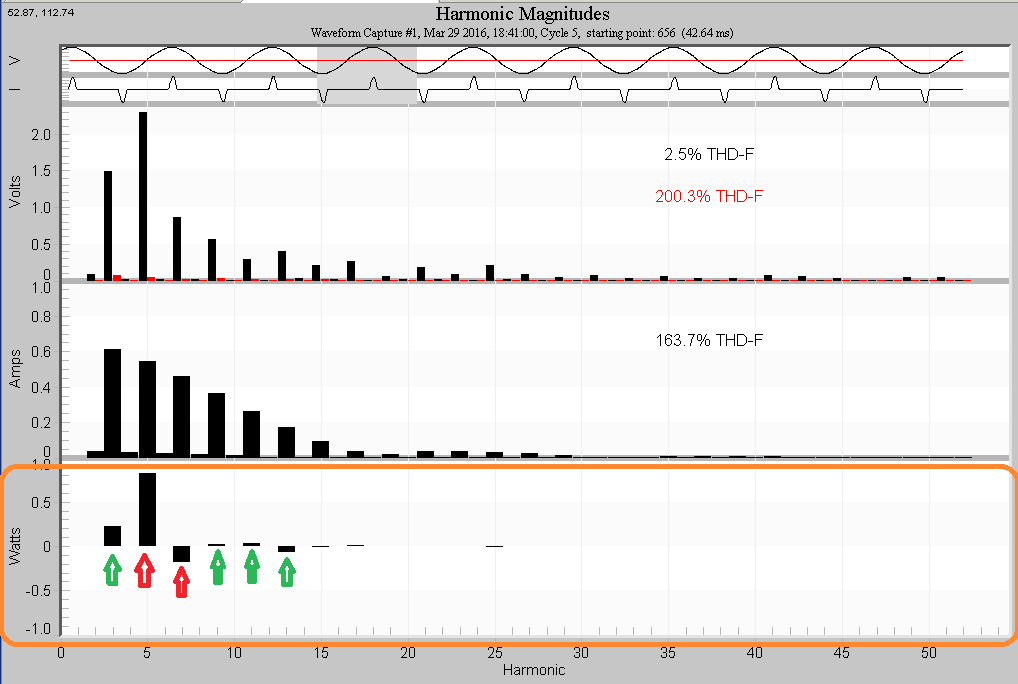
The three bar plots are harmonic voltage (top), current (middle), and real power (bottom). The units are absolute volts, amps, and watts. The real power plot is circled in orange. Here the 3rd, 5th, 9th, and 11th harmonics have positive power, and the 7th and 13th have negative power (marked with green and red arrows, respectively). If the power bar is rising above zero, it’s positive; if it goes below zero, it’s negative.
A text-based report with all values given in tabular format is also available. Right-click the graph and choose “Launch Report” to show each value numerically.
Harmonic Power Direction
One common use for harmonic power analysis is to track down the source of harmonic currents. The thinking is that the harmonic power flow direction (positive or negative) will indicate the direction of the harmonic source (upstream or downstream of the monitoring point). The difficulty with this method is the highly reactive nature of the distribution network and other loads at higher frequencies. The 60 Hz impedance of the power line is relatively low and mostly resistive, since the power factor is actively managed and it’s designed to deliver power at 60 Hz efficiently. As the frequency increases the impedance changes radically. It can also change radically based on the particular loads on the circuit. Differing impedances introduce different phase shifts between voltage and current at different harmonics; these phase shifts may be unrelated to the actual load drawing harmonic current. Consequently, the measured harmonic power direction is a complex mix of load and system characteristics and is often not useful for indicating harmonic load direction.
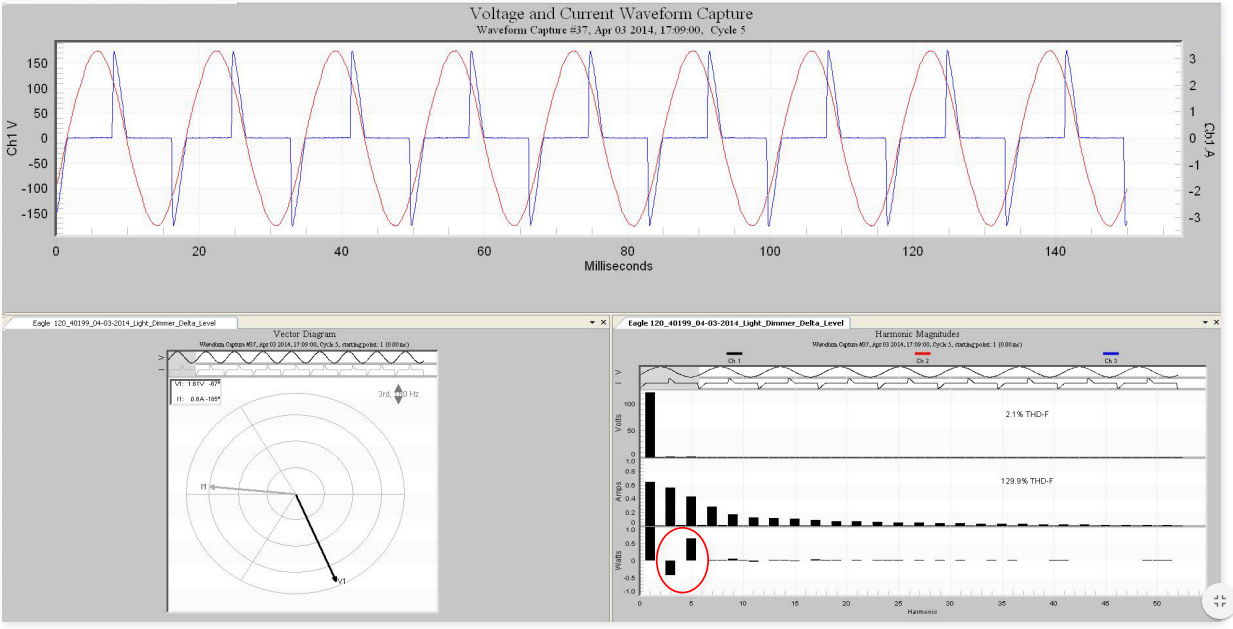
Figure 4 gives an example of a single non-linear load. The top plot is the voltage and current waveform, here with a mostly clean voltage waveform, but very distorted current. The harmonic bar chart shows negative 3rd harmonic power, but positive 5th harmonic power (circled in red). The other voltage harmonics are too small to result in measureable harmonic power. The contradictory harmonic power directions from the 3rd and 5th make this a useless indicator of harmonic source. Examining voltage and current THD is usually a better method to track down harmonic sources.
Harmonic Power Problems
Some loads can be affected by high harmonic power levels regardless of direction. Direct-drive motors driven by distorted voltage waveforms will draw harmonic current. The resulting harmonic power can contribute to motor or shaft vibration/oscillation, and counter-torque that opposes the desired rotation direction. A Variable Frequency Drive can help isolate a motor from the incoming voltage distortion. The VFD rectifies the incoming AC into DC, then synthesizes its own motor drive waveform.
Increased heating is the main effect of harmonic currents on transformers. Here the harmonic power is dissipated as heat by the transformer. The harmonic voltages that contribute to the transformer heating are the voltages dropped across the transformer windings due to increased impedance at higher frequencies.
High harmonic currents with low harmonic power levels indicate a stiff, low impedance voltage source. The voltage THD is likely low, and in this case customers downstream are probably not affected. If the voltage and current THDs are high while harmonic power is low, then the pattern of voltage and current harmonics must differ enough that there is little harmonic power – e.g. high voltage 3rd and 5th harmonics, but high current 7th and 9th harmonics. This is an unusual case, indicating multiple sources of harmonics upstream and downstream.
If the harmonic power is high, voltage and current waveforms are both distorted. Harmonic power is being absorbed into loads or injected into the distribution system. Sensitive loads such as direct-drive motors may be absorbing harmonic power, contributing to vibration or reduced torque.
Conclusion
High harmonic power levels can indicate the presence of nonlinear loads, high THD on voltage, and the possibility of equipment problems. Although harmonic power direction often isn’t a good indicator for tracking the source of harmonic generators, the power level itself can help determine if loads are being adversely affected by harmonics, especially electromechanical loads directly connected to the AC line. Low harmonic power levels coupled with high voltage and current THD indicate a complex situation with multiple sources, some upstream, and some downstream of the monitoring point.
