Abstract
Crest factor is an often neglected power compatibility measurement, but can be very important in certain applications. This white paper presents the definition of crest factor and the method for calculation. Some of the consequences of a high crest factor ratio will be discussed along with an example.
Crest Factor Defined
Crest Factor is defined as the ratio between the peak current Ipeak and the RMS current IRMS. Crest Factor is, therefore, calculated by taking the peak of the instantaneous current in a cycle and dividing it by the RMS current for that cycle:
Note that the peak current could occur in a positive or negative half cycle. The magnitude of the peak should be used, without regard to the polarity. Strictly speaking, the RMS value and peak value should both be taken from the same 60 Hz cycle.
Theoretically, with a clean 60 Hz sine wave, the ratio will equal 1.414 (√2). A square wave or DC signal, which has a constant peak value in each polarity, has a crest factor of 1.0. The higher the crest factor, the more “peaky” a waveform is, relative to its RMS value. High values indicate that current is mostly drawn in a very narrow time window during the 60 Hz cycle. Low values correspond to current drawn smoothly during the waveform, with a benign resistive load duplicating the voltage crest factor. The crest factor cannot take on a value below 1.0, which represents a flat waveform shape.
What Does Crest Factor Show Us
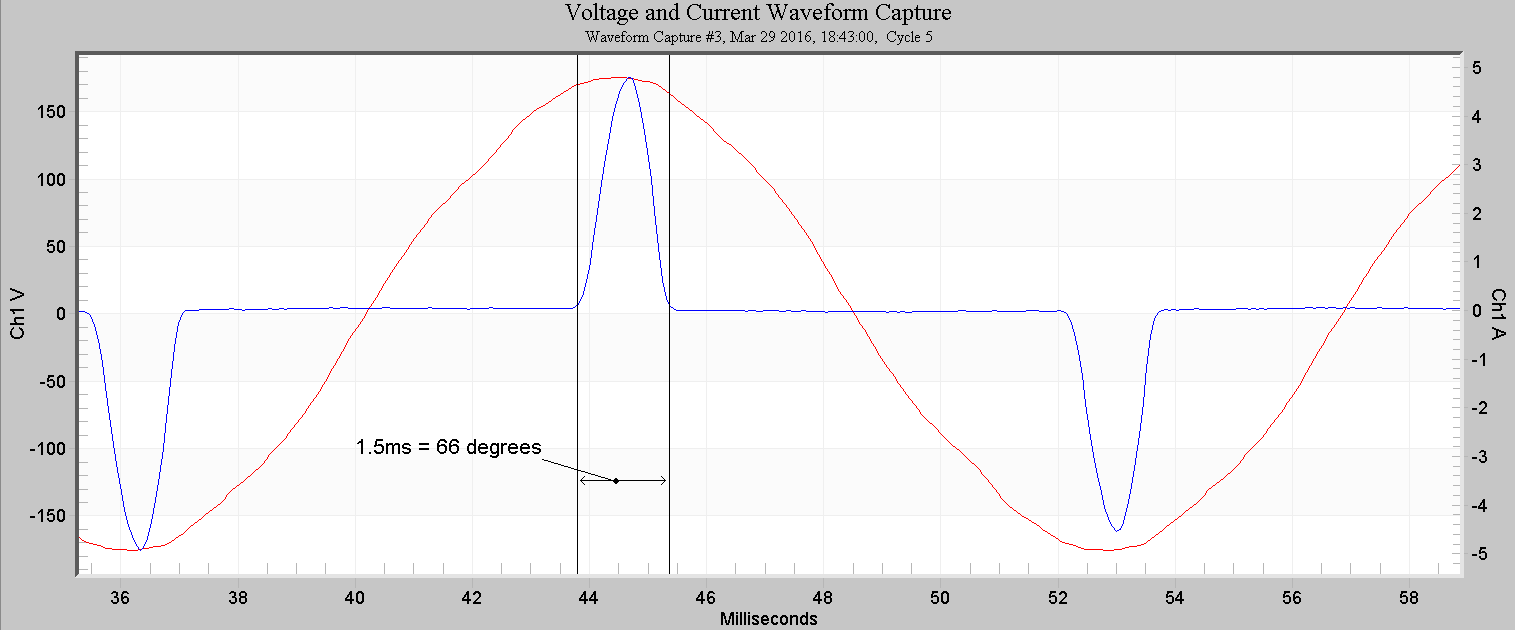
As mentioned above, a high crest factor indicates a deviation from a sine wave shape. It more specifically measures distortion where most current is conducted during a small window of time during the 60 Hz cycle. Many electronic power supplies, variable frequency drives, and other loads that rectify the AC voltage use diode inputs which only conduct current during the peaks of the AC waveform. This narrow time span is referred to as the “conduction angle”, where the start and stop conduction points are measured in terms of phase angle points in the voltage sine wave. A narrow conduction angle results in a high crest factor. Although in theory a load with a high crest factor could draw its narrow current pulse anywhere in the 60 Hz voltage waveform, in reality most electronic loads use a similar rectifier topology. This results in most loads drawing peak current at the same point each cycle, increasing the aggregate crest factor presented to a transformer supplying power to many loads. Figure 1 shows a typical high crest factor electronic load. The entire load current is drawn in two 1.5 ms bursts near the positive and negative peaks of the voltage waveform. This represents a 66 degree total conduction window.
Crest Factor Rating
A high crest factor presents a challenging load for some AC power sources. Electronic AC inverters, where the voltage waveform is synthesized and produced with electronic switching devices instead of a rotating generator, usually have absolute peak current ratings. This peak current rating is a function of the switching device’s limit and is often independent of other limitations (such as maximum continuous power). Instead of sagging gracefully like a transformer or rotating generator might under peak overload conditions, exceeding the instantaneous peak current of an inverter may cause it to shut down.
As mentioned above, most UPS manufacturers will supply a crest factor rating indicating the maximum crest factor that the UPS can tolerate. Uninterrupted power supplies, however, are not the only products that make use of crest factor ratings and measurements. Essentially any synthetic AC source will have a defined crest factor limit. Generators, solar inverters and the like all have crest factor limitations and their manufacturers should provide a maximum crest factor rating as well. This rating is separate from the maximum RMS current or power rating. Derating may be needed if the load’s crest factor is too high for the supply.
Loads that are commonly powered from inverters may have a crest factor specified. One example would be a personal computer. The typical crest factor for a personal computer (PC) is about 3, which happens to be a common crest factor rating for UPS devices.
Crest Factor vs THD
Crest factor is a result of peak current measurements and not of direct harmonic measurements. This means that, while harmonics will indirectly influence the peak current value (and thus the crest factor value), the individual harmonic components themselves are not used to compute the crest factor value. What we see is that the crest factor ratio will start to increase with the introduction of harmonic frequencies into the waveform. In essence, then, the crest factor ratio provides us with an indicator of the presence of harmonics, but is not directly related to specific harmonic content.
There is no direct relationship between crest factor and total harmonic distortion (THD). The specific phase angles and magnitudes of each harmonic determine the specific waveform shape. Consequently, two waveforms with identical THD could have different crest factors, and a high THD waveform could even have a low crest factor (for example, a square wave).
This is essentially why the crest factor is used instead of THD in certain situations. Although both are measurements of waveform distortion, crest factor is directly related to the “peakiness” of a waveform, while THD is more related to overall waveform distortion in any manner.
Measuring Crest Factor (A Practical Example)
Measuring crest factor is not at all difficult. To begin, identify the load to test – in this particular example, it will be a personal computer. The author has chosen to use an Eagle 120 since it is capable of measuring voltage, current and power and allows a load to be plugged into it for direct measurement.
Measuring crest factor requires raw waveform data. In this example, periodic waveform capture is used to ensure that a representative steady-state waveform is present in the recording.
The next step is to connect the Eagle 120 to the user’s PC and download the resulting recording. Double-click on the newly downloaded recording to load the header report. From here, the user can move to waveform capture and select a waveform to view. Select the first waveform from the waveform selection list and view it.
Press ‘T’ to toggle the “Point Table” which will display a legend next to the graph that shows the exact value over which the mouse is currently hovering. Move to the highest (or lowest) value at either the positive or negative peak of the load’s current waveform. Note the instantaneous value in the table. If the RMS value is very steady, it can be read from the RMS current stripchart graph. Alternatively, the RMS Capture graph can be used to display the RMS value of the very same cycle used in the peak reading. Next, take the instantaneous value and divide it by the RMS value that is reported by ProVision. This is your crest factor measurement.
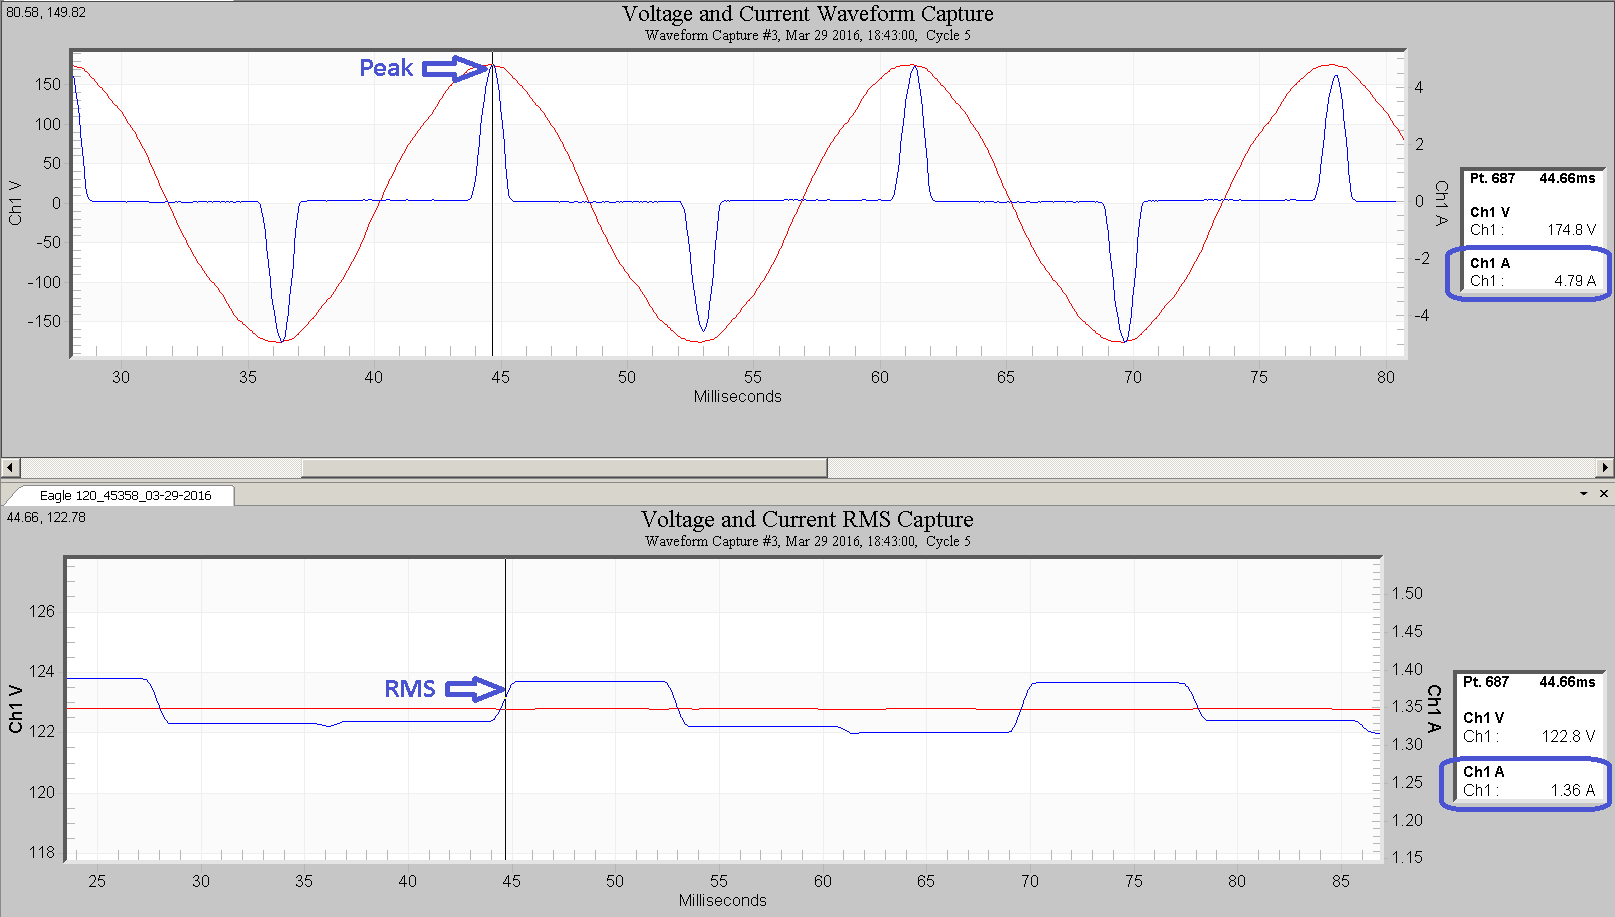
Figure 2 shows an example of the latter method. The raw waveform is shown in the top plot, with the vertical marker at the peak. The value in the point table to the right (circled in blue) is 4.79 amps. The RMS capture graph of the same waveform is shown in the bottom plot. In this plot ProVision has computed a continuous RMS graph. The vertical line is placed at the same point as the peak graph (44.66 ms), and the RMS value in the point table on the right (circled in blue) is 1.36 amps. The crest factor is 4.79/1.36 = 3.52. This high value may exceed the rating of many UPS sources.
Conclusion
Crest Factor is a very quick and simple measurement that can be used to determine the compatibility of a load that will be powered from a synthetic AC source such as an inverter or UPS. A combination of a PMI recorder and ProVision can be used to determine this factor and verify the solar inverter, generator, UPS or other synthetic AC source’s capacity to handle the measured load appropriately.
