Abstract
The simplest waveform capture triggering is based on RMS voltage or current changes. While sufficient for voltage sags, recloser operations, etc., more complex events such as cap bank switches, narrow voltage notches, and other waveshape distortions call for a more advanced trigger. The THD-based waveshape trigger, available in the Revolution and cell Guardian PQ recorders, provides this mechanism and is described here.
Waveshape Trigger Logic and Settings
All PMI waveform capture triggers operate on the same principle: a quantity is compared from one power line cycle to the next. If the reading changes by more than a threshold, a waveform capture is triggered. In simpler cases the RMS voltage or current is the quantity that’s compared. Here the voltage THD is used, with the goal of capturing “important” events that may not affect the RMS value itself.
As described in Understanding Total Harmonic Distortion, THD is a measurement of the deviation from an ideal sine wave, measured as a percentage. A value of 0% indicates a perfect sine wave; anything larger is “distorted”. Harmonics, and thus THD, are normally considered steady-state phenomena on the timescale of seconds or minutes at least — by definition, harmonics are distortions that repeat in the same fashion in every powerline cycle. For a specific aggregate harmonic load, the resulting voltage THD is generally unchanging while there are no changes in load or the system impedance itself. Here the THD isn’t used as a direct harmonic measurement, but as an indicator of a change.
A change in voltage THD indicates a change in the system or load. An abrupt THD movement, either up or down, from one cycle to the next must be a result of a significant change in the waveform shape. The fact that the THD is based on distortion of harmonically related sine waves is secondary here — more important is that a change in THD always indicates a change in waveform shape of some sort. The specific THD values (THD before the event, and the THD on the triggering cycle) are also not necessarily meaningful themselves. The triggering THD especially should not be interpreted as a real, steady-state harmonic distortion measure (e.g. as per IEEE 519 limits). A cap bank switch or other transient disturbance is a short-term event that isn’t well characterized by harmonics, so the THD per se isn’t useful here. Rather, it’s the change in THD that indicates an interesting event, and thus triggers a waveform. The waveform capture itself contains the information to be analyzed.
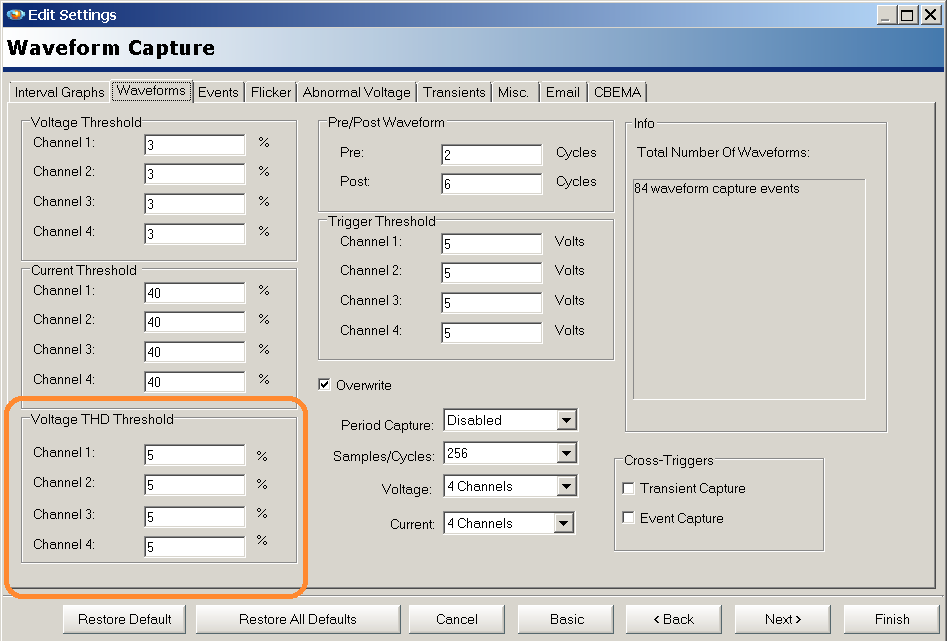
The THD thresholds are available in the Waveform Capture setup form in ProVision (Figure 1). Each channel has a separate THD threshold, defaulting to 5%. The THD, in percent, must increase or decrease by at least this amount from one cycle to the next for a capture to be triggered. The value can set with 0.1% resolution. For example, with a 2.5% threshold, if the voltage THD changes up or down by at least 2.5%, the trigger condition is met. If any channel triggers, the waveform capture is triggered for all channels. The number of active channels may be set in the waveform capture form if all are not needed.
The traditional waveform capture triggers work in parallel with the THD trigger. RMS voltage and current changes, periodic capture, and cross-triggering from other data types can all trigger a waveform capture. The waveform capture report helps separate and classify these captures.
Analyzing the Results
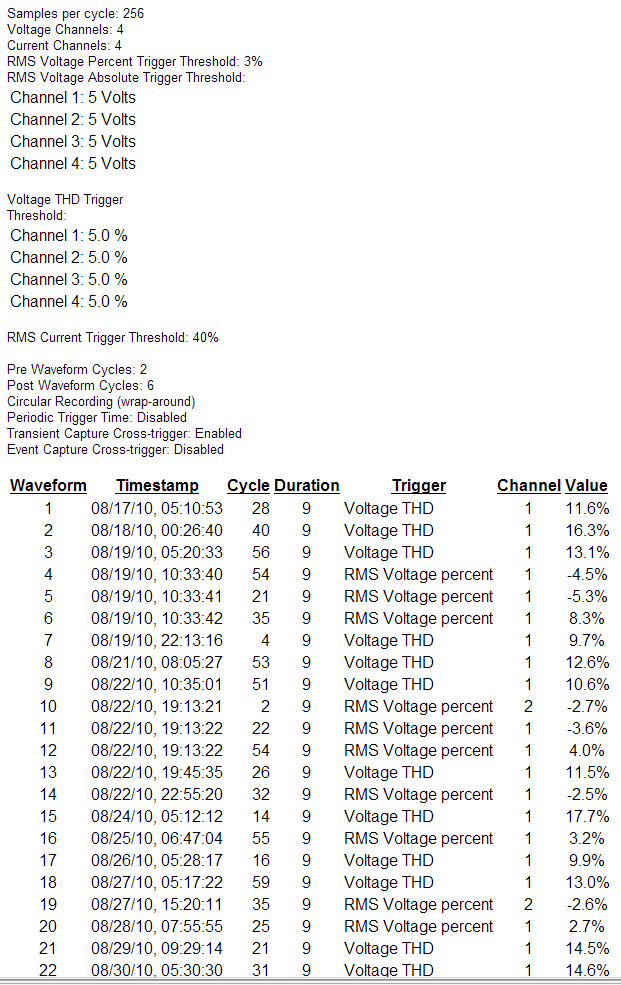
Captured waveforms are available from the header report by clicking on the line that lists the number of captures (e.g. “Waveform Capture: 8 events”). They’re also available directly from the ProVision menu under Graph, Waveform Capture. The waveform capture report is also useful for separating THD-triggered captures from others. An example is seen in Figure 2, where a mix of THD and RMS voltage triggered captures have been recorded. The RMS voltage captures are likely voltage sags, while the THD captures are more likely oscillatory transients such as cap bank ringing.
Note that despite the THD-based trigger, the result isn’t analyzed using the THD value, or necessarily with harmonics at all. Even with an oscillatory transient composed of a ring frequency, the THD during the event often isn’t important. The whitepaper Steady-State vs. Transient Harmonics goes into detail on using a harmonic analysis for a captured event, and how those differ from steady state harmonics.
Examples and Recommendations
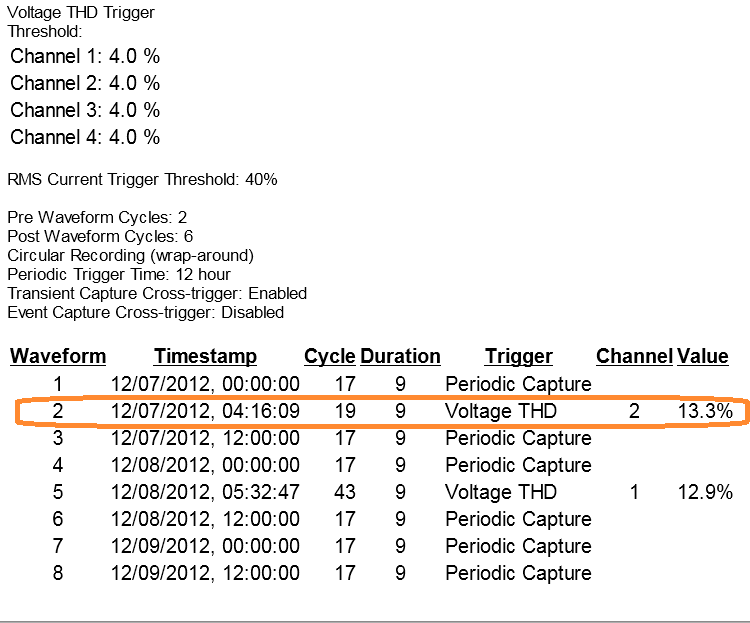
A good example of the THD triggering ability is shown in Figures 3 and 4. Figure 3 shows a capture with a 13.3% THD change (trigger was set at 4%). This means the THD changed by 13.3% from one cycle to the very next, indicating a significant change in waveform shape. The event itself is graphed in Figure 4. This oscillatory transient is likely an upstream switch operation. The ringing only lasted about one cycle, and by the end of the capture the THD is back to the former steady state value. Here the THD isn’t a measure of the harmonics in the event, but rather a marker that a waveform capture should be triggered due to the waveshape change.
Despite the severity of the event, the RMS voltage was not affected much. The RMS Capture graph of the same waveform is shown in Figure 5. The RMS values are within a few volts of 120V throughout the event. An RMS-based trigger would not detect this.
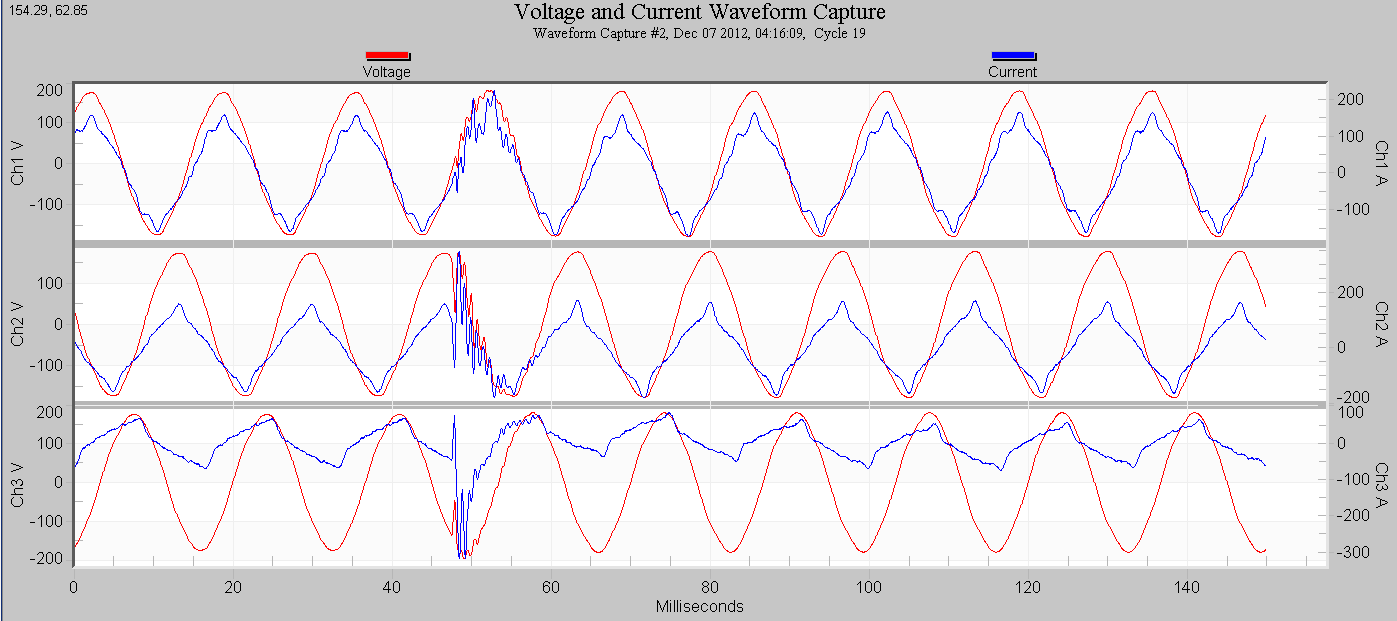
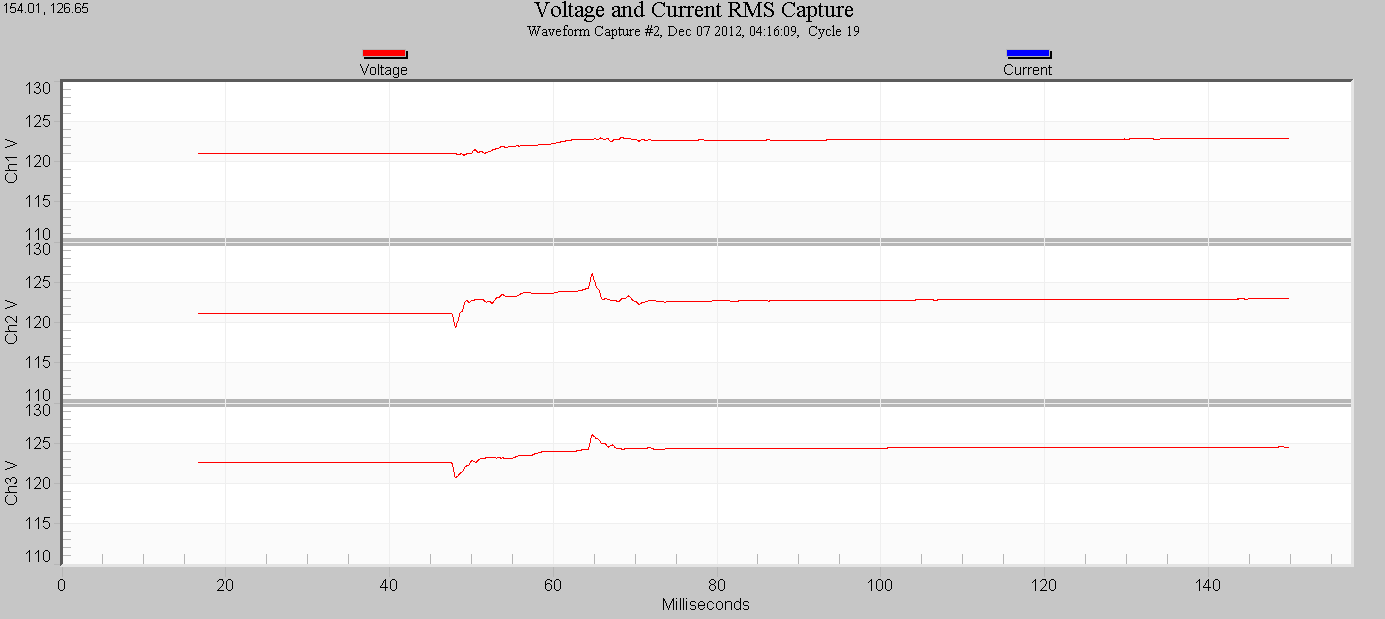
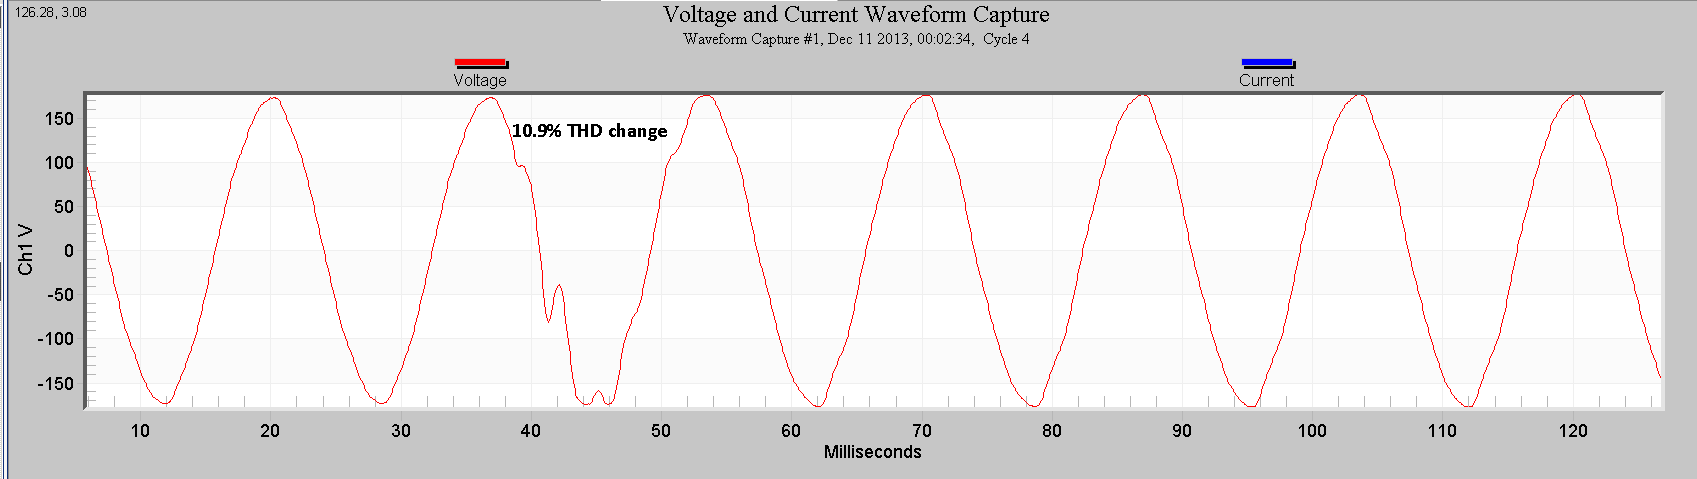
Figure 6 shows another distortion event on a single-phase circuit. Here the THD change was 10.9%. This is likely an upstream fault on another phase which has excited the lower frequency distribution system resonance around 400 Hz. Again, the RMS voltage was relatively steady during this event.
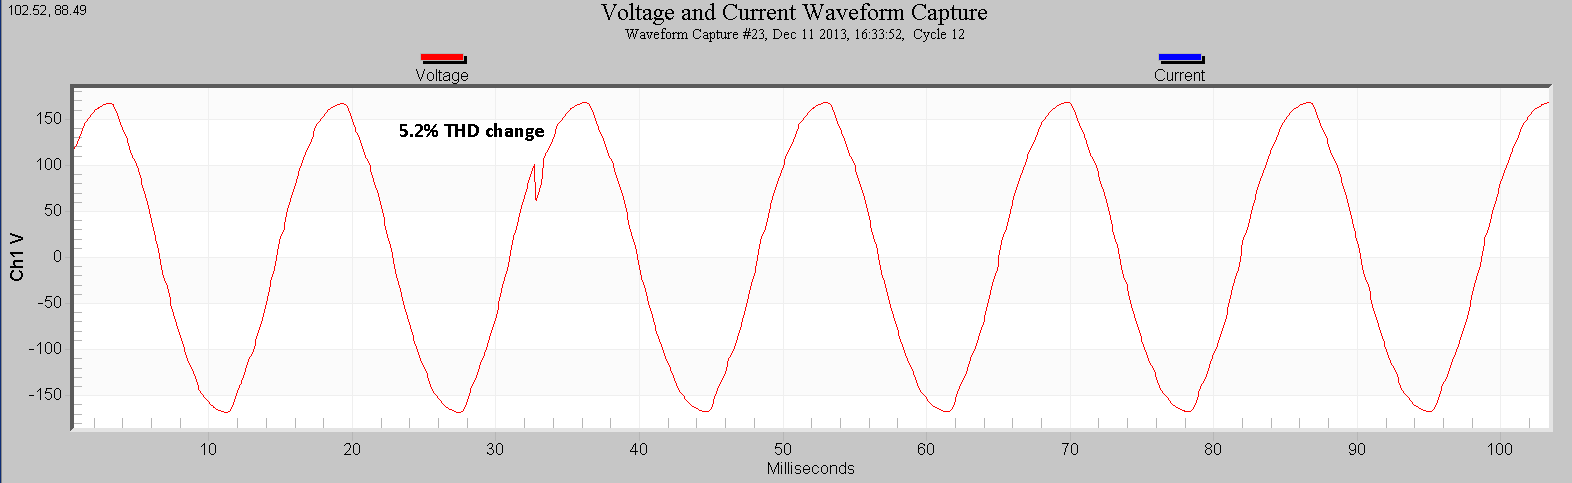
A voltage notch event is shown in Figure 7. The notch is not an oscillatory event, but the change in waveform shape for the notched cycle still produces a short-term change in THD for that cycle. Here, the change was 5.2%.
The ProVision default threshold is 5% for all channels. This is a good starting point and will catch significant events. Going lower will record more events, but at the risk of filling up memory with more unneeded waveforms of lower importance. Values as low as 2% can be reasonable, but even lower settings may be counter-productive except in known situations. Going higher than 30% will limit the trigger to events that are likely to also trigger as an RMS change. Keep in mind these are changes in THD over a single cycle, and not comparable to the steady-state IEEE 519 THD limits for voltage.
A cell Guardian that feeds data into PQ Canvass isn’t memory limited, so a lower threshold can be more practical. Going too low still risks hiding the few important captures amongst a host of uninformative events.
Conclusion
THD triggering allows for capturing complex events that elude simple RMS-based mechanisms. Available in the Revolution and cell Guardian, this mechanism is the most effective way to capture the data needed to quantify oscillatory transients, switching operations, voltage notching, and other sub-cycle events that greatly distort the voltage waveform, yet don’t significantly affect the RMS value.
