Abstract
IEEE standard 519 was first released in 1982 and was then updated in 1992 and 2014. It defines limits on Total Harmonic Distortion (THD) as well as Total Demand Distortion (TDD) with regards to both voltage and current. The voltage distortion thresholds are limits for the utility on the voltage applied to their customers (the end users of electric power). The current thresholds are limits on those customers for the loads they apply to the utility voltage. The physics behind delivering electric power dictates that increasing current distortion leads to increased voltage distortion. Because of this fact, the underlying premise behind the IEEE 519 standard is that if all customers meet the current TDD limits, then it will practical for the utility to meet their voltage limits. Consequently, Total Demand Distortion is an important parameter to check for IEEE 519 compliance.
Harmonic distortion is typically introduced into utility lines through customer non-linear loads installed in various types of manufacturing facilities. Such equipment consists of variable frequency drives, uninterruptible power supplies, and other types of rectifiers used to convert power from AC to DC.
Total Demand Distortion
Total Demand Distortion (TDD) is defined in the IEEE 519 Standard as “The ratio of the root mean square of the harmonic content, considering Harmonic components up to the 50th order and specifically excluding interharmonics, expressed as a percent of the maximum demand current. Harmonic components of order greater than 50 may be included when necessary.”
The Total Demand Distortion is shown with the following formula:
Where IL is the maximum demand current which is the sum of the currents corresponding to the maximum demand during each of the twelve previous months divided by 12.
Total Demand Distortion is often a better measure for analyzing distortion effects on a system and determining the need for power harmonic filters. A small current can have a high Total Harmonic Distortion but not be a significant problem because the magnitude of the harmonic current would also be small. By scaling the distortion to the maximum demand, the reading is more indicative of the resulting voltage distortion created from that current. The maximum demand current is closely correlated to the system impedance at that point, and thus correlated to the voltage distortion the current distortion may produce across that impedance.
At maximum load, the Total Demand Distortion and the Total Harmonic Distortion will be the same. As the load changes, the relative values of the Total Demand Distortion to corresponding Total Harmonic Distortion will change also. Although the Total Harmonic Distortion values may appear high, the Total Demand Distortion values may never be a problem. Current harmonic distortion isn’t generally a problem if the absolute harmonic levels are small relative to the max demand current at that location, which is generally related to the size of the transformer that is installed.
Total Harmonic Distortion values can fluctuate with changes in the mix of harmonic vs. non-harmonic loads. Total Demand Distortion on the other hand, is normalized such that pure 60Hz current changes don’t affect the output, so changes in non-harmonic loads don’t cause the TDD value to vary.
Recorder Settings
In order for ProVision to calculate Total Demand Distortion, the recorder must be setup to record all the necessary data. First you need a device capable of recording the data. Many of the available Power Monitors, Inc. devices are capable of recording this data, including the Eagle, Guardian, and Revolution. The examples in this paper are generated with a Revolution Power Quality Monitor.
Next you have to initialize the recorder for Total Demand Distortion calculations. Locate the device to be configured in ProVision’s device tree and from the menu choose “Initialize”. Choose the “Advanced” button to show the advanced configuration options. Under “Interval Graphs” tab, select the “I THD” checkbox. Then make sure “I Harmonics Magnitude” is selected, then enter “1” for Selected Harmonics. This is the minimum configuration for Total Demand Distortion. These steps are shown in Figure 1.
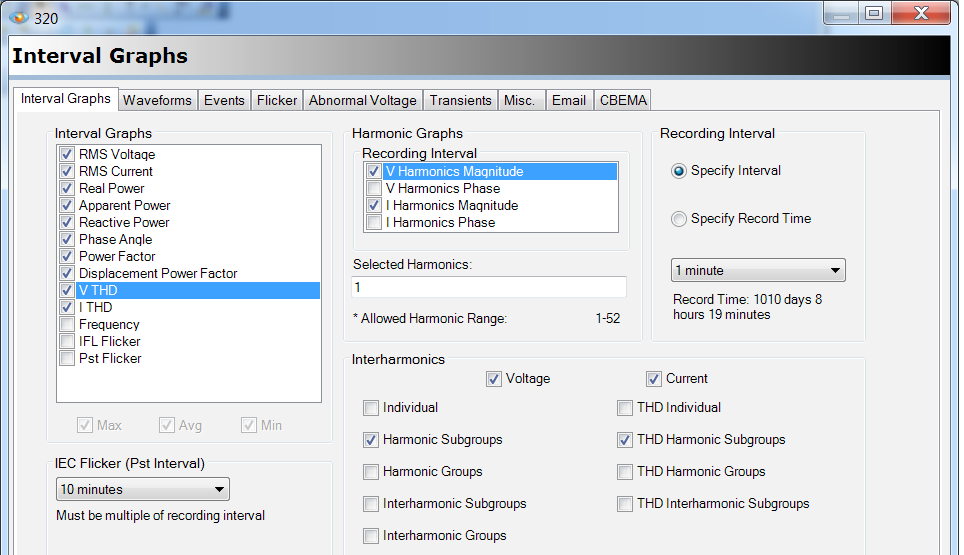
Other options such as “V THD”, “V Harmonics Magnitude” and additional harmonics may be helpful additional information. Additionally it will be helpful to go to the Interharmonic section and select “Harmonic subgroups”, “THD Harmonic Subgroups” and “THD Interharmonic Subgroups”.
See the white paper “Using The Revolution For IEEE 519-2014 Harmonic Studies” for more information about other IEEE 519 issues and harmonics.
ProVision and TDD Data
ProVision has a report and graph for displaying Total Demand Distortion calculated data. Part of the TDD formula is the maximum demand current. The maximum demand current has to be entered into ProVision for TDD calculations. When a Total Demand Distortion report or graph is requested the user is prompted for this information as shown in Figure 2. The entered value is stored in the recording so that future requests default to this value in the prompt.
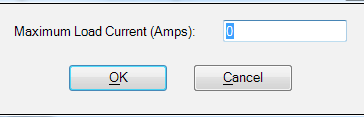
The recommended value for the maximum demand current, according to IEEE 519, is to use the average current of the maximum demand for the year prior. This can be extrapolated from historical data, but can be adjusted if the load is subject to future changes.
ProVision calculates the Total Demand Distortion from the trace data from the first harmonic and current THD. If the first harmonic is not present then the TDD are approximated by using the values from RMS current. Current THD trace is always required for the calculation.
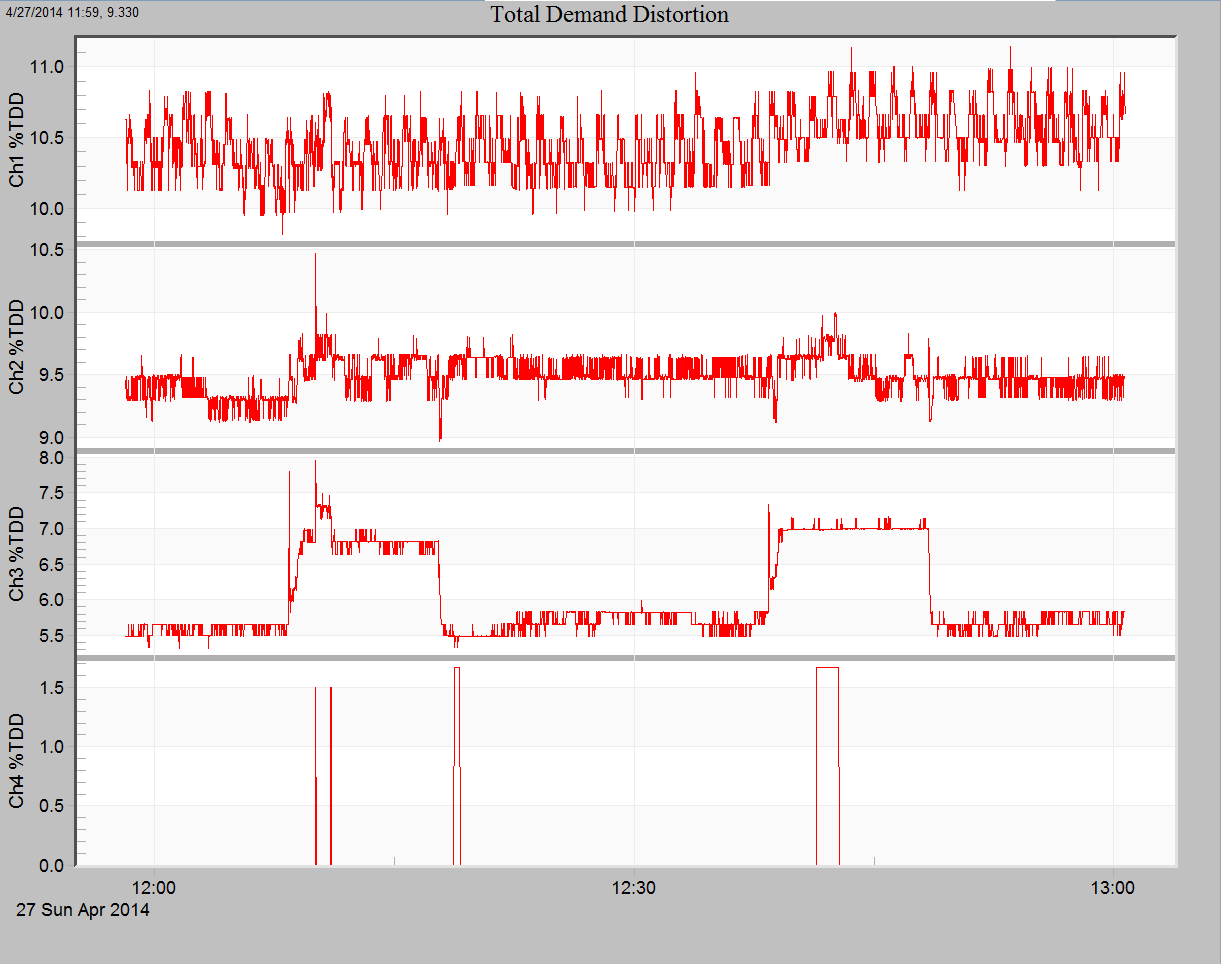
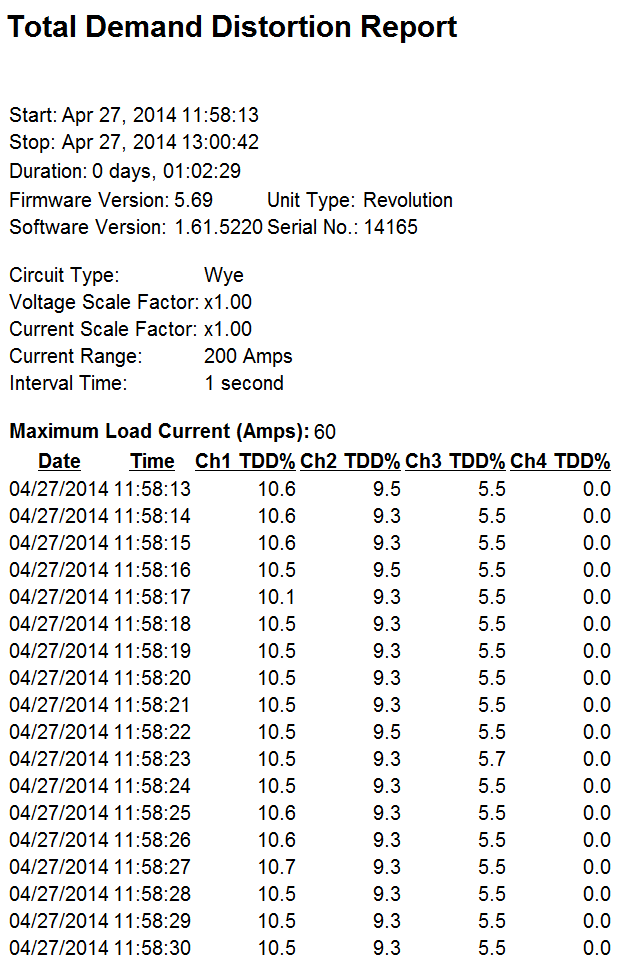
To display the Total Demand Distortion data choose “Total Demand Distortion” from either the graph or report menus. Figure 3 shows a “Total Demand Distortion Graph” and Figure 4 shows a “Total Demand Distortion” report generated in ProVision.
Applying the IEEE 519 Limits
The TDD limits in IEEE 519 depend on the ratio of the short circuit current Isc to the maximum load current IL, as shown below for systems from 120V through 69 kV:
| Isc/IL Ratio | 95th, 10 min | 99th, 10 min | 99th, 3 sec |
|---|---|---|---|
| < 20 | 5.0% | 7.5% | 10.0% |
| 20 < 50 | 8.0% | 12.0% | 16.0% |
| 50 < 100 | 12.0% | 18.0% | 24.0% |
| 100 < 1,000 | 15.0% | 22.5% | 30.0% |
| > 1,000 | 20.0% | 30.0% | 40.0% |
There are separate limits for 3 second very short time and 10 second short time readings, and also separate percentile aggregations for a full analysis. The 3 second measurements will always be higher than the 10 minute readings, so if the 3 second values are less than the 10 minute limits, the 10 minute readings will be in compliance also. Also, if every data point is below the limit, then there is no need to compute a percentile value — if there is no single reading over the limit, then the 99th or 95th percentile will both be within the limit too.
Conclusion
IEEE standard 519 defines limits on Total Harmonic Distortion (THD) as well as Total Demand Distortion (TDD) with regards to both voltage and current. Total Demand Distortion is often the most important parameter to check for IEEE 519 compliance, as without each customer staying within limits, it will be difficult or impossible for the utility to meet the voltage requirements. The method for recording the required data and viewing it in ProVision has been described here.
