Abstract
Most software products have a graphical user interface (GUI) that allows the user to interact with the program, and ProVision is no exception. Some of these interfaces can be quite simple and only contain a handful of basic controls, while others can be significantly more complex and utilize a wide variety of different types of controls. However, regardless of the number, layout, or type of controls a user interface has, its basic responsibility is the same: to allow the user to interact with the program, and for the program to relay information about its current state to the user.
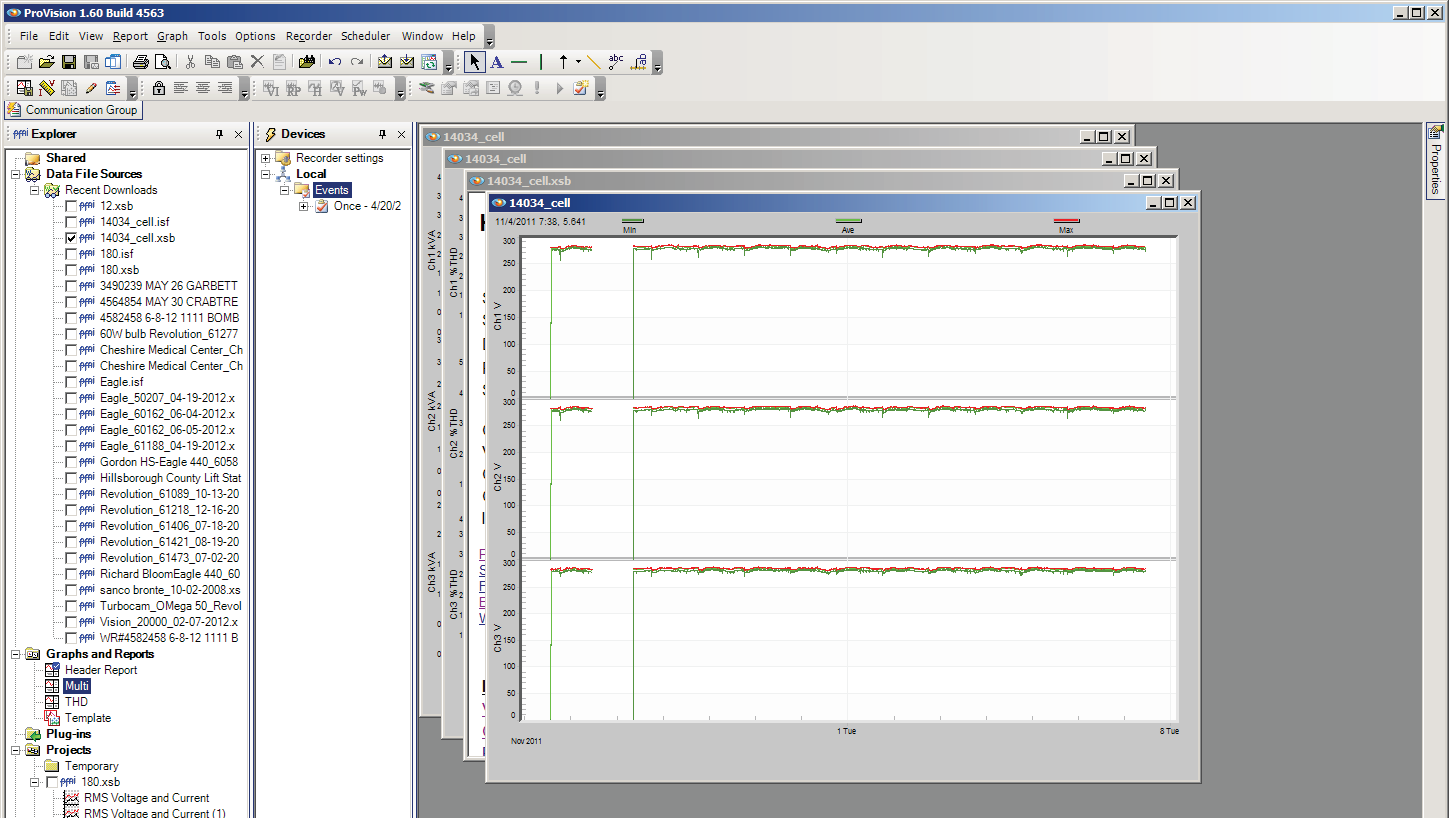
The responsibilities of the ProVision user interface, to name a few, include listing any currently connected recorders and available recording files, showing any recording downloads in progress, and displaying any open graphs and reports. The communication group window is quite versatile; it is capable of displaying the current progress of a communication with a recorder such as a recording download or the uploading of new firmware, any open graph or report, and real-time waveforms. Whenever any of these are open, they are displayed as a new tab in the communication group window as shown in Figure 1. This whitepaper serves as an overview of the tab functionality and the different ways these can be displayed.
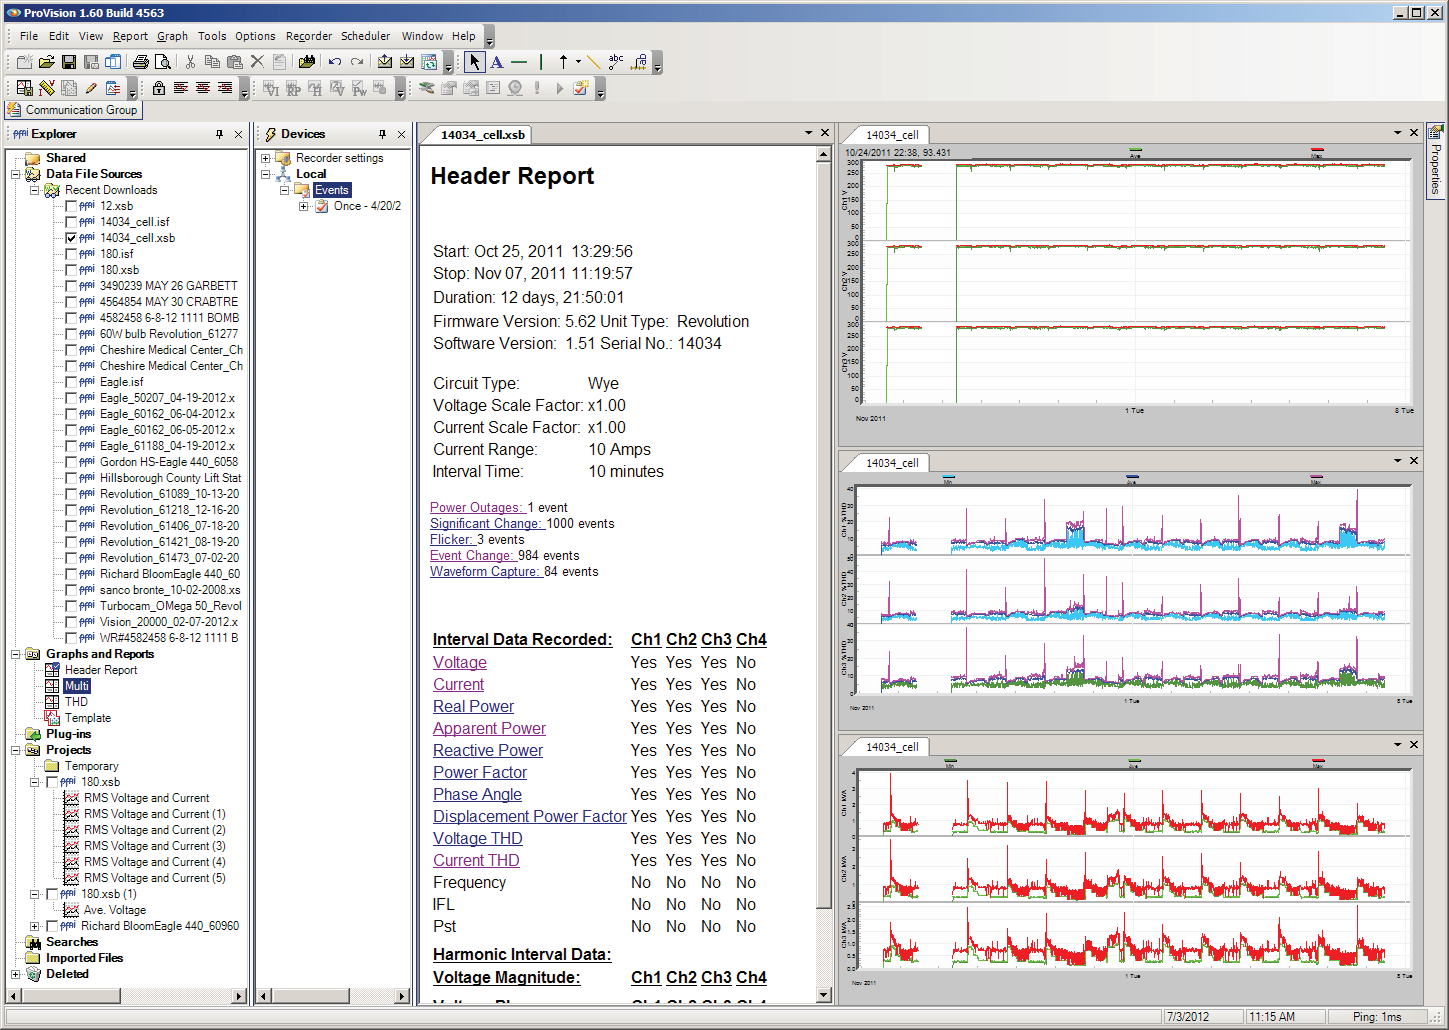
A new tab is added to the communication group window when opening a graph or report or initiating any type of recorder communication. These tabs are displayed at the top of the window, as shown, and the correlating contents of different tabs can be shown by clicking that tab with the mouse. However, it’s possible to modify the order the tabs are displayed in, to separate them into distinct groups to display contents of multiple tabs, or do away with the tabbed layout entirely.
Rearranging Tabs
When multiple tabs are present, right-clicking any of the tabs with the mouse will open a context menu. These context menu options will tile the available tabs into distinct groups, either horizontally or vertically dependent on which option is selected, as shown in Figure 2. From here, these groups can be subdivided by repeating this process. This means data from multiple reports and graphs can all be displayed at once.
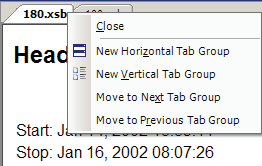
However, the trade-off for this is that each group will have a smaller amount of monitor space. When multiple groups are open, the context menu for right-clicking a tab contains more options: to move that tab to any of the other tab groups. In the event the tab being moved is the only one in the group, or the last tab in the group is closed, that group collapses and the remaining groups rearrange themselves to best accommodate available screen space.
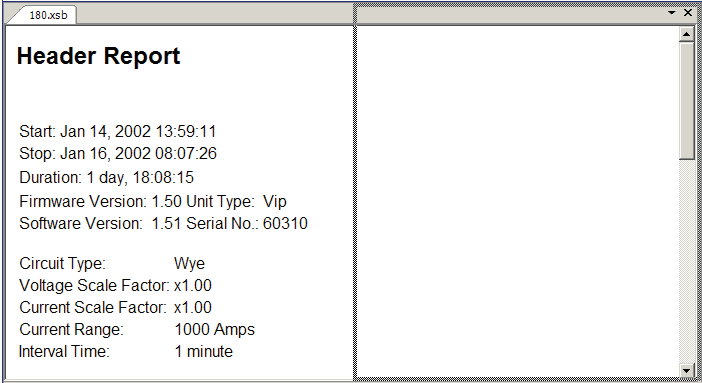
Tab groups can also be created manually by clicking a tab with the mouse button, and, while keeping the mouse button held down, moving the mouse to another area of the communication group window. This causes a grey outline to follow the mouse, and, when released, the contents of the tab are populated into the outline as shown in Figure 3.
Launching Annotations from Graphs
The RMS Voltage and Current graph also includes link annotations for waveform capture. As shown in Figure 4, these links are displayed as solid vertical bars on the graph that extend through all plots. When moving the mouse cursor over one of these links, the appearance of the cursor will change from the default arrow to the hand-gesture symbol. This indicates that the cursor is in a position that a mouse-click will select the waveform capture link annotation. This opens a new tab with the appropriate waveform data correlating to that event.
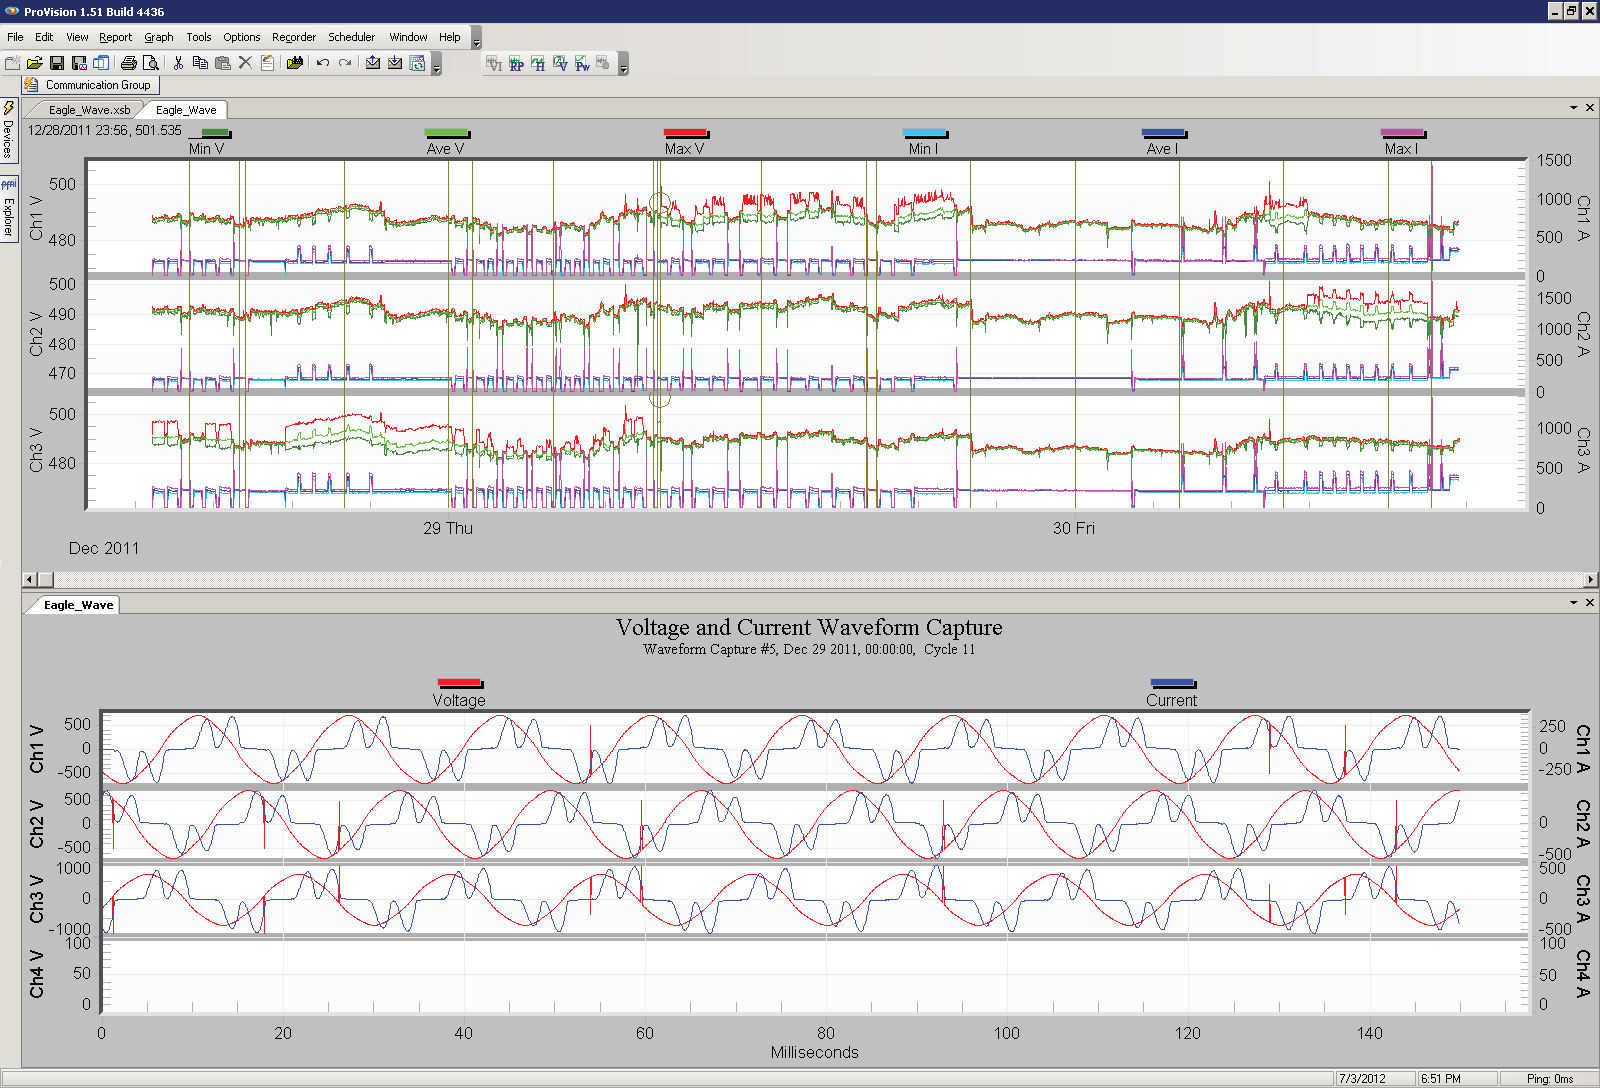
This new tab can be treated as any other by being moved into an existing tab group. If the tabs are organized in such a manner that both the RMS Voltage and Current graphs and the waveform capture graph are visible, the waveform capture graph will update accordingly whenever a different annotation is selected in the RMS Voltage and Current graph. This provides an expedient manner in which waveform capture data can be viewed in a timely fashion, without needing to toggle open tabs each time.
Using Standard Windows
ProVision uses the tabbed layout that can be separated into groups by default. However, functionality is also included that allows each tab to be treated as a separate standard window. This can be changed by selecting “Window” from the menu bar, and toggling the “Tabbed Windows” option. The check state of the menu entry shows whether tabbed windows are currently enabled. Disabling the tabbed windows causes ProVision to change each tab into an individual window with its own title bar as shown in Figure 5. These windows can be rearranged, scaled, resized, minimized, and closed all independently of each other.
The default layout when using windows is Cascade, as shown, where each window is laid over the previous. When this view type is enabled, additional options are added to the Window menu that provides different methods for laying the windows out: they can be tiled, cascaded, all minimized, or all closed.
Saving and Using Views
Once a tab configuration has been customized and the layout modified such that all necessary data are visible, this layout can be saved to a view. The view defines all open tabs, their positions and groupings, and what types of data are displayed in them. If a recording file is opened using a specific view, the communication group window will be populated with the appropriate graphs and reports corresponding to that view using the data from the selected recording. If the view contains an element of a collection, such as a waveform capture, ProVision enumerates the available data in the graph and allows the user to select the one to use.
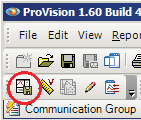
Views can be saved by selecting the “Capture View” button on the toolbar, as shown in Figure 6. Doing so adds a new entry to the Graphs and Reports node in the Explorer pane and allows the view to be named. The initial name for the view is simply “New View”. A recording can be opened with a specific view by selecting the checkbox next to the recording in the Explorer pane, then double-clicking the name of the view.
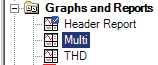
The default view is simply “Header Report”, also under the Graphs and Report node. As shown in Figure 7, the default view has a small blue checkmark on the upper right corner of its icon, and is also the one that any recording file is opened with when that recording file is double-clicked in the Explorer pane. To change this, simply right-click on the desired view and, from the resultant context menu, select “Set as Default View”. Other options available in the context menu allow the view to be renamed or removed entirely.
Conclusion
ProVision offers multiple ways of displaying reports and graphs, either via the tabbed interface or through individual windows. Since recording files typically contain multiple sets of varying data, being able to use views to expediently display only the required information can be done significantly faster than manually opening each component of the recording each time it is necessary.
