Abstract
Power systems ideally operate in a balanced state, with equal voltages and currents across all phases. However, real-world scenarios often involve unbalanced conditions that can degrade power quality. Symmetrical components are a powerful mathematical tool used to analyze unbalanced systems and understand their impact on power quality. This white paper introduces symmetrical components and describes how they can be computed and measured using PMI’s web-based PQ Canvass software.
What Are Symmetrical Components?
Imagine taking an unbalanced three-phase system and mathematically transforming it into three balanced sets of components:
Positive Sequence: Represents a balanced system with all three phases having the same magnitude and phase angles displaced by 120 degrees (ideal condition).
Negative Sequence: Represents a counter-rotating balanced system with the same magnitude but opposite phase sequence compared to the positive sequence. Think of this is the “counter-rotating” part, like a motor shaft spinning backwards.
Zero Sequence: Represents a balanced system where all three phases have the same magnitude and are in phase with each other.
We can further define these sequences by their fundamental characteristics, their magnitude and phase relationships to one another and the physical significance of each component:
Positive Sequence (Positive Sequence System)
Characteristics: This component represents a balanced three-phase system with the same phase sequence (ABC) as the original system.
Magnitudes: The magnitudes of all three phases (Va, Vb, Vc) are equal.
Phase Angles: The phase angles of the three phases are separated by 120 degrees, with Vb lagging Va by 120 degrees and Vc lagging Vb by another 120 degrees.
Physical Significance: This sequence represents the normal operating condition of a balanced three-phase system. It contributes to the rotating magnetic field that drives motors and generators.
Negative Sequence (Negative Sequence System)
Characteristics: This component also represents a balanced three-phase system, but with the opposite phase sequence (ACB) compared to the positive sequence.
Magnitudes: Similar to the positive sequence, all three phases (Va, Vb, Vc) have equal magnitudes.
Phase Angles: The phase angles are also separated by 120 degrees, but in a reversed order compared to positive sequence. Vb leads Va by 120 degrees and Vc leads Vb by another 120 degrees.
Physical Significance: This sequence doesn’t exist under ideal operating conditions. It typically arises from unbalanced faults or unbalanced loads. The counter-rotating magnetic field created by the negative sequence can induce excessive currents in motors, leading to overheating and potential damage.
Zero Sequence (Zero Sequence System)
Characteristics: This component represents a set of three phasors with the same magnitude and phase angle. In other words, all three phases (Va, Vb, Vc) are identical.
Physical Significance: This sequence arises from unbalanced conditions involving the neutral conductor. Common causes include single-phase-to-ground faults or unbalanced loads connected to the neutral. The zero-sequence current can cause overheating in neutral conductors and transformers with a grounded neutral. Note that in line-to-line connected loads, there is no zero sequence since nothing is connected to neutral.
How Are They Related to Power Quality?
By analyzing the individual components, power quality engineers can understand how unbalanced conditions affect the system. There are two main areas in which symmetrical components are used for troubleshooting power quality issues:
Voltage Unbalance: This is a common power quality issue where the voltage magnitudes or phase angles across the phases differ. Symmetrical components help pinpoint the type of unbalance and its impact. High negative sequence components can cause overheating in motors, reducing their lifespan.
Fault Analysis: During faults, the system becomes unbalanced. Symmetrical components simplify fault calculations by analyzing each sequence component separately. This allows engineers to determine fault currents and voltages for protective relay operation and system restoration.
Analyzing Symmetrical Components in PQ Canvass
PQ Canvass provides some very useful tools for analyzing symmetrical components. The platform can compute the symmetrical components of any captured waveform. This allows for measurements before and after a disturbance, as well as checks during normal operation with periodic waveform capture.
Preparing the Recording
In order to use symmetrical components to analyze unbalance, the user will need to configure the recorder to capture waveforms. It’s recommended to enable periodic waveform capture. The use of periodic capture ensures that steady state readings are taken at regular intervals.
To enable periodic waveform capture, simply check the “Periodic Capture” checkbox when initializing your recorder.
Viewing Symmetrical Components
Once a new recording has begun in PQ Canvass, the user can navigate to that recording and start exploring the waveform captures as they arrive in the software. The user will notice that there is a wide array of tools for analyzing waveform captures within PQ Canvass:
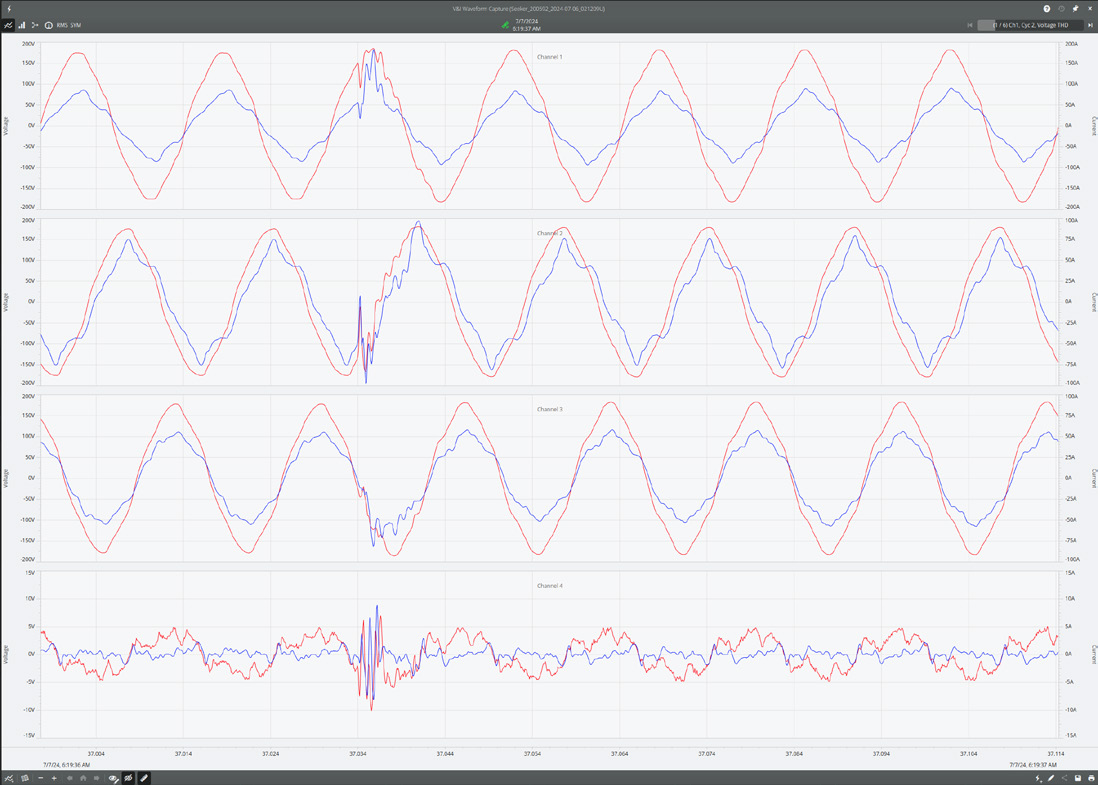
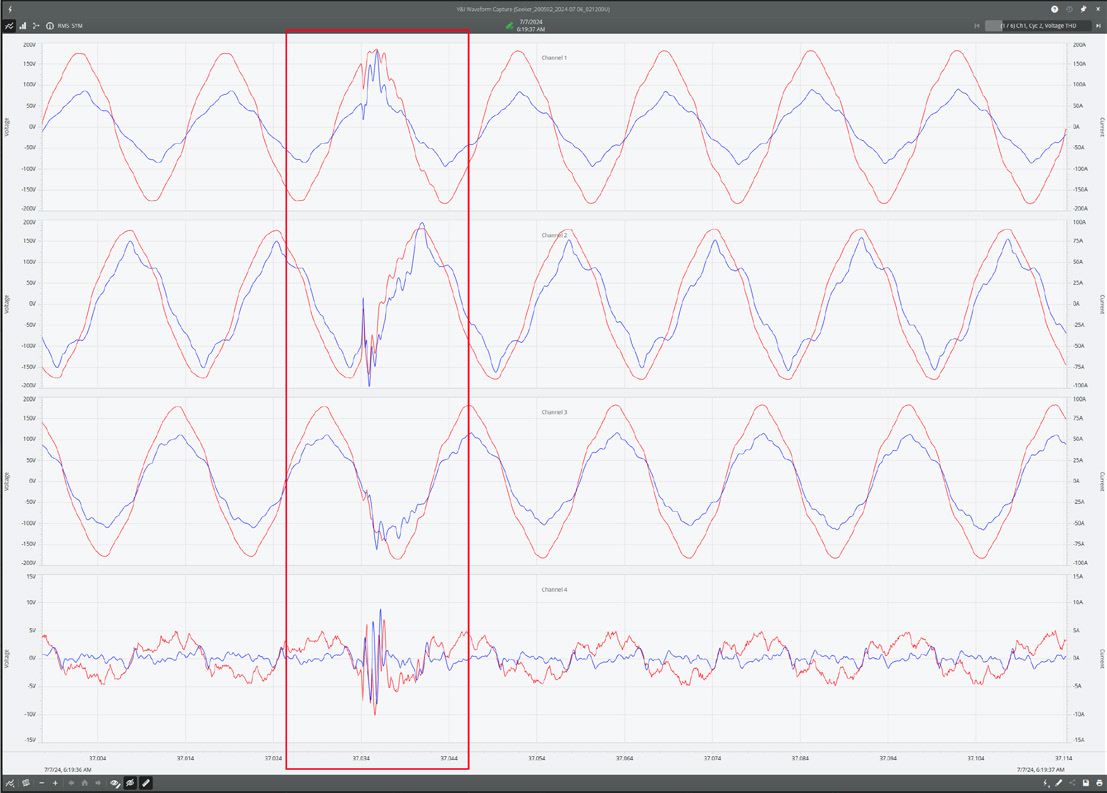
Time Domain: This is the default waveform view when a user selects a waveform capture for analysis in PQ Canvass. It shows each channel of recorded voltage and current for the configured capture period. (The capture period includes the number of user-specified pre- and post-cycles and the capture cycle itself. PMI defaults to 2 pre- and 6-post captures for a total of 9 cycles per waveform capture. Again, though, this is user configurable.)
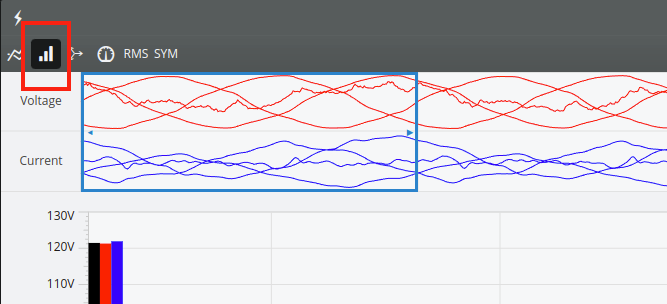
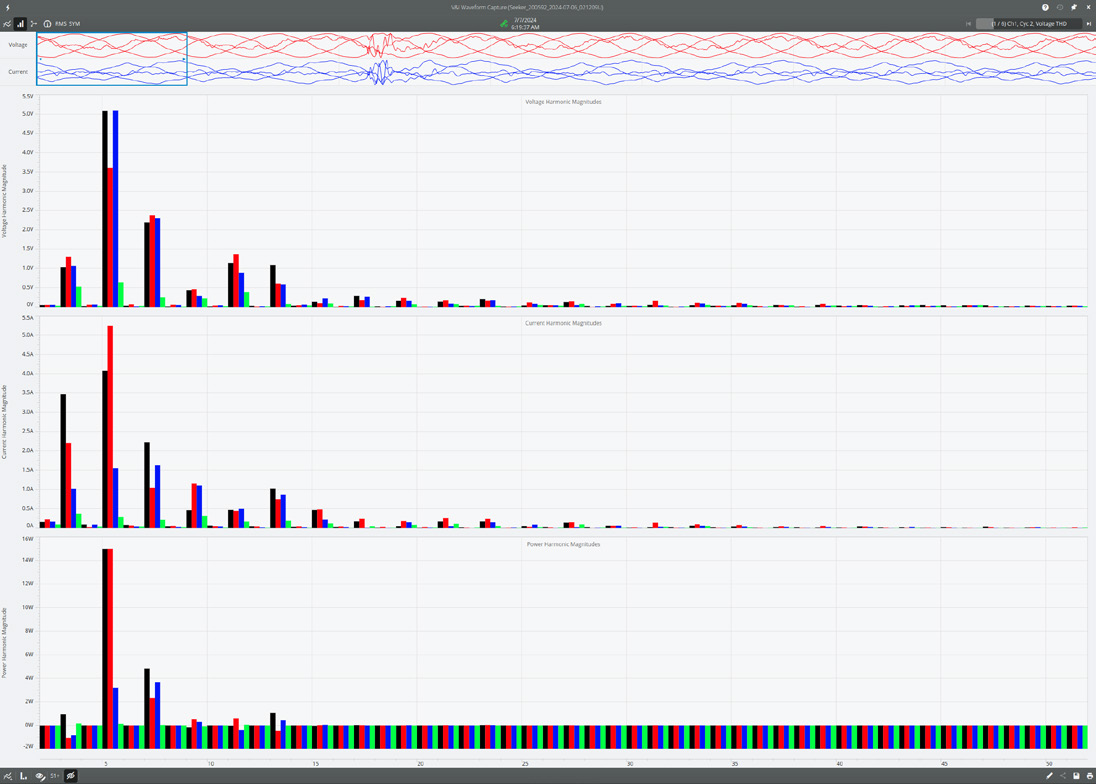
Harmonics View: The Harmonics view, or frequency domain, is used to investigate the spectral content of individual waveform captures. To switch to this view, click the Harmonics button in the top control bar (see Figure 2). Figure 3 shows an example of the Harmonics analysis tool for recorded waveform captures.
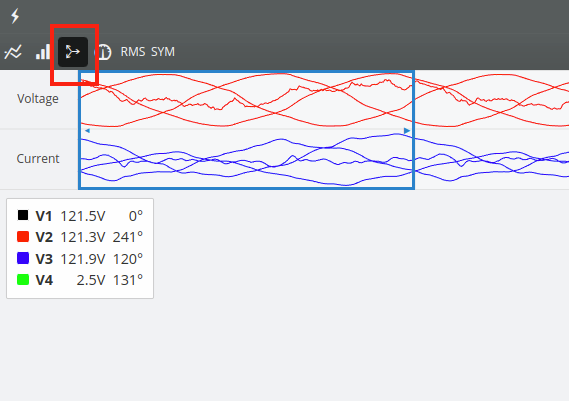
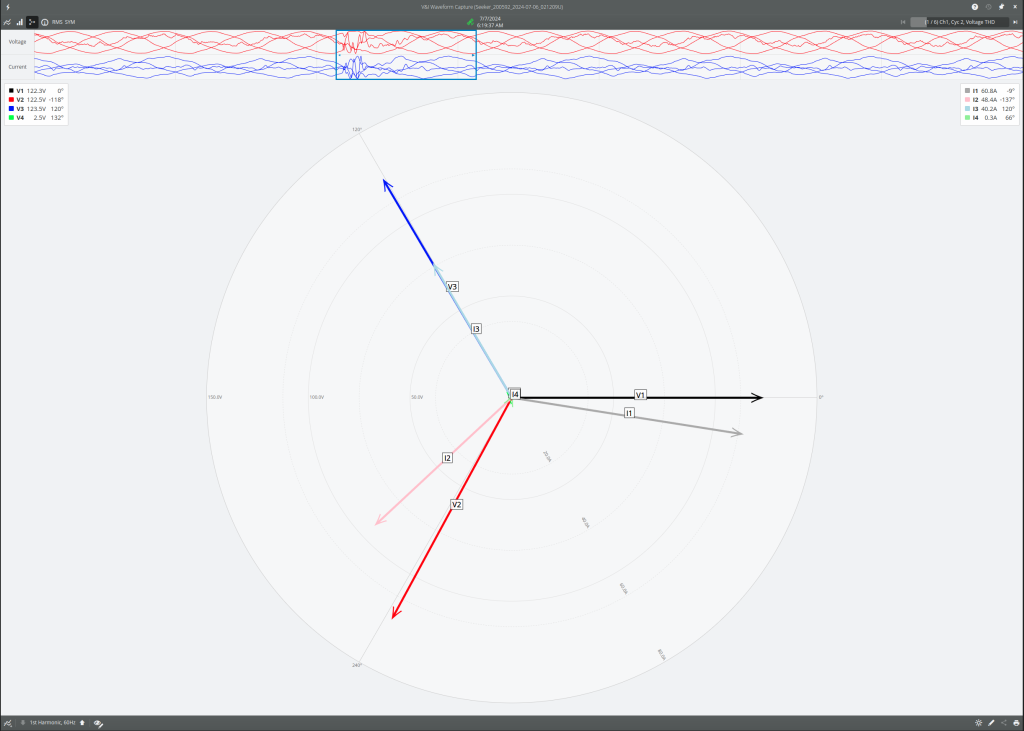
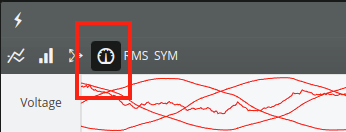
Vector Diagram: The Vector diagram is used to show the phasors of each connected phase during the waveform capture. Just like the Harmonic view, there’s a slide window at the top of the control that allows the user to select one cycle’s worth of samples at a time. To get to the Vector diagram view, simply click on the Vector Diagram button in the top control bar (Figure 4). Figure 5 shows an example Vector Diagram from PQ Canvass.
Meter Display: The waveform meter display is used to display some tabular statistics and measurements from the area of inspection under the sliding cycle selector control. Just like with Harmonics and Vector diagrams, the user can slide the window around to cover one full cycle’s worth of samples and PQ Canvass will report the measurements back out in tabular form.
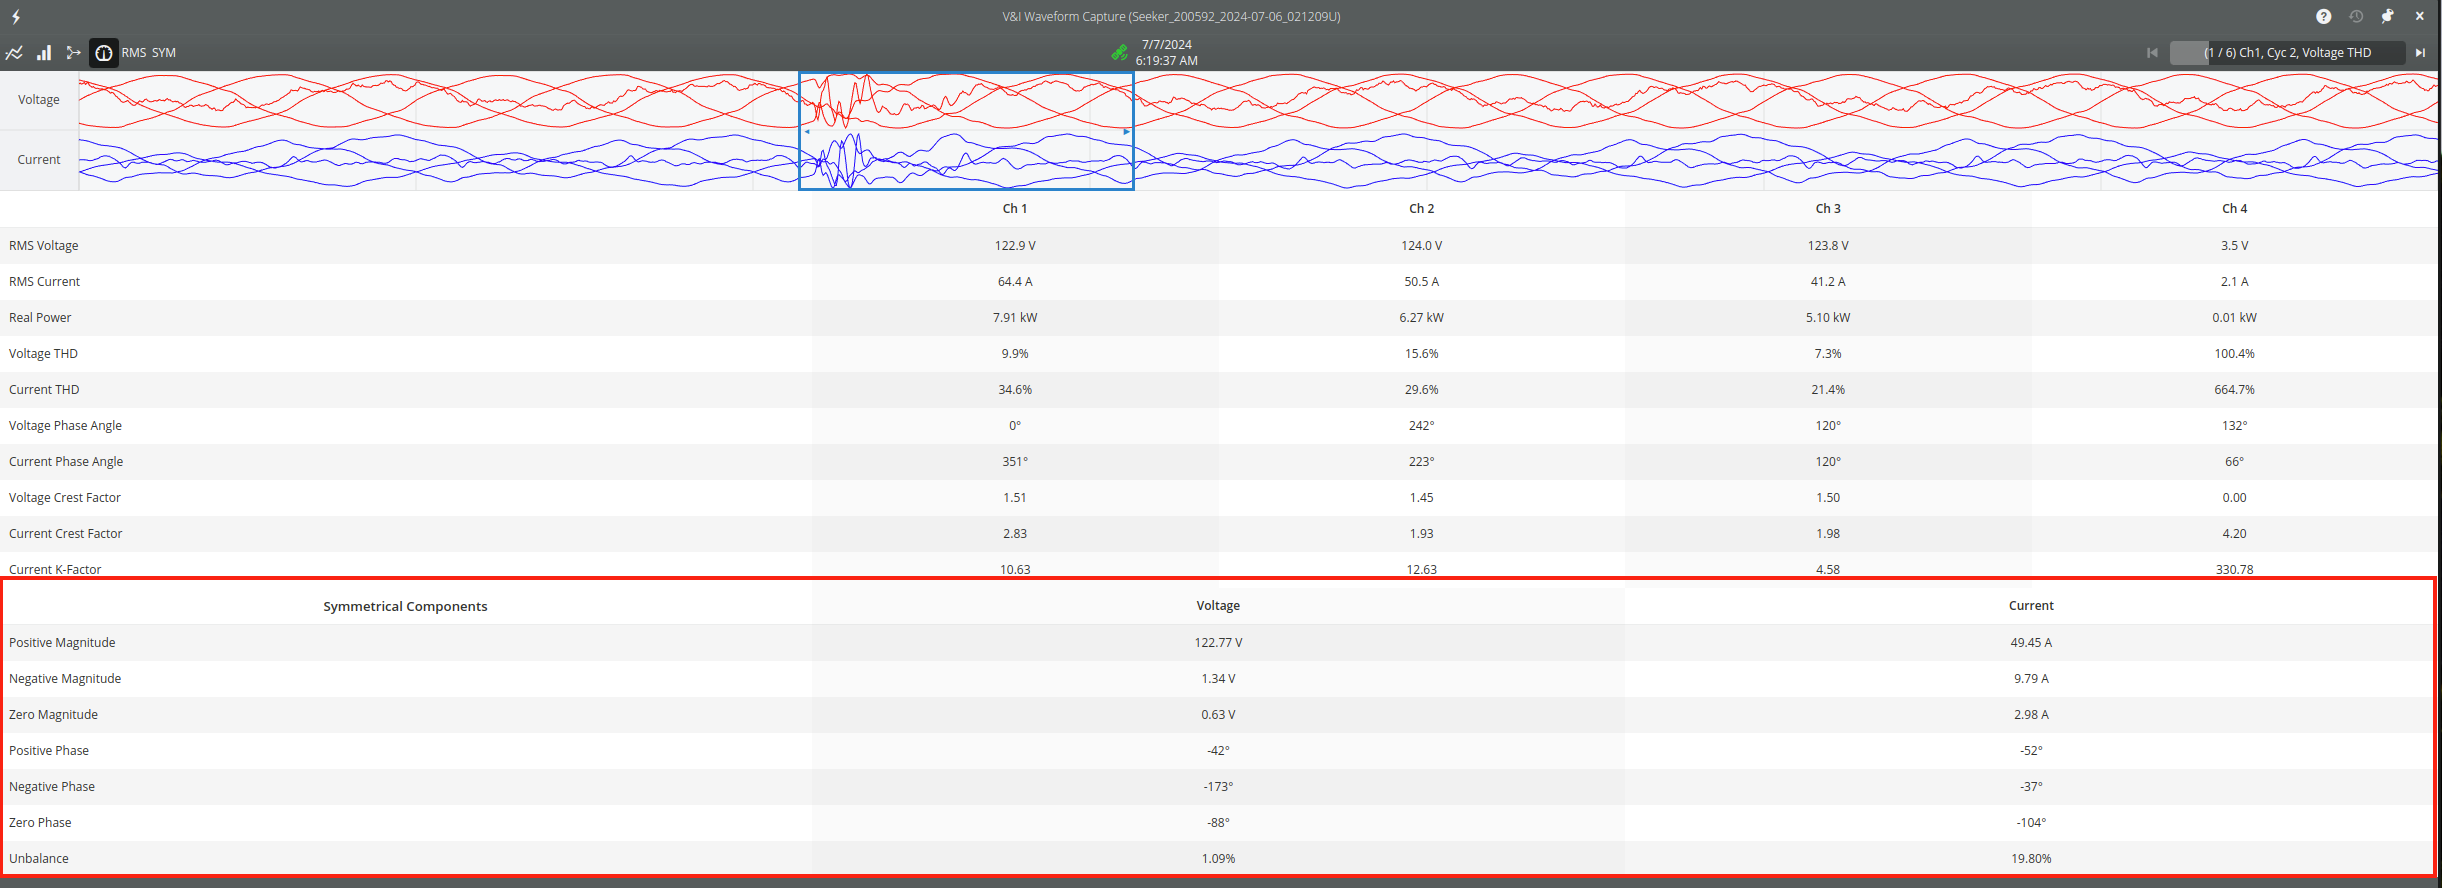
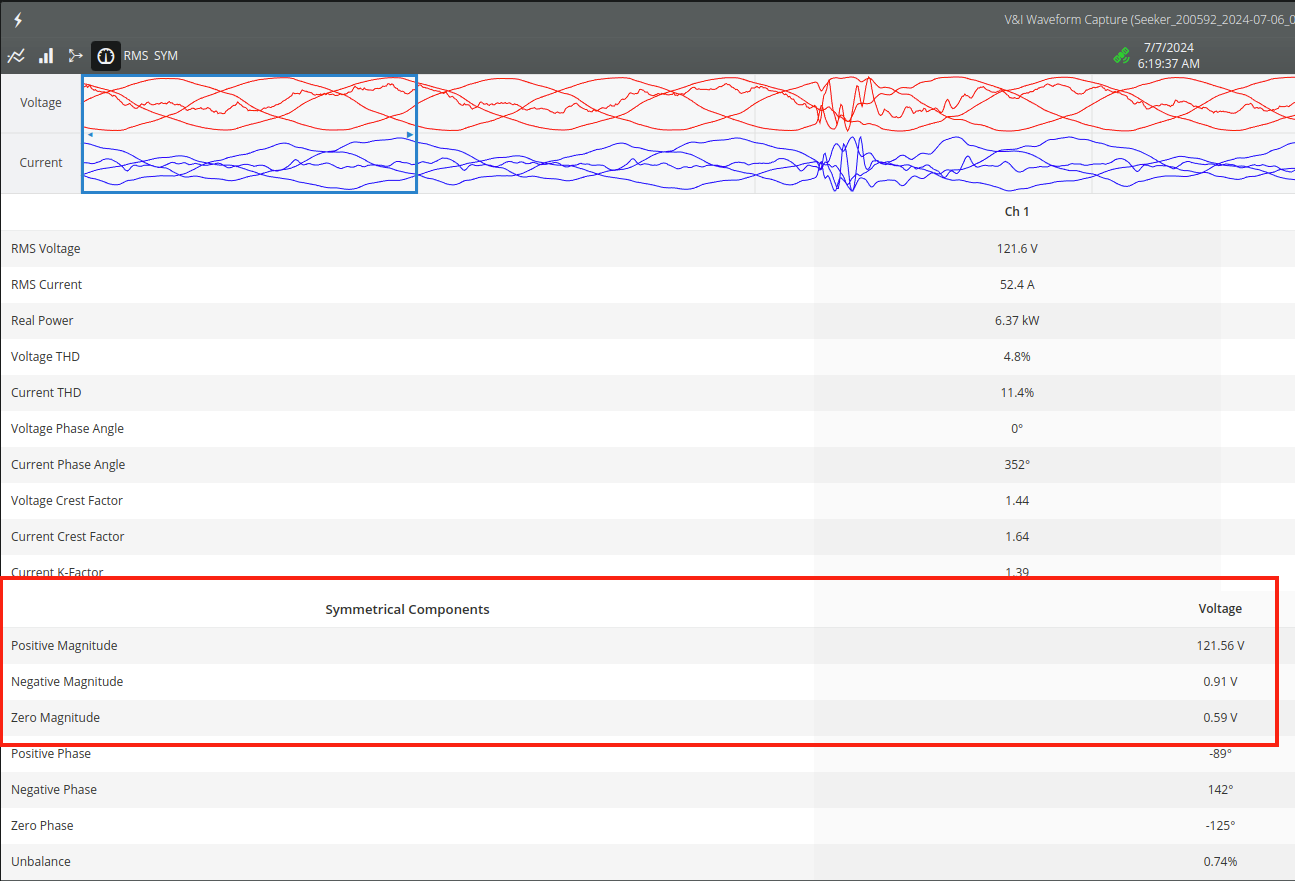
This is also one of the primary displays for Symmetrical Components. The bottom half of the table shows the symmetrical components for voltage and current and include the positive, negative and zero sequence magnitudes and phase angles in addition to voltage and current unbalance computed from these components (See Figure 6).
We will come back to this particular screen below where we get a little deeper into demonstrating the usefulness of Symmetrical Components.
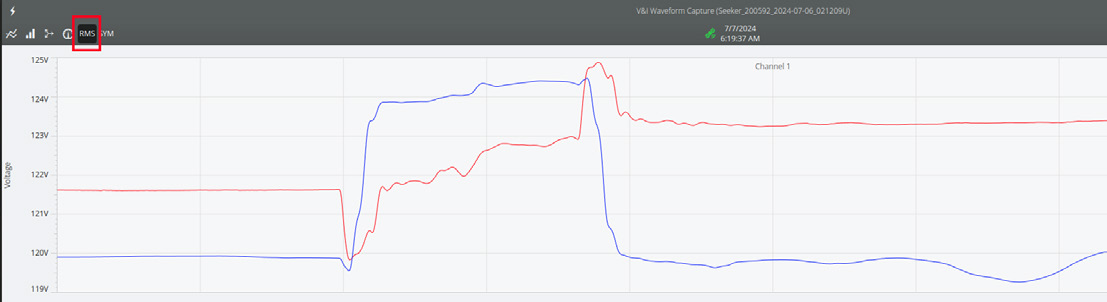
RMS Display: The RMS display is used to show the rolling RMS voltage and current for the capture.
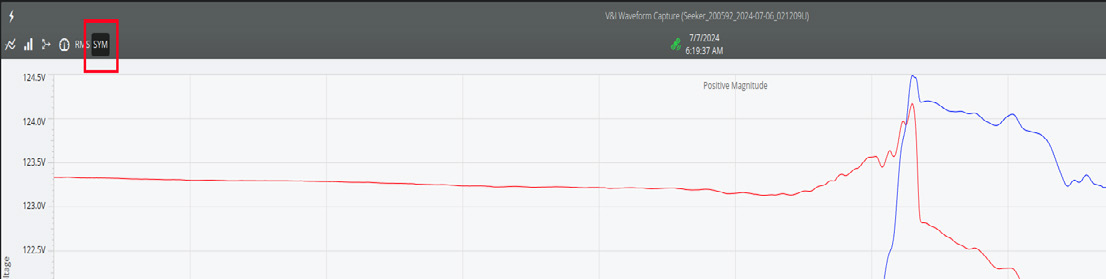
Symmetrical Magnitudes Trace Display: In addition to the tabular format for looking at symmetrical components in a given selection through the wave selector slide window, PQ Canvass allows the user to look at a running time series of the voltage and current positive, negative and zero sequence magnitudes. This can be accessed using the SYM button in the top control bar.
Analyzing Symmetrical Components in the Waveform Capture Meter Display
In the previous section we went through the different waveform analysis tools that PQ Canvass provides. For symmetrical component analysis, we need to highlight two of those: the Meter display and the Symmetrical Magnitudes Trace display, though the meter display is going to be of more use.
In our example waveform capture, the reader will notice the oscillatory transient in the capture cycle. Switching to the meter view, we will leave the cycle selector all the way to the left – this is highlighting the first of the two pre-cycles that were recorded as part of this waveform capture. We can assume that this is fairly representative of the steady state of the system that is being measured.
Looking at the Symmetrical Components section, we can see that the negative- and zero-sequence magnitudes for voltage are negligible: both less than 1.0VRMS. Note that unbalance is also < 1%, which is really quite good. (The recording being used for this paper comes from a Seeker attached to the electrical service entrance at PMI headquarters.)
Next, we will advance the cycle selector forward so that we are directly over the cycle that contains the transient. Taking another look at the meter view again, you can see that the negative-sequence magnitude has gone up just a touch: we’re sitting at about 1.33VRMS now, but the zero-sequence magnitude remains essentially unchanged (there is a small-but-negligible increase in the magnitude).
Mathematical Definition
For the purpose of completeness, we will provide the mathematical formula for computing symmetrical components.

In this equation:
V1: Is the Positive Sequence Voltage. Note that this is a complex number.
V2: Is the Negative Sequence Voltage. This, too, is a complex number.
V0: Is the Zero Sequence Voltage. As with the other two components, this is a complex number as well.
a: is defined as
a2: is defined as .
a3: is defined as 1.
Va, Vb and Vc: These are the channel 1, 2 and 3 voltages respectively. Note that these are the complex 60Hz phasors as well — they should be computed from the raw sine waves as the 60Hz or fundamental DFT output bin.
Conclusion
Symmetrical components are the ideal way to help quantify the impact of a fault or to accurately measure unbalance in an electrical system. This paper has demonstrated how to use PQ Canvass and PMI’s PQ Canvass-enabled recorders to perform this analysis.
