Abstract
With the Point Table in the Waveform Capture function of ProVision, it is possible to estimate the ring frequency, phase shift, power factor, and crest factor of a waveform.
Point Table
The Point Table is a very valuable tool available with the Waveform Capture function in ProVision. When analyzing an electrical disturbance, the Point Table allows the operator to make quantitative measurements with numerical data that can be used in calculating important electrical parameters. These parameters can be used in comparing and sometimes troubleshooting power system issues.
Waveform capture alone shows the operator the wave shape; the Point Table allows the operator to mark, measure, and assign numerical values to different points in that waveform. Important parameters such as ring frequency, phase shift, power factor, and crest factor can now be estimated to the accuracy of the recorder and the point resolution of the Waveform Capture function. ProVision does have other ways of providing some of the same power quality parameters, however the Waveform Capture Point table is another powerful tool in ProVision’s arsenal that allows the operator greater flexibility to get to the root of power quality issues.
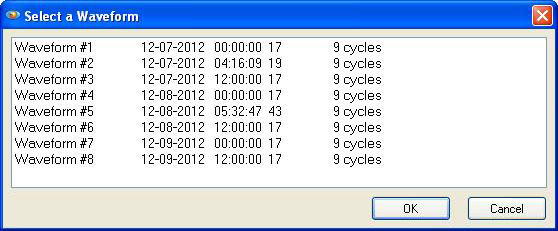
The easiest way to use the Waveform Capture Point Table in ProVision is by choosing Graph, and then a Waveform Capture in the Menu. After clicking on the Waveform Capture option, the table shown in Figure 1 will appear. Select the waveform to be examined and left click the mouse to select it.
After selecting the waveform, a window similar to the one shown in Figure 2 will be displayed (here, waveform 2 was selected to provide an example of estimating ring frequency). Notice the large ringing on the waveform. By using the mouse wheel or Page Up/Down keys, the operator may quickly scroll through the captured waveforms. It is then possible to use left mouse button to click and zoom into the portion of the waveform that contains the information at a resolution that permits the operator to recover the needed information.
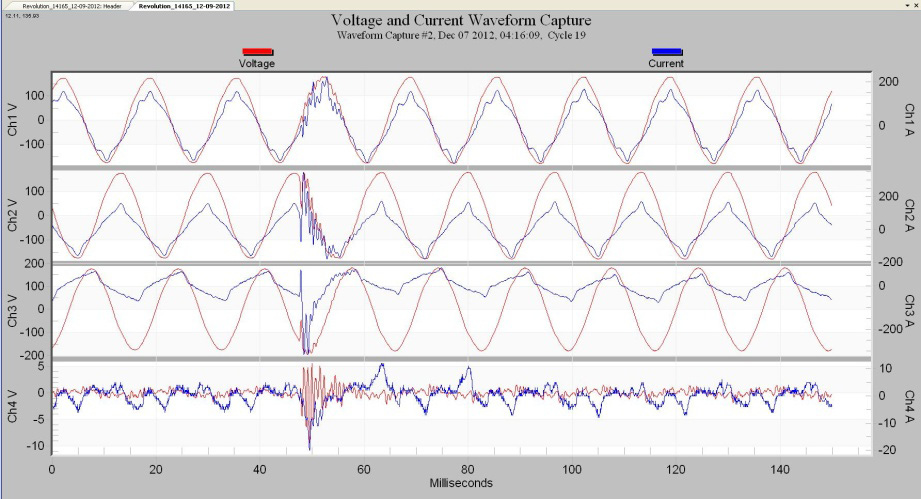
Ringing on power lines is caused by resonances formed between the power factor correction capacitors and the inductive loads. The most common cause of ringing are the power factor capacitors themselves switching in and out, and exciting the resonances. Shorts or other extreme step changes in load can also excite those resonances. One use for measuring resonance frequency is in the case where it is severe enough to warrant blocking it, which would sometimes involve a tuned filter.
Estimating Ring Frequency
To demonstrate how to estimate the ring frequency of a waveform, either voltage or current, with Waveform Capture, zoom in on the waveform. Then click “T” to invoke the table function. Now use the mouse to select a point where the waveform crosses a similar horizontal position. Note that the cursor needs to be on an active point on the waveform before the marker will occur. If you have trouble finding the active points, it helps to click the right mouse button, and select “Mark Data Points”. For ringing waveforms, it’s easiest to measure from peak to peak to find the period. The first marker is set to point 755, at 49.09 ms as shown in Figure 3.
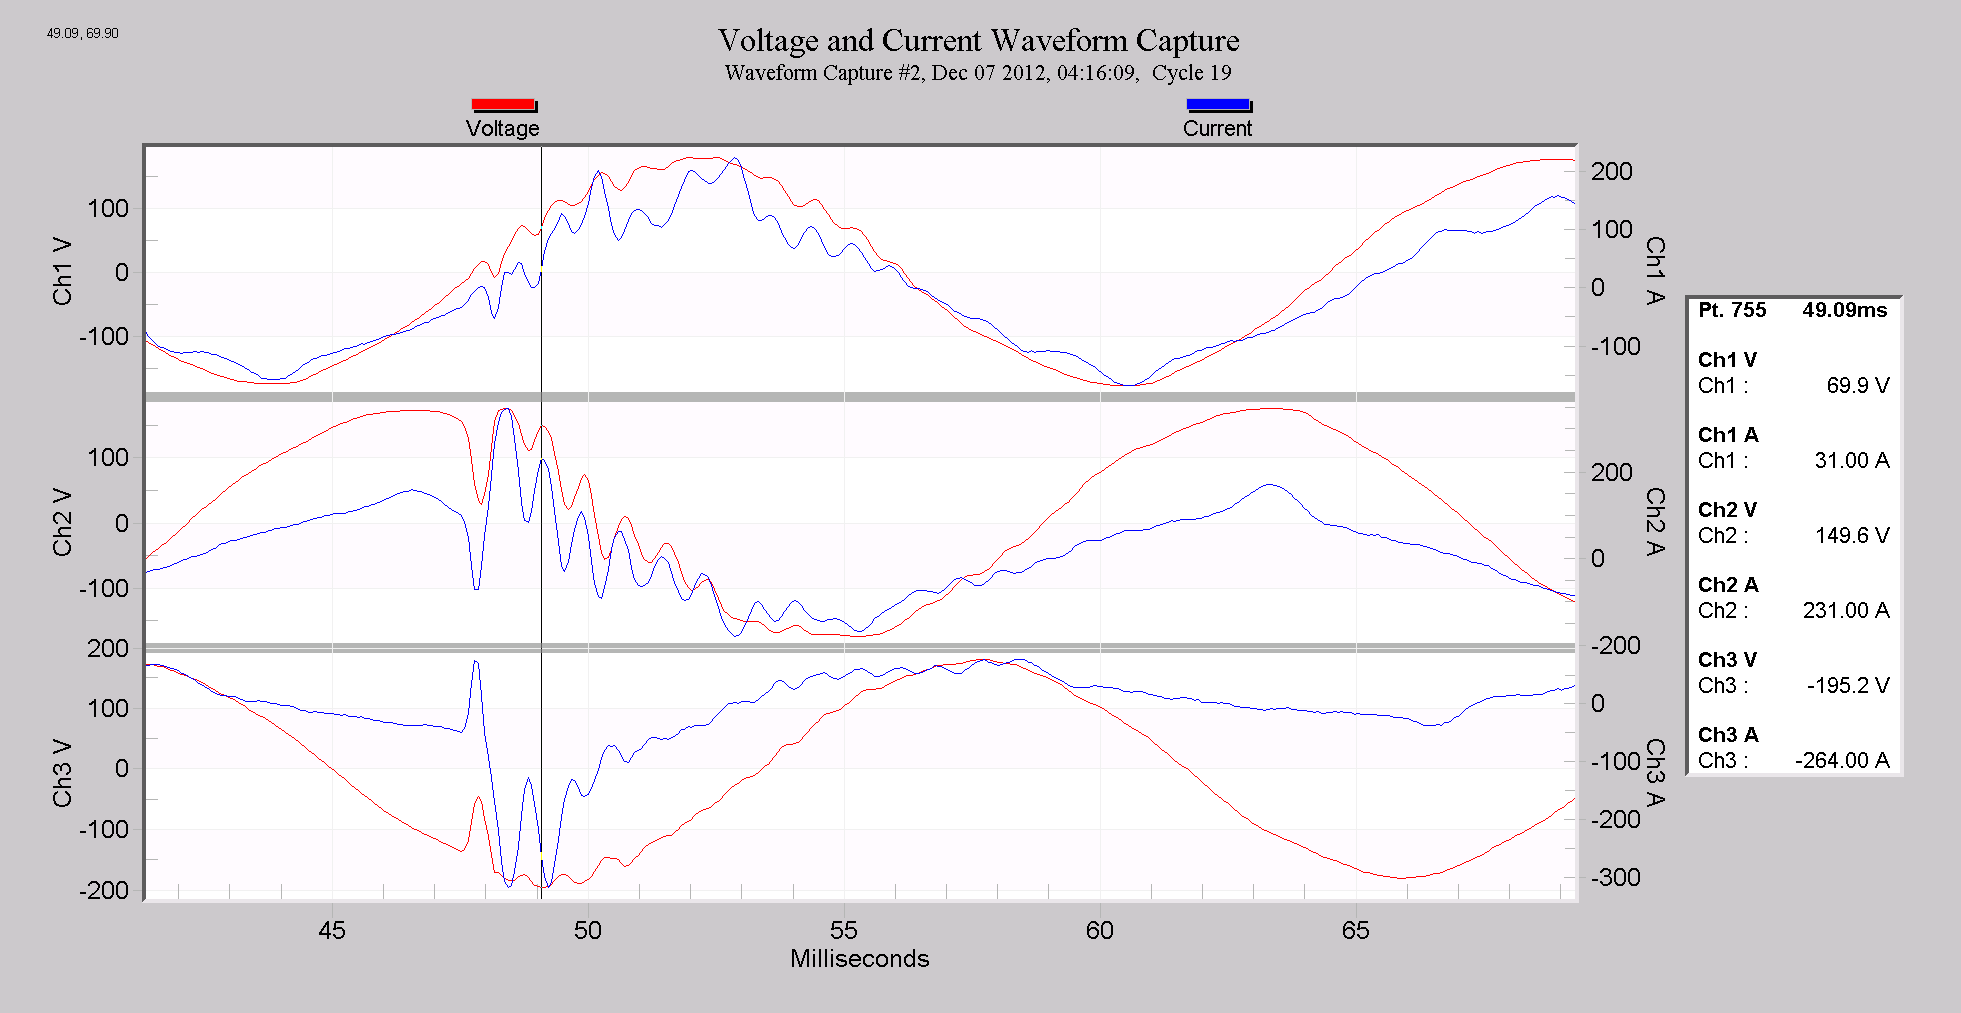
Record the value of 49.09 ms and skip the next peak (of the same polarity) to measure a complete period of the ring sine wave.
The marker in the graph in Figure 4 shows the next point in the voltage waveform on Channel 2 that will be used to calculate the ring frequency. It is point 768, at 49.93 ms. The difference between the two points in the marker table is the period of the voltage ring waveform for Channel 2 which is one complete sine wave (Figure 5). In this case that is 49.93 − 49.09 = 0.84 ms for the period for the ringing waveform.
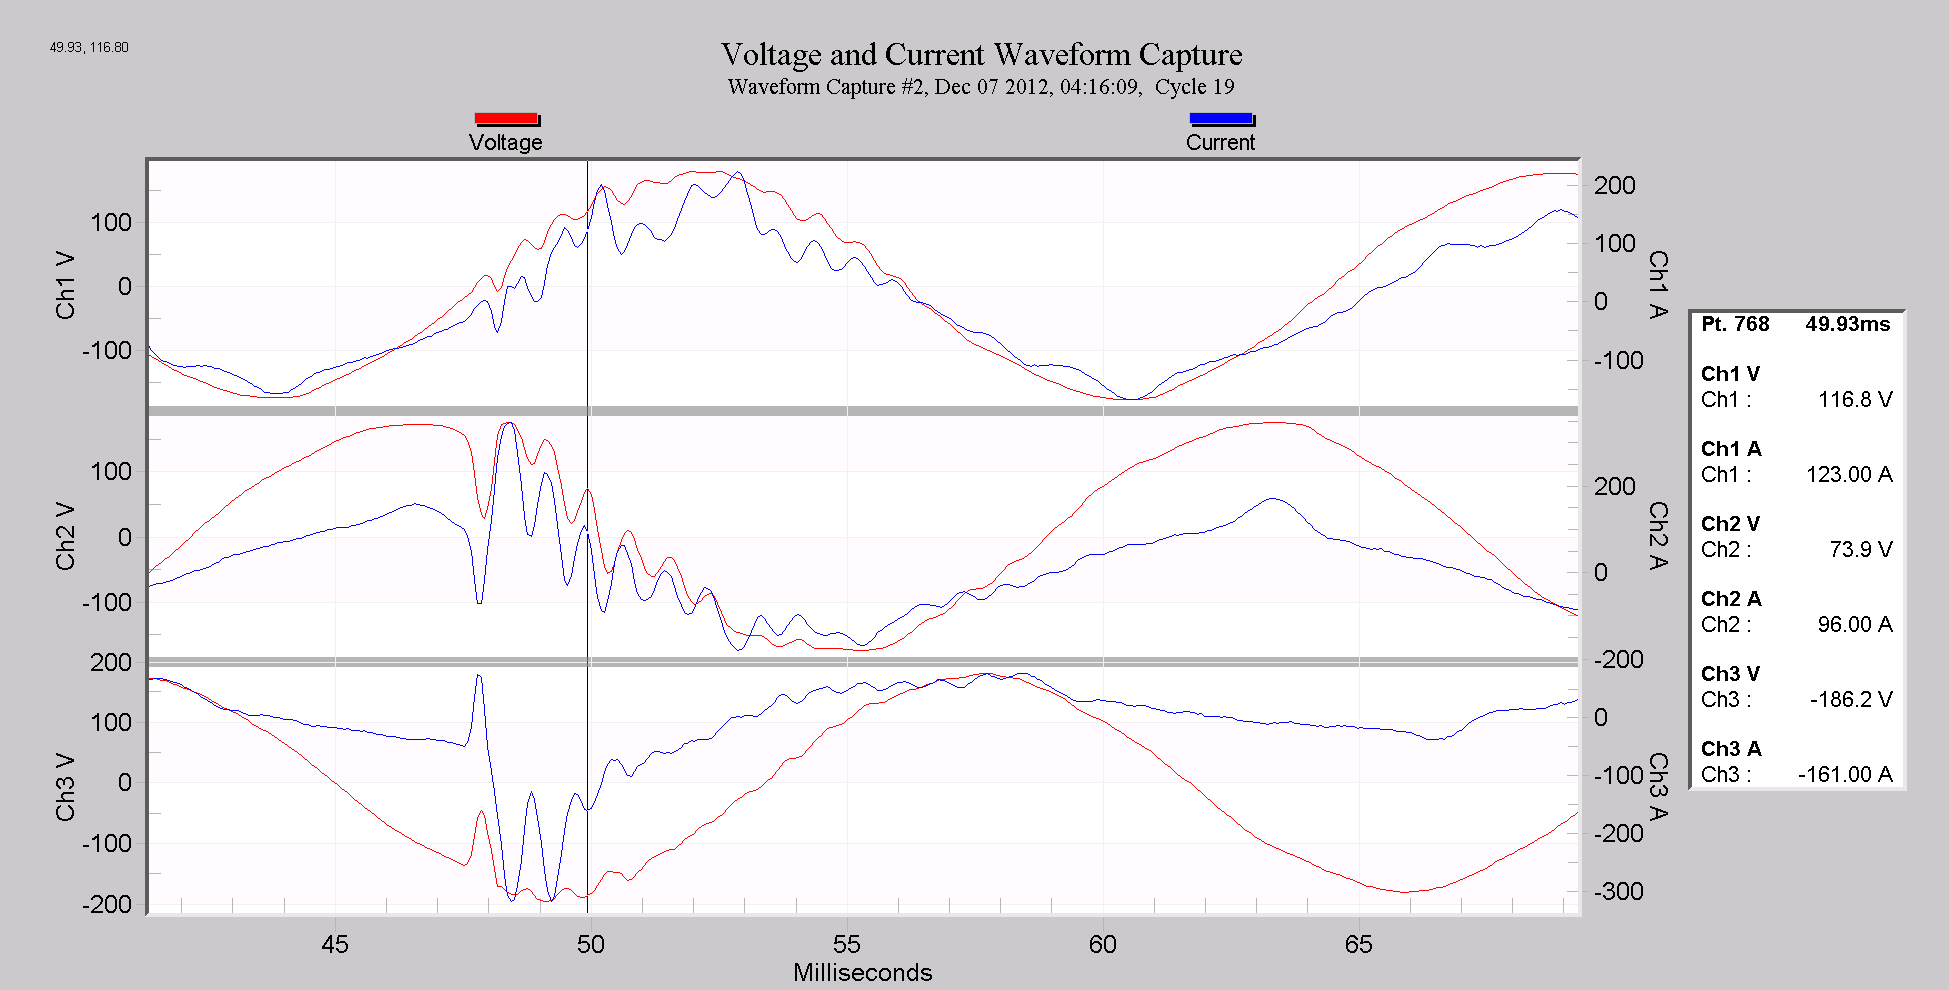
To compute the frequency of a sine wave given the period, use the simple equation that states that the frequency F is equal to 1/P, where P is the Period of the waveform. The frequency of something periodic is how many times per second it repeats. The period is the duration of one repetition, and thus F = 1/P. For example, a 60Hz sine wave repeats 60 times per second, and thus the period is 1/60 = 0.016666 seconds, or 16.666 milliseconds. Here we have 0.84 milliseconds for the period, and thus (1/84 ×10-3) = 1191 Hz for the ring frequency. Remember that the units are milliseconds, or 1 ×10⁻³ seconds.
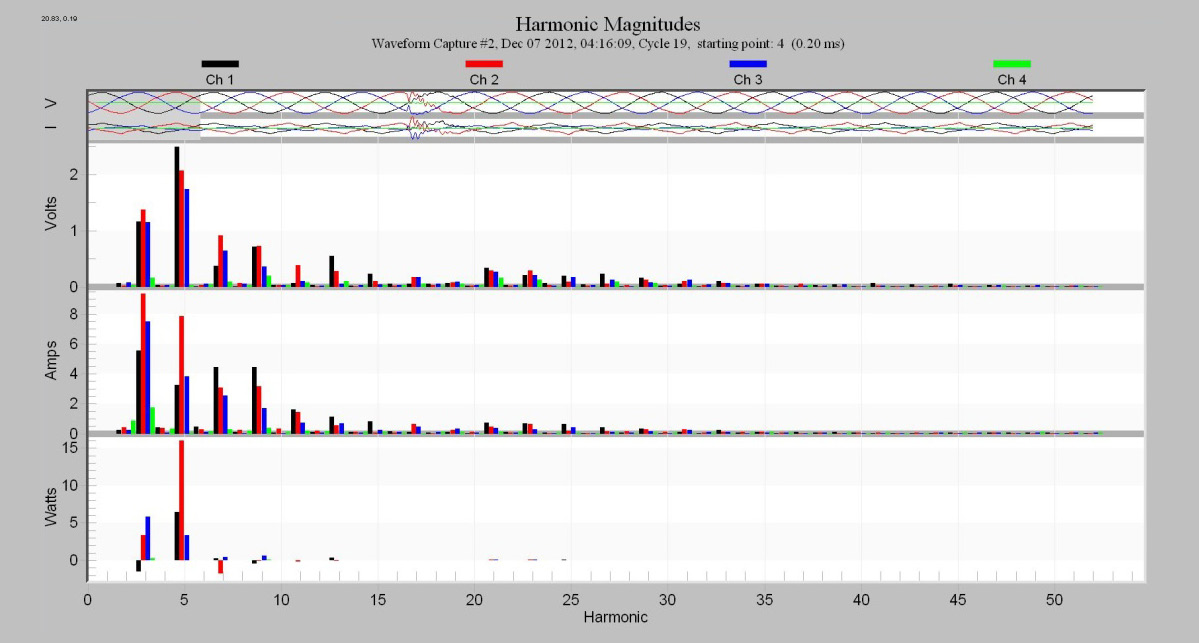
Figure 6 shows a harmonic analysis of the same waveform as displayed in the previous Waveform Capture. It is apparent that the 20th harmonic (1191/60) is elevated. Note that it has a broad peak that encompasses many harmonics. This is because the ringing is a short-term event that doesn’t last an entire 60 Hz cycle, resulting in “smearing” in the frequency domain. The waveform ring measurement gives a better signal-frequency estimate than the harmonic analysis.
Estimating Phase Shift Between Voltage and Current
Using the Point Table in the Waveform Capture function makes measuring the phase shift between voltage and current waveforms quite easy. It is usually more accurate and easier to mark where the voltage and current goes through 0 volts rather than trying to mark the peak. This is because the maximum slope (where it’s the most “vertical”) in a sine wave occurs at zero-crossing, which makes it the easiest to visually mark a certain spot. Conversely, the peak of the sine wave is the point where it’s the most flat, making a precise time point estimate more difficult. The reason for choosing the peak for the resonance calculation earlier is that it’s difficult to get a good zero-crossing estimate when the ringing sine wave is superimposed on a larger 60Hz sine wave.
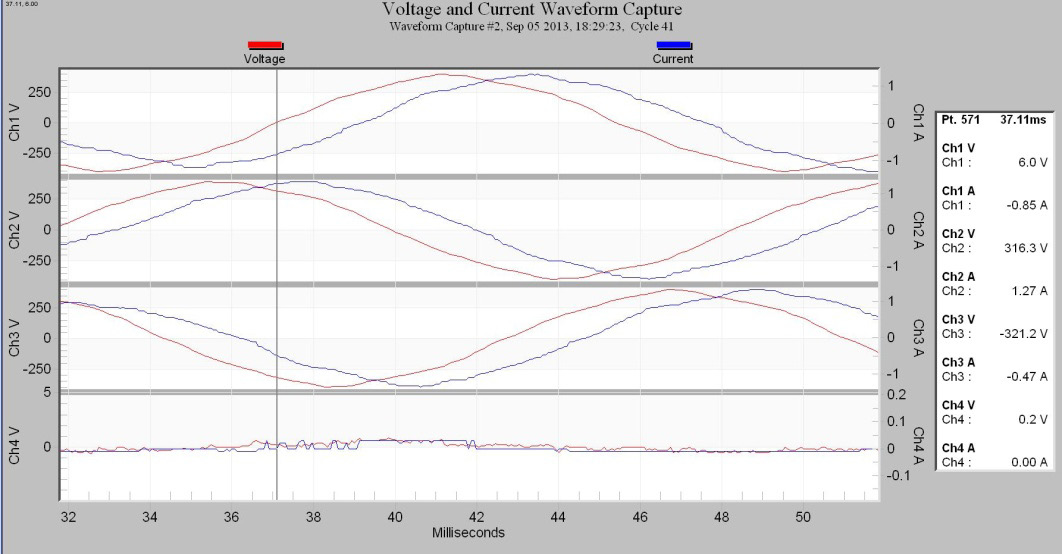
In this demonstration, the closest points where the voltage and current waveform cross zero, at 6 volts, were selected. Note that this is point number 571 at 37.11 ms.
Now, do exactly the same for Channel 1 current as shown in Figure 8. Mark the closest point to zero current. Note that Channel 1 current at point 603 is 39.19 ms.
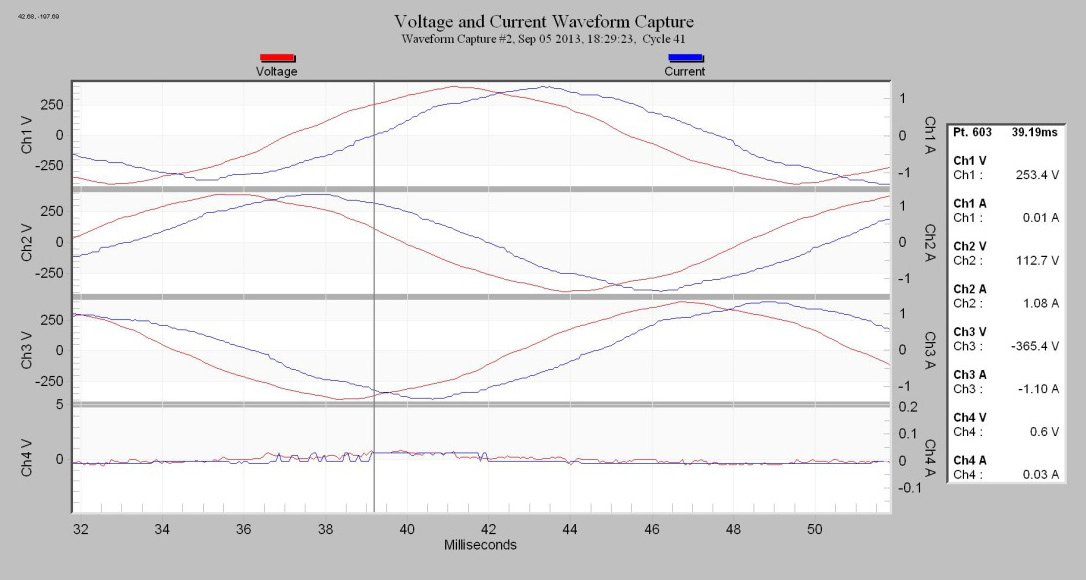
Now take the difference in time between the zero voltage crossing and zero current crossing. Here 39.19ms − 37.11 ms = 2.08 ms. This 2.08 ms is the amount time the current lags the voltage. Since the frequency of this power system is 60 Hz, the voltage travels 360 degrees × 60 in one second or 21600 degrees per second. To see the phase shift in degrees simply multiply the 2.08 ms by 21600. Here 2.08 × 10-3 × 21600 = 44.9 degrees. The power factor is equal to cosine of the phase angle so this would be 0.78 for the power factor. Using the Waveform Capture table can be very useful if the power factor and phase angle were not recorded in a stripchart. This allows you to be able to examine a file afterward and retrieve information such as the phase angle and power factor after the fact.
Estimating Crest Factor
Crest factor is the ratio of a waveform’s peak voltage compared to its RMS value. For a perfect sine wave the crest factor is equal to √2 or ~1.414. Using the Waveform Capture graph, invoke the Point Table and set the cursor to a peak on one of the current waveforms. The graph in Figure 9 was peaked on the current of Channel 1. Note the point number and time on the Point Table, point 156 at 20.18ms.
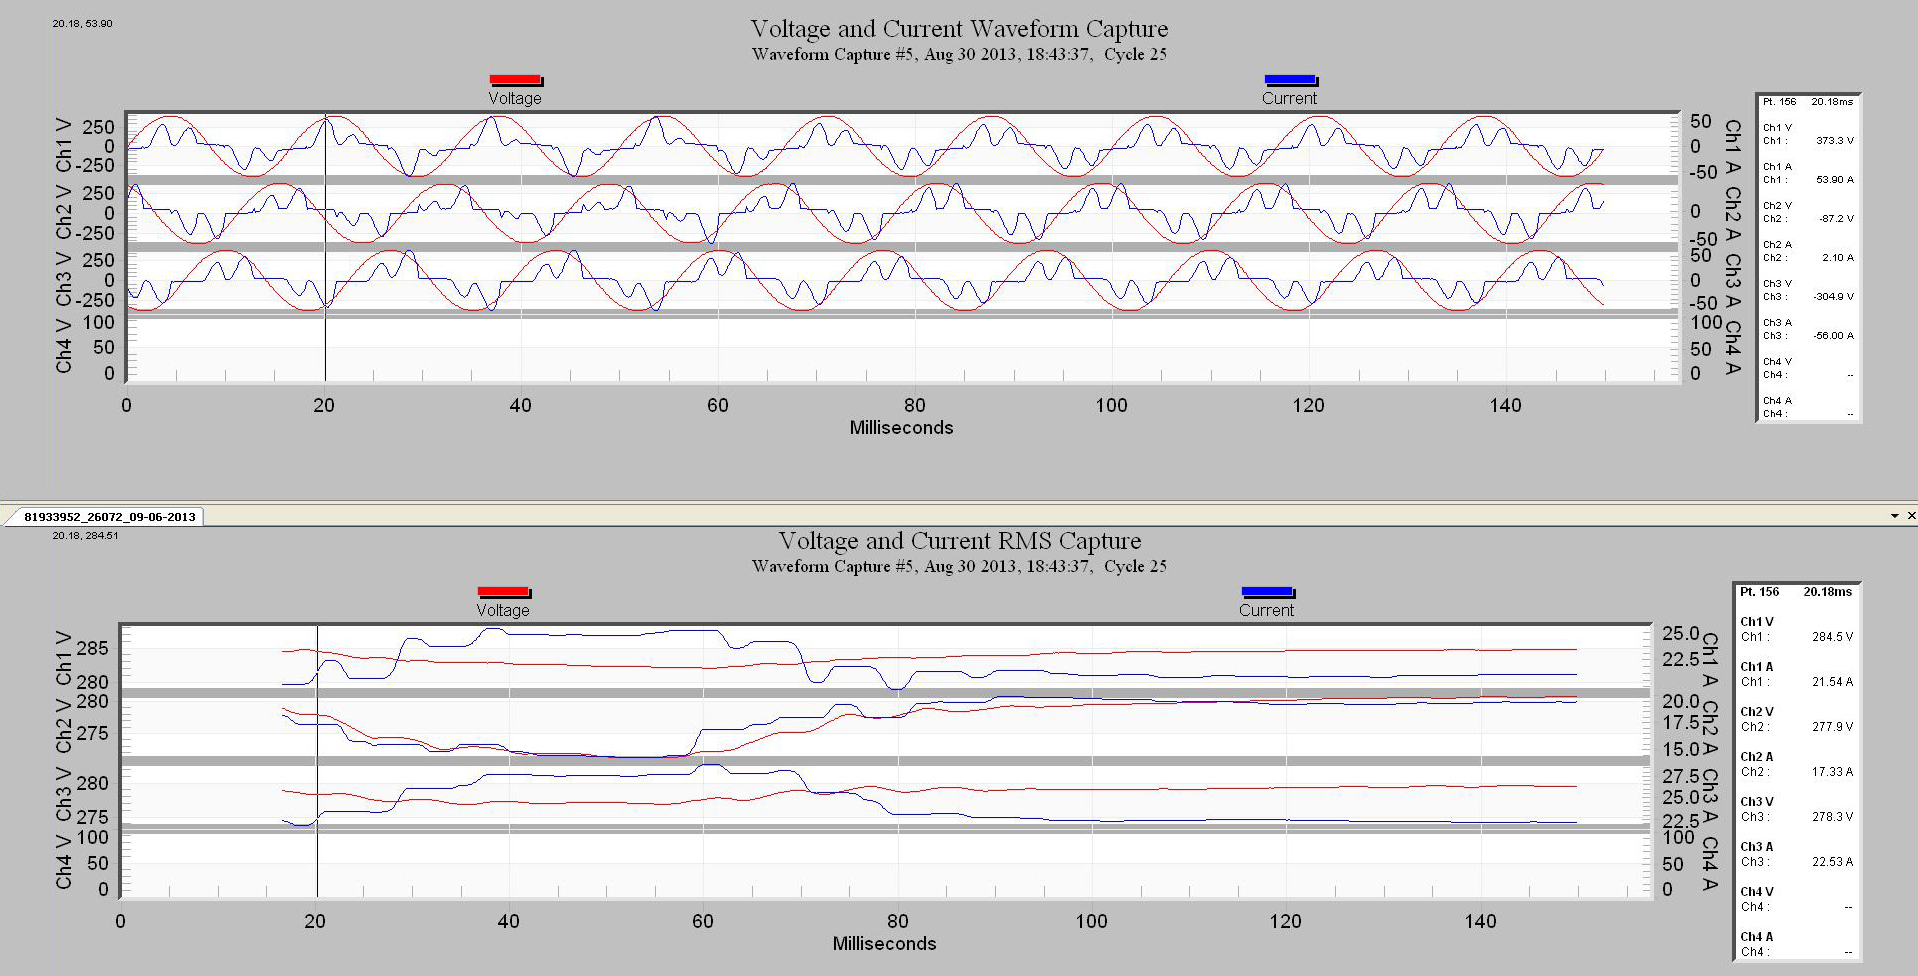
Now, using the Voltage and Current RMS Capture, go to the same waveform. Again turn on Point Table and adjust marker to the same point and time. In our case that is point 156 at 20.18ms.
Now divide the current in Point Table for Channel 1 for the Voltage and Current Waveform Capture graph by the same Channel 1 current in the Voltage and Current RMS Capture graph (Figure 10) and the result is the current crest factor. 53.90 Amp / 21.54 Amp = 2.5 current crest factor.
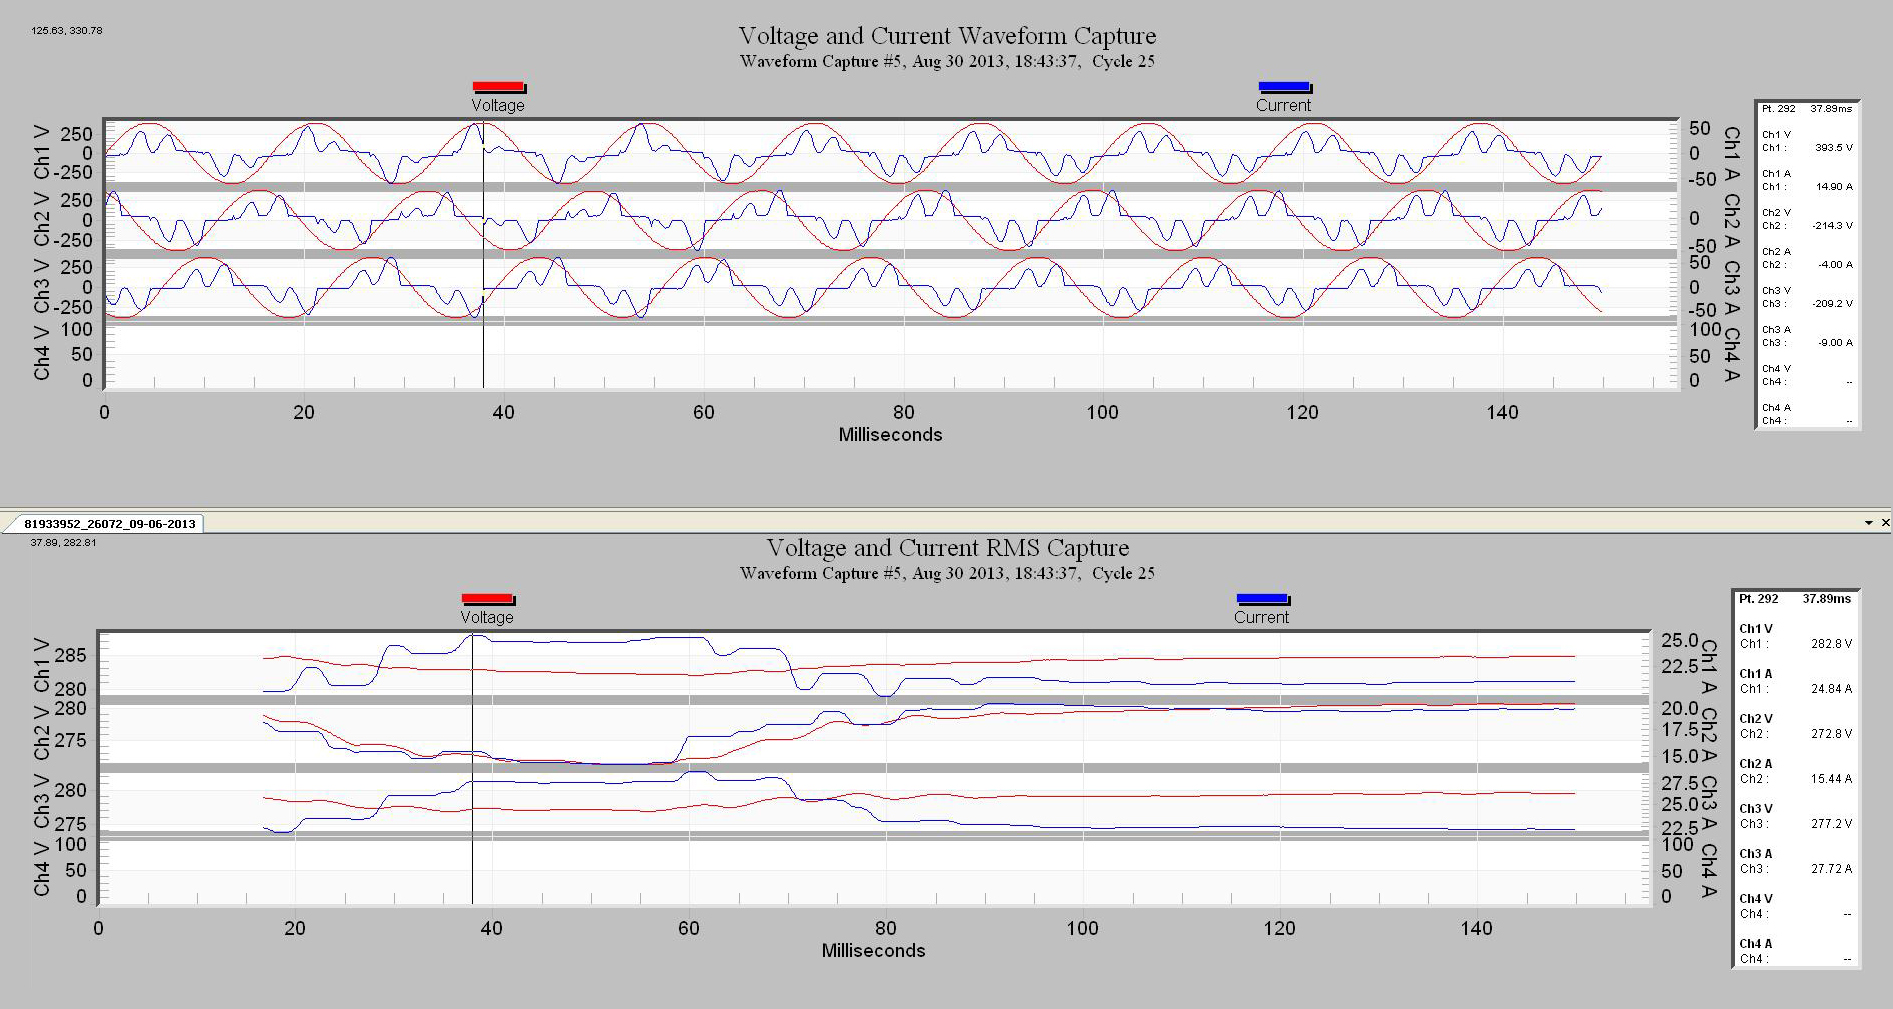
Crest factor for the voltage on Channel 1 would be 393.5 Volts / 282.8 Volts = 1.39 Crest Factor. This would indicate that the voltage is not a pure sine wave, but close. If it were a pure sinewave the crest factor would be 1.414.
Conclusion
The Point Table Function is a very valuable tool for making quantitative measurements using numerical data from points within a Waveform Capture. In some cases as with short duration ringing, the Point Table can be the tool with the superior results. Also as in the phase shift example, it is a good way to estimate phase angle and power factor especially if you did not realize you needed this information beforehand and missed recording these parameters.
