Abstract
Voltage sags are the most common power quality issue, and also the most costly for industrial power users. It’s not practical for a utility to eliminate all sags, so industrial equipment must be compatible with a reasonable level of voltage sags. The IEEE 1668 standard provides guidelines for equipment sag withstand capability, including testing protocols to ensure compliance. The standard provides guidelines that, if met, should ensure compatibility between utility voltage and equipment needs. The standard also includes a helpful primer on voltage sags, including root causes and types. An overview of IEEE 1668 is given here.
What Is the IEEE Standard 1668-2017?
IEEE Std 1668-2017 is a non-industry-specific recommended practice for voltage-sag ride-through performance and compliance testing for all electrical and electronic equipment connected to low-voltage power systems that can experience malfunction or shut down because of reductions in supply voltage lasting less than one minute. The recommended practice includes defining minimum voltage-sag immunity requirements based on actual voltage-sag data. A clause dedicated to the detailed analysis of voltage sags experienced by end users provides insight into real-world voltage sags. Testing procedures and test equipment requirements are clearly defined within this document to reflect this electrical environment, including single-phase, two-phase, and three-phase balanced and unbalanced voltage sags. This recommended practice also defines certification and test reporting requirements, including voltage-sag ride-through equipment characterization.
Background on Voltage Sags
Fundamentally a voltage sag occurs when there is a reduction in RMS voltage below a given threshold lasting from cycles to seconds. Voltage sags are important to mitigate in today’s highly developed industrial and digital economies where it is reported that a single voltage sag can cost manufacturers tens of thousands to as much as two million US dollars. Equipment sensitivity to voltage sags is attributed to the design of the equipment as well as the physical characteristic of the voltage sag.
Voltage Sag Basics
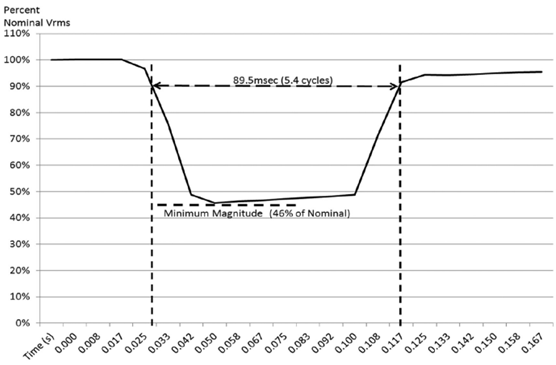
To reiterate, the two main characteristics of voltage sags are the reduction in RMS voltage and the duration of the reduction. Voltage sag magnitudes are expressed in percentage of the remaining nominal voltage. For example, if the voltage drops by 48V in a 480V system to 432V, that would be considered a sag to 90% of the nominal voltage. Per IEEE Std 1159-2009, the duration of the voltage sag is defined as the time from the RMS voltage decreased below 90% of the nominal steady-state voltage to when it returned to above 90% of the nominal steady-state voltage. The duration can be measured in units of milliseconds, cycles, or seconds. Figure 1 shows an example of a voltage sag. In the figure the duration of the sag is 89.5 milliseconds, or 5.4 cycles. This duration is measured from the time that the voltage dropped below 90% nominal voltage, to the time that it rose above 90% nominal voltage. The magnitude of a voltage sag is quantified as the percent of retained steady-state voltage.
Generally, when a voltage sag occurs there are other accompanying characteristics such as phase-shift, point-on-wave of initiation and recovery of the instantaneous voltage waveform during the sag which may influence the equipment performance as well. In most real-world applications, the user will be dealing with a three-phase system. In a three-phase system the magnitude and duration of the three voltages should be measured to obtain complete information about the voltage sag. These systems may be three-phase-to-neutral, three-phase-to-phase or three-phase-to-ground voltages. Furthermore, in a three-phase system, the voltage sags can be single-phase, two-phase or three-phase in nature. To simplify things when analyzing voltage sags in a three-phase system, it is customary to represent the voltage sag of the worse-case phase, that is the minimum voltage of all the sagged phases and the total duration for which at least one phase is experiencing RMS voltage reduction.
Characteristics of Voltage Sags
Another key characteristic of voltage sags is where on the waveform the voltage sag occurred. Although it may seem logical that the voltage sag would occur at the peak of the voltage waveform where there is the most energy, that is not always the case. Research shows that the point at which a voltage sag occurs is impartial to the voltage peaks, and happens at random, at any point on the waveform. In Figure 2 and Figure 3 there are two scenarios depicted. In both scenarios the voltage sags to 60% of nominal for three cycles. Figure 2 shows the sag starting and ending at the zero-crossing point, whereas in Figure 3 the sag starts and ends at the 90-degree point. Depending on the point of the sag on the waveform will influence the equipment’s ability to ride through a sag and the inrush current at the end of the sag duration.
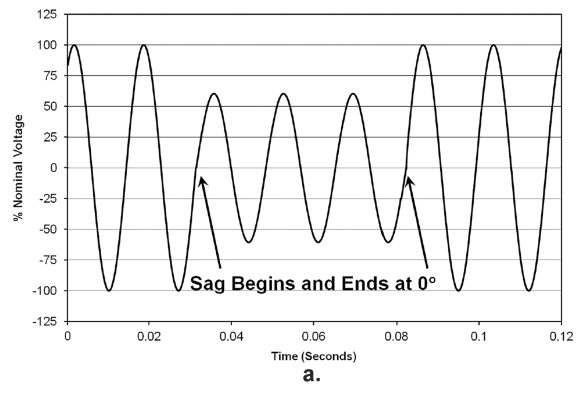
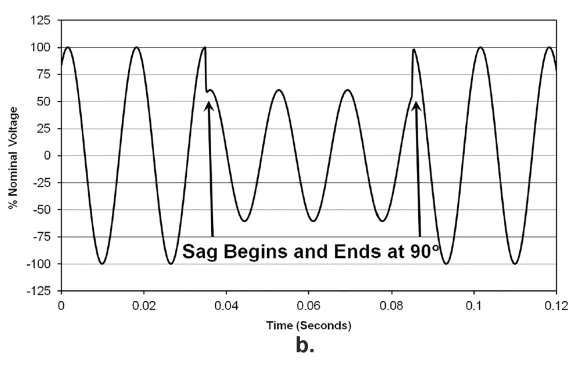
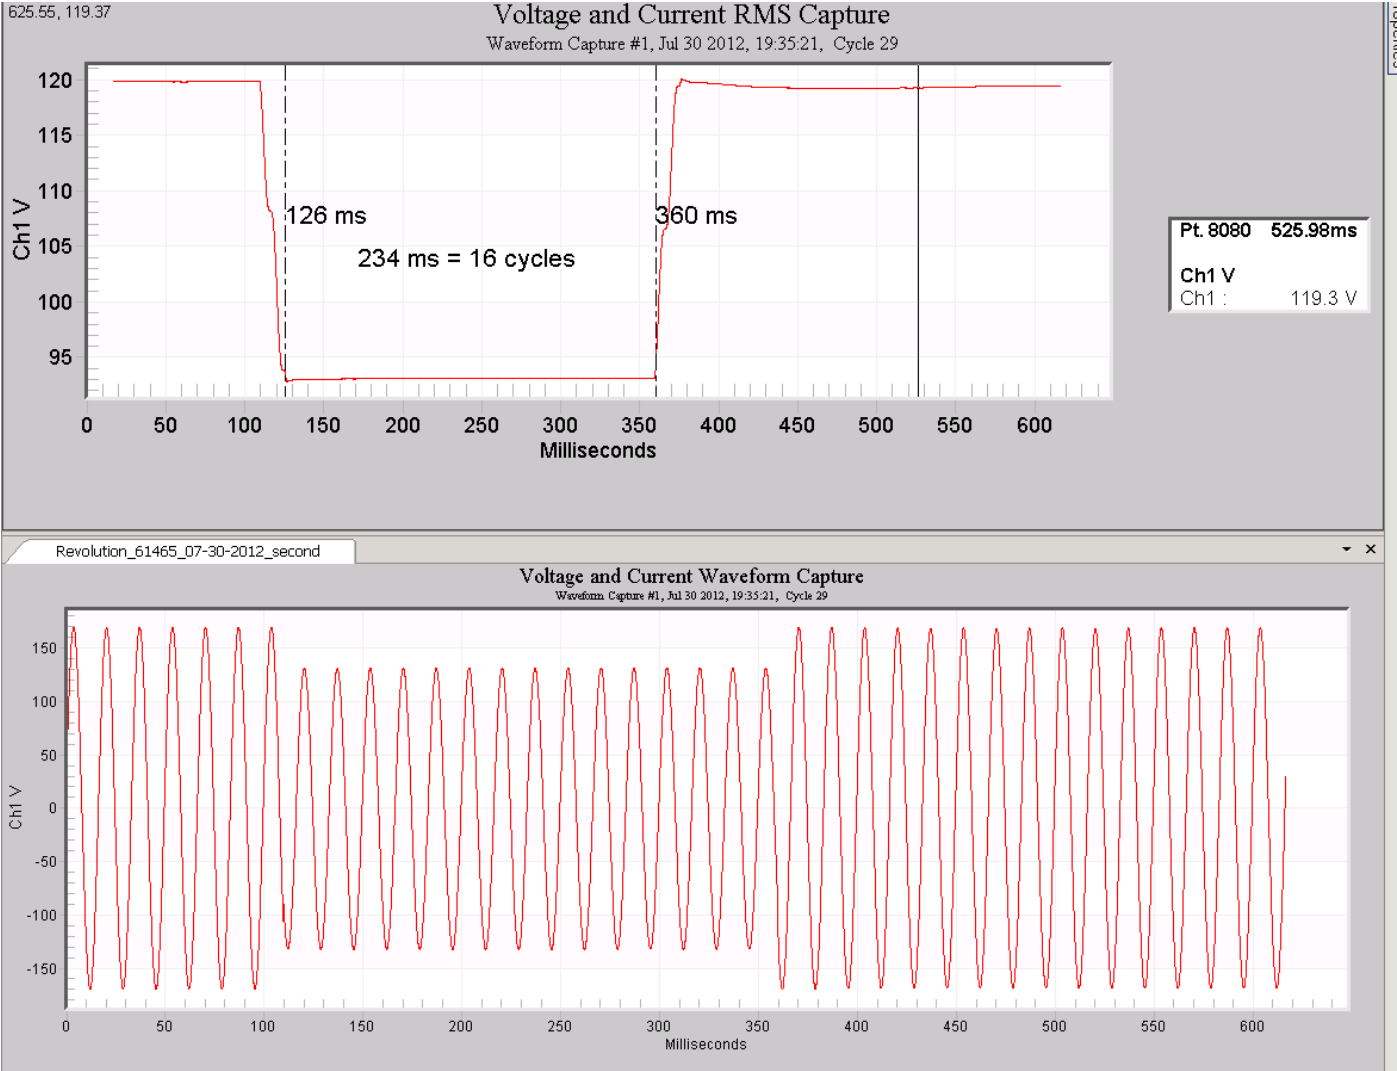
Figure 4 shows a zero-crossing voltage sag with a duration of 15 cycles with a magnitude of 78% of nominal voltage. This recording was captured with one of PMI’s recorders and displayed using the RMS capture feature of our ProVision software.
Why There Will Always Be Some Sags
In our modern world, manufacturing processes have more stringent power quality requirements than ever before. These requirements have resulted in customers expecting higher-quality and continuity of electrical power supply with significant reductions in interruptions as well as other power quality disturbances. No matter how robust the electrical distribution system becomes, nothing is perfect, and there will always be the possibility of voltage sags occurring. Two detailed studies referred to as “The Distribution Power Quality” [B5] (DPQ, also known as DPQ I) and the more recent “The Distribution Power Quality II” (DPQII) [B6] indicated the relative order of importance of the causes of voltage sags. These causes can include numerous scenarios such as equipment failure, lightning-flash density, tree branches near the power lines, animals, vehicles contacting power poles and inadequate ground resistance. These scenarios are predominantly weather related and are bound to happen, but there are methods which they can be mitigated. These methods include maintenance of equipment by utilities, tree trimming, and reducing access to animals and vehicles. Power systems can also be located underground to also reduce the rate of the voltage sags immensely.
IEEE 1668 and the SEMI F47 Curve
The goal of IEEE Std 1668-2017 is to present and recommend voltage sag test levels and test methods. This standard applies to equipment owners who want to better understand the phenomena of voltage sags. It will help them specify the voltage sag immunity needed to obtain less sensitive electrical equipment which will allow for improved ride-through for critical processes. Another group that will benefit from this standard are the system integrators, or OEMS, who are designing and building the electrical equipment. Understanding the electrical environment will allow them to test and build their equipment to be more immune to voltage sags. Lastly, test engineers need to be well versed in the standard so they can properly evaluate equipment to ensure immunity and robustness in their equipment under test.
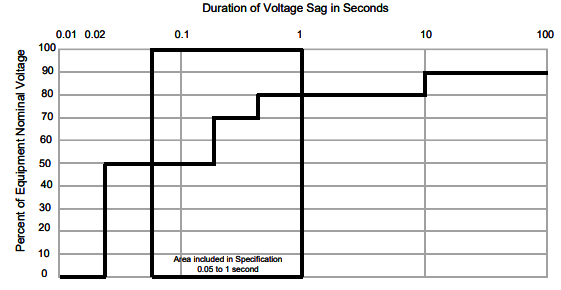
To design equipment to the IEEE Std 1668-2017, equipment should be able to withstand voltage sags and magnitudes in the acceptable range depicted by the SEMI F47 curve which is similar to the CBEMA/ITIC curves. This curve can be seen in Figure 5 and has a logarithmic x-axis and a linear y-axis. The x-axis contains the duration of the voltage sag, and the y-axis is the percentage of nominal voltage that the equipment is designed to run. All equipment designed and tested to the IEEE Std 1668-2017 should be able to withstand any voltage sags that land at or above the bold black line of Figure 5.
Conclusion
Voltage sags are an unavoidable aspect of being connected to today’s modern electrical infrastructure. No matter how far utility companies go to avoid their occurrence, there are always going to be some amount of voltage sags. Once users understand the impact of voltage sags, they can help themselves by designing and testing their equipment for robustness so they can mitigate the effects of these voltage sags. Following IEEE Std 1668-2017 and making sure equipment can ride through voltage sag magnitudes and durations outlined in the SEMI F47, will allow users to save a lot of time and money down the road.
