Abstract
Interharmonics are on the rise because of large non-linear loads and sources being introduced to the distribution network, in particular large Variable Frequency Drives (VFDs) and inverters for distributed generation. Interharmonics are very complex, making them harder to measure and analyze than some of the other power quality issues. In this paper I will cover how interharmonics can be recorded, measured and analyzed with the use of PMI’s Revolution power quality recorder and Provision software.
Defining Interharmonics
Most distributed generation, such as photovoltaic and wind turbine systems, use large inverters to convert DC to 60 Hz AC. The synthesized inverter waveform theoretically is phase locked to the incoming distribution voltage, but variations in supply and load can create non-synchronous beating effects, resulting in interharmonics.
Another opportunity for non-synchronous waveform distortion arises with modern VFDs. A VFD converts the incoming AC power into DC, then uses pulse modulation to drive the motor. The AC to DC conversion decouples the AC power frequency from the motor, and the VFD waveform is rich in harmonics. Variations in motor load or motor drive can modulate the load current, resulting in interharmonics around the standard VFD harmonic frequencies. In an older, traditional AC motor, load modulation would simply produce “sidebands” around the 60 Hz motor current. With a harmonic-rich VFD waveform, these sidebands extend through many interharmonic regions.
It is important to take steps to monitor and record these interharmonics in order to prevent them from becoming too severe. The PMI’s Revolution is an ideal instrument for recording interharmonics and much more. The Revolution has a large memory capacity along with a high sample rate allowing for a long monitoring time with very high resolution wave capture along with a 51 harmonic capability. It also has 4 independent voltage and current channels, a 600 volt CAT IV rating; UL listed and is very environmentally rugged and compact. This combination makes the Revolution ideal for recording interharmonics in the field.
The Latin prefix “Inter” has the meaning of between or among. Standard harmonics are multiples of the fundamental frequency (60 Hz). Interharmonics by definition are periodic distortions of the 60 Hz sine wave with periods that are not multiples of the fundamental. Interharmonics, depending on their origination, can sometimes appear as a discrete frequency or as a wide-band spectrum. IEEE 61000-4-7 defines interharmonics as 5 Hz wide bands, extending from 5 Hz up to 3115 Hz. Bands that fall on harmonic frequencies, for example 180 Hz (3rd harmonic) are also harmonics.
There are several common causes of interharmonics. Some of these causes can be from mechanical vibrations in large motors inducing a back EMF into the system, direct injection of non-synchronous signals, and other interference effects from AC to DC systems or beats from where two different AC systems are combined. Also large non-synchronous loads, such as the type an arc type welder may cause, in which the instantaneous impedance varies in time from almost infinity to extremely low unrelated to the drive voltage phase.
Motors that are controlled by variable frequency drives, which by themselves are already nonlinear, are compounded by the motor’s mechanical vibration. This vibration can be reflected back at a non 60 Hz rate due to the physics of the motor and load to the motor sometimes even finding mechanical resonance. This load change due to mechanical vibration can cause a variation in the load current or back EMF.
Interharmonic frequency components with enough amplitude can have a very negative impact on power quality causing heating effects similar to standard harmonics. Some other issues interharmonics can create besides transformer heating are the overloading of series tuned filters and outlet strip filters along with flicker and communication interference issues. Low frequency beating effects can cause subtle stability issues whose effects are not fully characterized yet.
Recording Interharmonics
Recording with the Revolution starts with the proper initialization of the Revolution with PMI’s ProVision software. Make sure that your ProVision software is version is current; the interharmonics measurement was a new addition and was not part of ProVision’s original release. ProVision normally updates itself automatically, but if the auto-update features is disabled or blocked by network filters, it may need an update – ProVision 1.61 build 4800 or later is required. ProVision also downloads firmware updates automatically, and prompts the user if the recorder is out of date, but if that is disabled or blocked, check to make sure the Revolution firmware is version 5.66 or later.
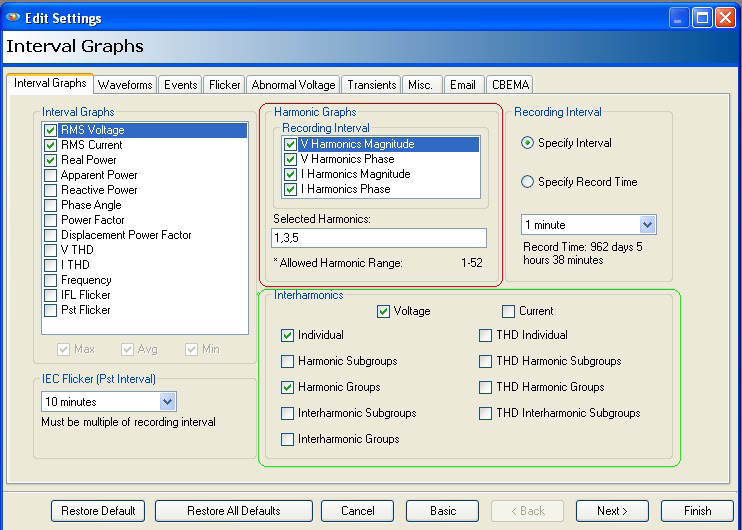
The first step is to open the initialization dialogue for the Revolution in ProVision. In order to do this, you must right click the recorder in the Device Tree, and then from the resultant context menu, select the option “Initialize”. The interharmonics settings will be found under the “Interval Graphs” settings screen. This is the first advanced setting screen that is displayed.
Multiple types of interharmonics settings are offered by ProVision. They include harmonic groups, harmonic subgroups, and individual interharmonics along with the THD values.
In Figure 1, under Internal Graphs, there are two areas where the interharmonics are set up in the initialization process. The settings surrounded by the red box indicate which harmonics are to be recorded. The settings surrounded by the green box indicate interharmonics settings that are to be recorded.
With the Revolution, there are two options as far as making recording of interharmonics. The more direct approach is by recording an individual strip chart trace for each specific interharmonic. Another way, a little less direct, is using the periodic waveform capture. If the more direct strip chart method is used, the Revolution computes each 5 Hz bin using 12 cycles as per IEC 51000-4-7 for each channel of current and voltage. Then the harmonic and interharmonics groups and subgroups can be computed and logged by the recorder from the raw measurements. THD measurements are generated by averaging readings at a rate of once per second. The average measurement is then sent to the strip chart processing system. Depending on what function are enabled, any interharmonic groups, or subgroups average is then recorded at regular strip chart intervals along with other more commonly used strip chart features, such as power, RMS voltage and current.
It is important to note that the amount of recording time is directly related to the recorder’s memory and the amount of information that is being recorded. Even with a Revolution with 1GB of memory, the interharmonic strip chart can eat up a lot of memory fast, so it is important to check the estimated recording time after the intended number of options have been picked during initialization.
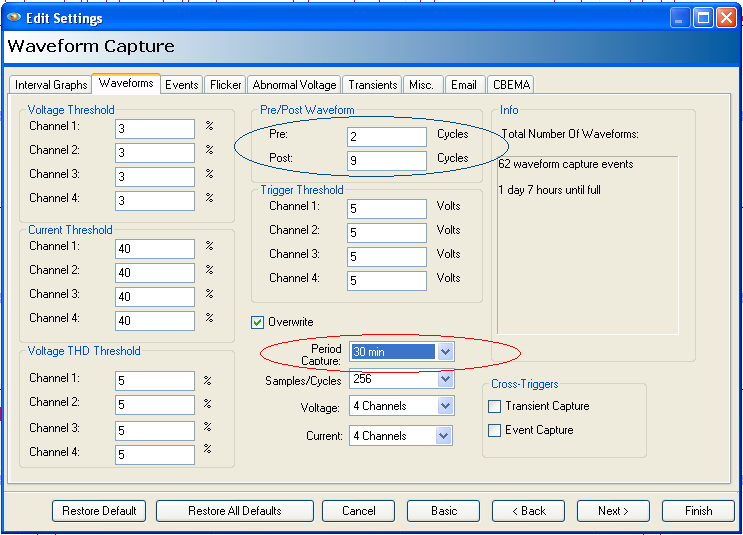
If the length of recording time becomes an issue, a second method of taking a waveform snapshot at a regular interval from as small as 1 minute to as much as 4 weeks. In the waveform capture setup example in Figure 2, 30 minutes is used, circled in red, giving a full day and 7 hours of data before filling the memory. This method is called waveform capture and it is a good way to be able to collect detailed data on the entire frequency spectrum on a system by sampling it every so often. This is a good way to keep an eye on what is happening without burning through too much memory thus shortening the time limit on the recording. Changing the capture period from 30 minutes to 4 hours would extend the recording time from just over a day to over 10 days.
One important point when using the second method, the Waveform Capture for interharmonics, it is necessary to capture 12 complete cycles to generate the 5 Hz interharmonic data. In Figure 2, the Pre and Post numbers are circled in blue to show the proper setting. There are 2 pre cycles, the original cycle and 9 post cycles to insure the 12 cycles total.
Other Recommendation and Settings
Balancing the amount of data needed for good analysis along with memory capacity and recording time can sometimes be very challenging especially dealing with interharmonics. It is usually better to decide on whether you are going to record interharmonic groups, harmonic groups or subgroups, and only record one at a time.
Using the Total Harmonic Distortion values alone can reveal if distortion is going to be a problem to be dealt with, but does not provide any breakdown on the harmonic content by itself. The THD values are spread out over the entire spectrum, so no matter what harmonics are selected, they don’t require as much memory for the useful information they can provide.
Harmonics plus interharmonic group provides detail on interharmonic sources.
For the maximum detail along with the greatest memory usage, raw harmonics and interharmonics for the full 5 Hz resolution throughout the entire band of interest provides the maximum detail.
If recording time and memory requirements are a limitation, if possible, it is wise to narrow down the region of interest, such as using the 3rd and 7th harmonics and surrounding interharmonic, thus allowing the recording time to be much longer for the same amount of memory used. For a load like a VFD, with a known harmonic pattern, limiting the enabled harmonics and interharmonics to those can be useful. For example, a 6-pulse VFD or converter typically has a harmonic pattern of 6n±1, where n is whole number. That results in harmonics at the 5th and 7th, 11th and 13th, 17th and 19th, etc. Recording just those harmonics and the surrounding harmonics can be a good method to limit memory usage or extend recording time.
IEEE 519 recommends the interharmonic and harmonic subgroups, which is a good compromise between too much details and too little. These groups give good separation between harmonics and true interharmonics.
The new IEEE 519-2014 standard recommends 3 seconds for the “Very Short Time” analysis and 10 minutes for “Short Time” analysis. This makes two good choices for stripchart intervals being 3 seconds or 10 minutes.
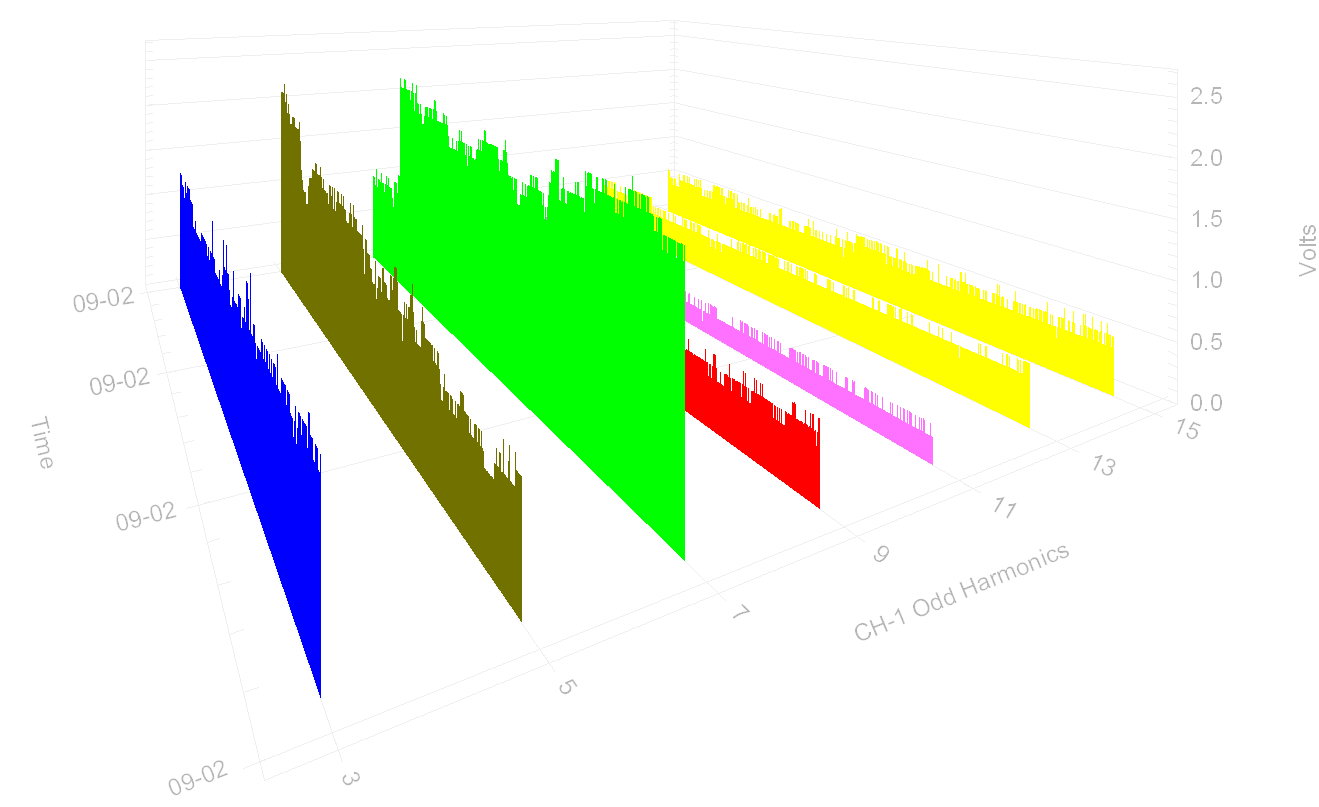
Provision offers a 3D graph along with the regular interval graph (see Figure 3). The fastest way to visualize all the harmonics and interharmonic data at once is with the 3D graph feature. In order to select the 3D Graph, choose Graph 3D Harmonic Graph from the menu and then choose a channel of voltage or current.
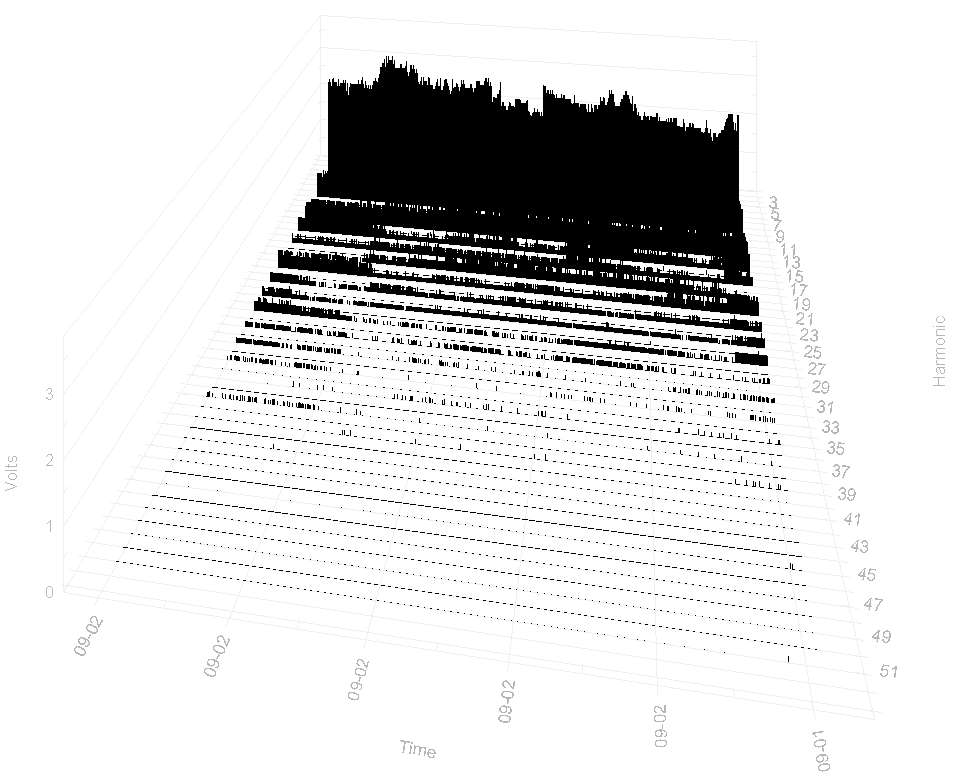
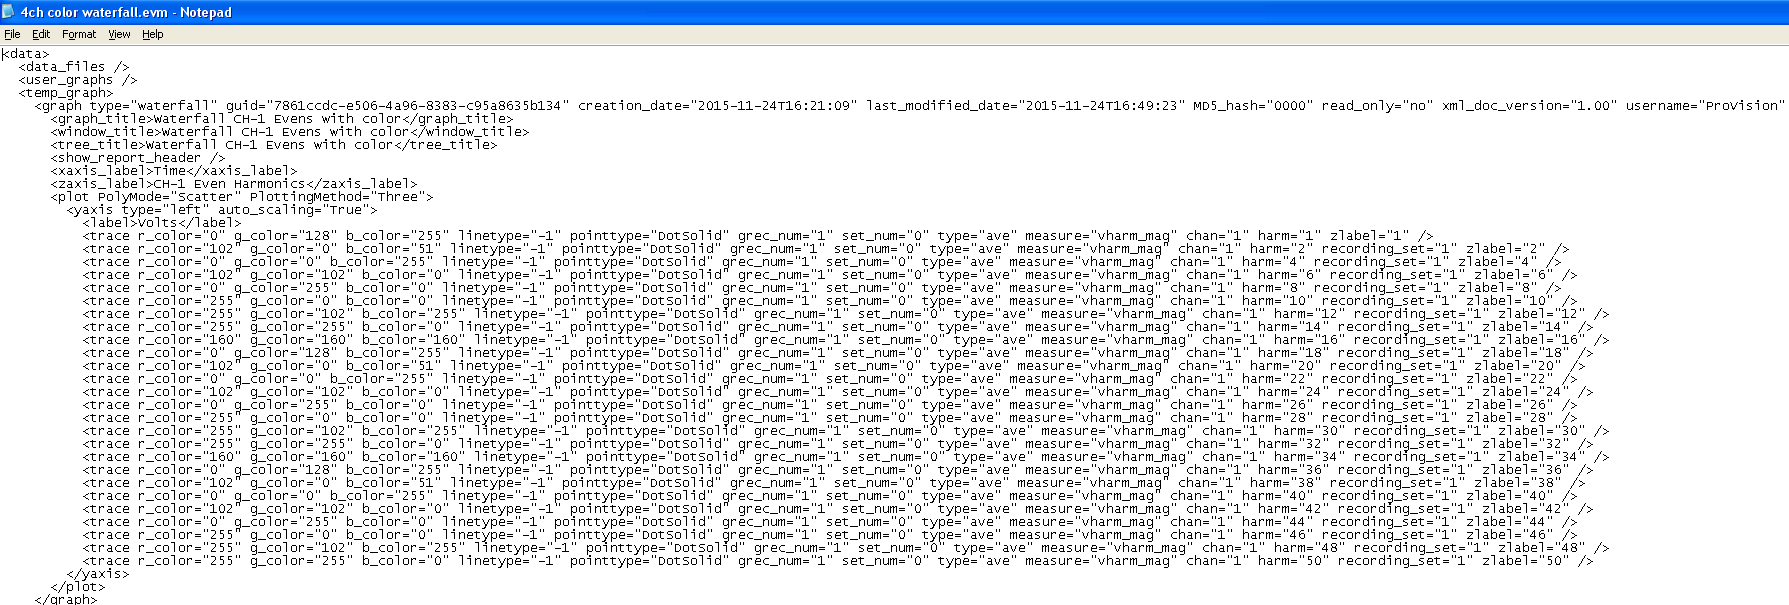
You can also access the 3D graph via the header report instead through the menu. The only difference is that the interharmonic data are then visible by default. The 3D graph can be rotated for a better view angle. For better contrast, colors can be assigned to the 3D graph file with a text editor, such as notepad, save it with an .evm extension and imported into ProVision using the Custom Graph function. The graph colors may also be changed on an individual plot with the Graph Customization dialog.
In order to modify the data displayed, just right-click on the graph and from the resultant context menu, select interharmonics. This will open a new window allowing you to see a listing for each harmonic and interharmonic trace available in the recording file. At this point, each individual trace can be displayed or can be made invisible by changing the checkbox next to the traces name. By selecting the OK button, the trace can be redrawn.
3D Graphs
Using Notepad to manually edit the harmonic’s color value for better contrast is shown in Figure 4.
3D Graph with modified colors imported via Custom Graph for better contrast of the data is shown in Figure 5.
Conclusion
Interharmonics due to their nature and complexity can be difficult to measure and analyze compared to other power quality issues. With the help of some basic PQ knowledge, good recording instruments and techniques it is possible to record, measure and analyze harmonics and their related interharmonics components. With PMI’s Revolution product, with its fast sample rate and large memory capacity and small physical size, it is the perfect instrument to record a multitude of power quality issues including interharmonics. A Revolution along with ProVision software can allow an operator to initialize the recorder in a way to get the most beneficial data needed to analyze an interharmonic issue consistent with the IEEE 519 standard. After the proper data has been recorded, ProVision has a 3D graphic mode allowing the data to be viewed in a way to visualize all the harmonics and interharmonics at once. This is a very useful feature to get an idea of the interharmonics issues in a quick glance. Sometimes when viewing the 3D graph from different angles, some of the information may become blocked. ProVision makes it easy to rotate the 3D display, so to display the information from the best vantage point.
