Abstract
Utility customers who are expanding operations or adding load must comply with National Electric Code Article 220 to determine if any electrical upgrades are needed. Many customers will ask the utility for help to generate the data specified in NEC 220.87. The method for recording this data is shown here, along with other monitoring recommendations for customers that are adding significant new load.
NEC 220.87 Requirements
Article 220 of the National Electric code concerns “Branch Circuit, Feeder, and Service Calculations”. For new construction, there is no existing load data, and Article 220 goes into detail on estimating branch-circuit and feeder loading based on load type and other factors. When expanding an existing facility, there are more options. A similar analysis for existing and new loads can be performed as per the process in Article 220. However, these estimates are very conservative. Section 220.87, shown below from the NEC, provides a means to measure the existing loads to get a more accurate assessment of actual branch circuit loading:
220.87 Determining Existing Loads. The calculation of a feeder or service load for existing installations shall be permitted to use actual maximum demand to determine the existing load under all of the following conditions:
The maximum demand data is available for a 1-year period.
Exception: If the maximum demand data for a 1-year period is not available, the calculated load shall be permitted to be based on the maximum demand (measure of average power demand over a 15-minute period) continuously recorded over a minimum 30-day period using a recording ammeter or power meter connected to the highest loaded phase of the feeder or service, based on the initial loading at the start of the recording. The recording shall reflect the maximum demand of the feeder or service by being taken when the building or space is occupied and shall include by measurement or calculation the larger of the heating or cooling equipment load, and other loads that may be periodic in nature due to seasonal or similar conditions.
The maximum demand at 125 percent plus the new load does not exceed the ampacity of the feeder or rating of the service.
The feeder has over-current protection in accordance with 240.4, and the service has overload protection in accordance with 230.90.
The key data required is the maximum demand for the location over a one year period. In theory this could be available from some AMI meter systems, but even if the peak 15 minute demand is 1) available for RMS current or kVA (as opposed to billing kW) by the AMI meter, 2) reliably sent each time over the course of a year, and 3) stored and retrievable from the AMI back-end software, a more detailed look than the single value for peak demand can be very useful. A full recording is especially for large customers, or those with complex or sensitive loads.
Gathering the Data
The NEC 220.87 requires, at a minimum, logging RMS current at 15-minute intervals. This is a simple task for any modern PQ recorder, but recording more than the bare minimum is highly recommended. A recommended recorder configuration is shown in Figure 1. The items enclosed in green are needed for the NEC requirement and include RMS current. To complete the power survey, real, reactive, and apparent power are also enabled, along with power factor and RMS voltage. A key parameter is circled in yellow – the 15-minute interval, to match the demand period in the NEC.
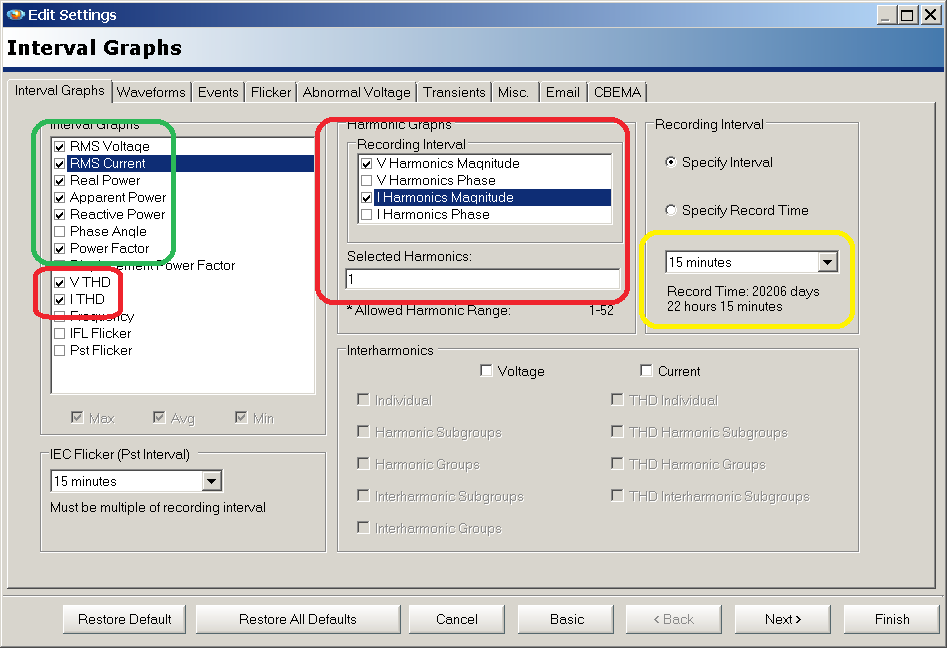
If using a recorder that supports harmonic recording, a 30-day survey is a perfect opportunity to gather data on harmonic loading. Total demand distortion (TDD) is the metric that quantifies the amount of current harmonics relative to the existing peak demand. If the demand is about to increase, looking at the existing TDD can reveal whether there may be harmonic problems with that increased load. The items circled in red in Figure 1 are the minimum needed to compute TDD. These do not require much additional memory. Voltage and current THD are the basics for measuring THD, and the first harmonic is needed for an accurate TDD measurement. Although not sufficient for a formal IEEE 519-2014 harmonic analysis, in many cases just this basic information can rule out harmonic problems in simple cases (as described in A Simplified Approach to IEEE 519 Harmonics). If an impending harmonic problem is discovered from the initial survey, a more focused harmonic investigation can be launched.
In most cases the monitor should be set at the service entrance. This is often equivalent to the IEEE 519 “point of common coupling”, except possibly for the voltage drop across the service drop itself. If monitoring at the distribution transformer secondary, be sure to separate the monitored customer from any others. This is less likely in a commercial or industrial situation, but the NEC recording is to determine facility loading for panel, breaker, and wire sizing, not the transformer itself. If multiple customers are fed from the same transformer, a separate recording may be needed to determine total transformer load (or the fourth channel, if available, can be used for total phase current for one phase). The customer is usually not directly concerned with the utility transformer during an expansion, but the utility is.
It’s important to select a suitable current probe and range. Metering CTs with a 5A secondary call for the TLAR clamp and the 20A range, while high current monitoring is best with the Flex CT and ranges from 1000A to 5000A. The main purpose of the recording for NEC 220 purposes is current logging; a poor choice of range or CT can invalidate the results. The paper Measuring Current – Best Practices gives some details on optimizing current resolution.
Analyzing the Data
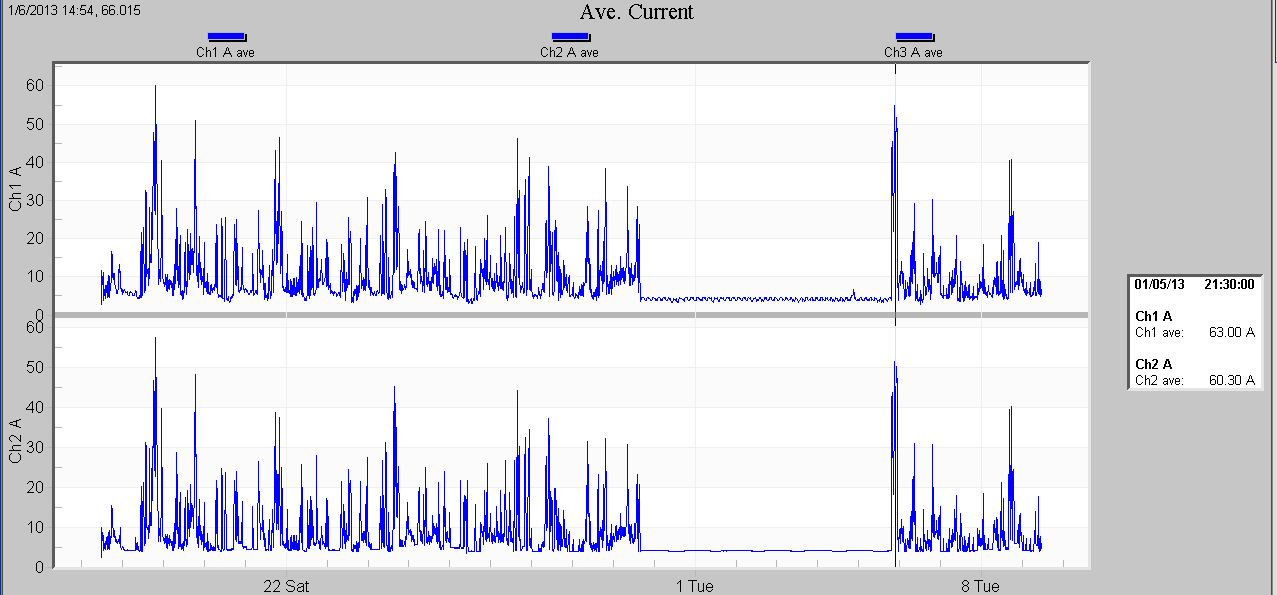
The bottom line result for NEC 220.87 is the peak 15-minute demand for the highest phase, in a 30 day period. The ProVision RMS current graph is the easiest method to check this. Only the 15-minute average is needed – one cycle max values aren’t relevant to the NEC loading calculations. In ProVision choose Graph, RMS Interval, Overview, Average, Current to just plot these values, as shown in Figure 2 for a single phase location. Here the peak demand is 63A for channel 1, the highest of the two. From a transformer loading perspective, the 63A may not be as important since the current is under 20A for the bulk of the recording, and rarely exceeds 40A for more than one or two 15 minute periods. The NEC is more concerned with overcurrent protection and wire heating, where a single 15-minute excursion is more serious.
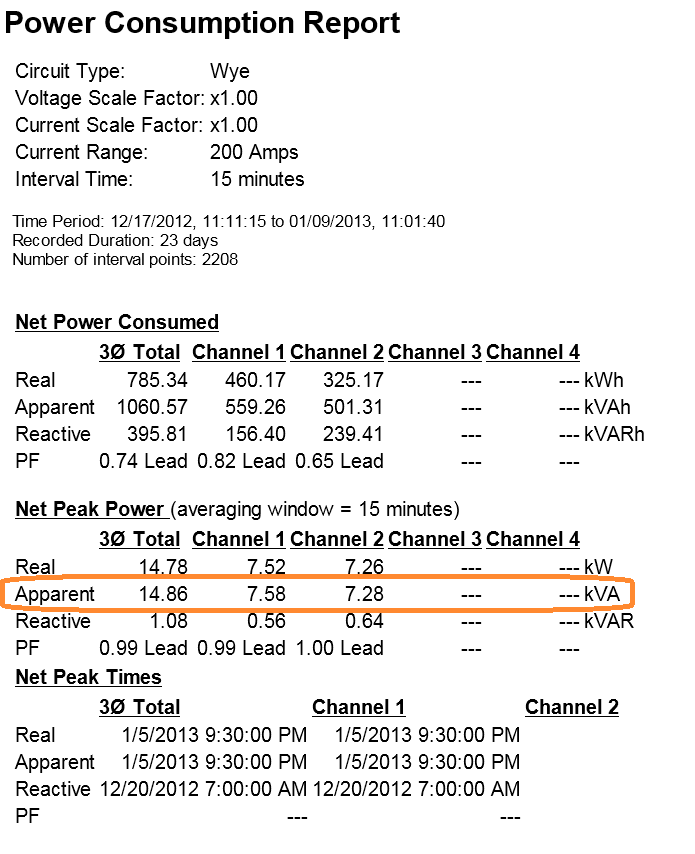
The Power Consumption report also gives useful 15-minute peak demand information. Shown in Figure 3 for the same dataset, the key statistic is the “Net Peak Power” (circled in orange). This is shown for the single or 3-phase total, as well as for each individual channel. The total demand is more often used for transformer sizing, but the largest individual phase is required by the NEC, again because it’s the individual phase conductors and overcurrent protection that are of interest. Matching the RMS current stripchart, channel 1 is the highest, at 7.58 kVA, or 7580VA/120V = 63A. When using power data for NEC loading calculations, use the apparent power (kVA), not real power (kW). Conductor heating directly relates to RMS current and (for a fixed nominal voltage) apparent power. Using real power may be misleading – if the power factor is poor, the real power will be lower than the apparent power, thus not indicative of the true current loading on conductors and breakers.
Once the maximum demand current is determined, multiply by at least 1.25 as per NEC 220.87(2). Any other knowledge of the loads, such as seasonal heating/cooling trends that may not be present in the 30-day recording, or other special situations should be taken into account for the maximum demand current estimate. This value may be combined with the proposed new load for planning purposes.
Going Further
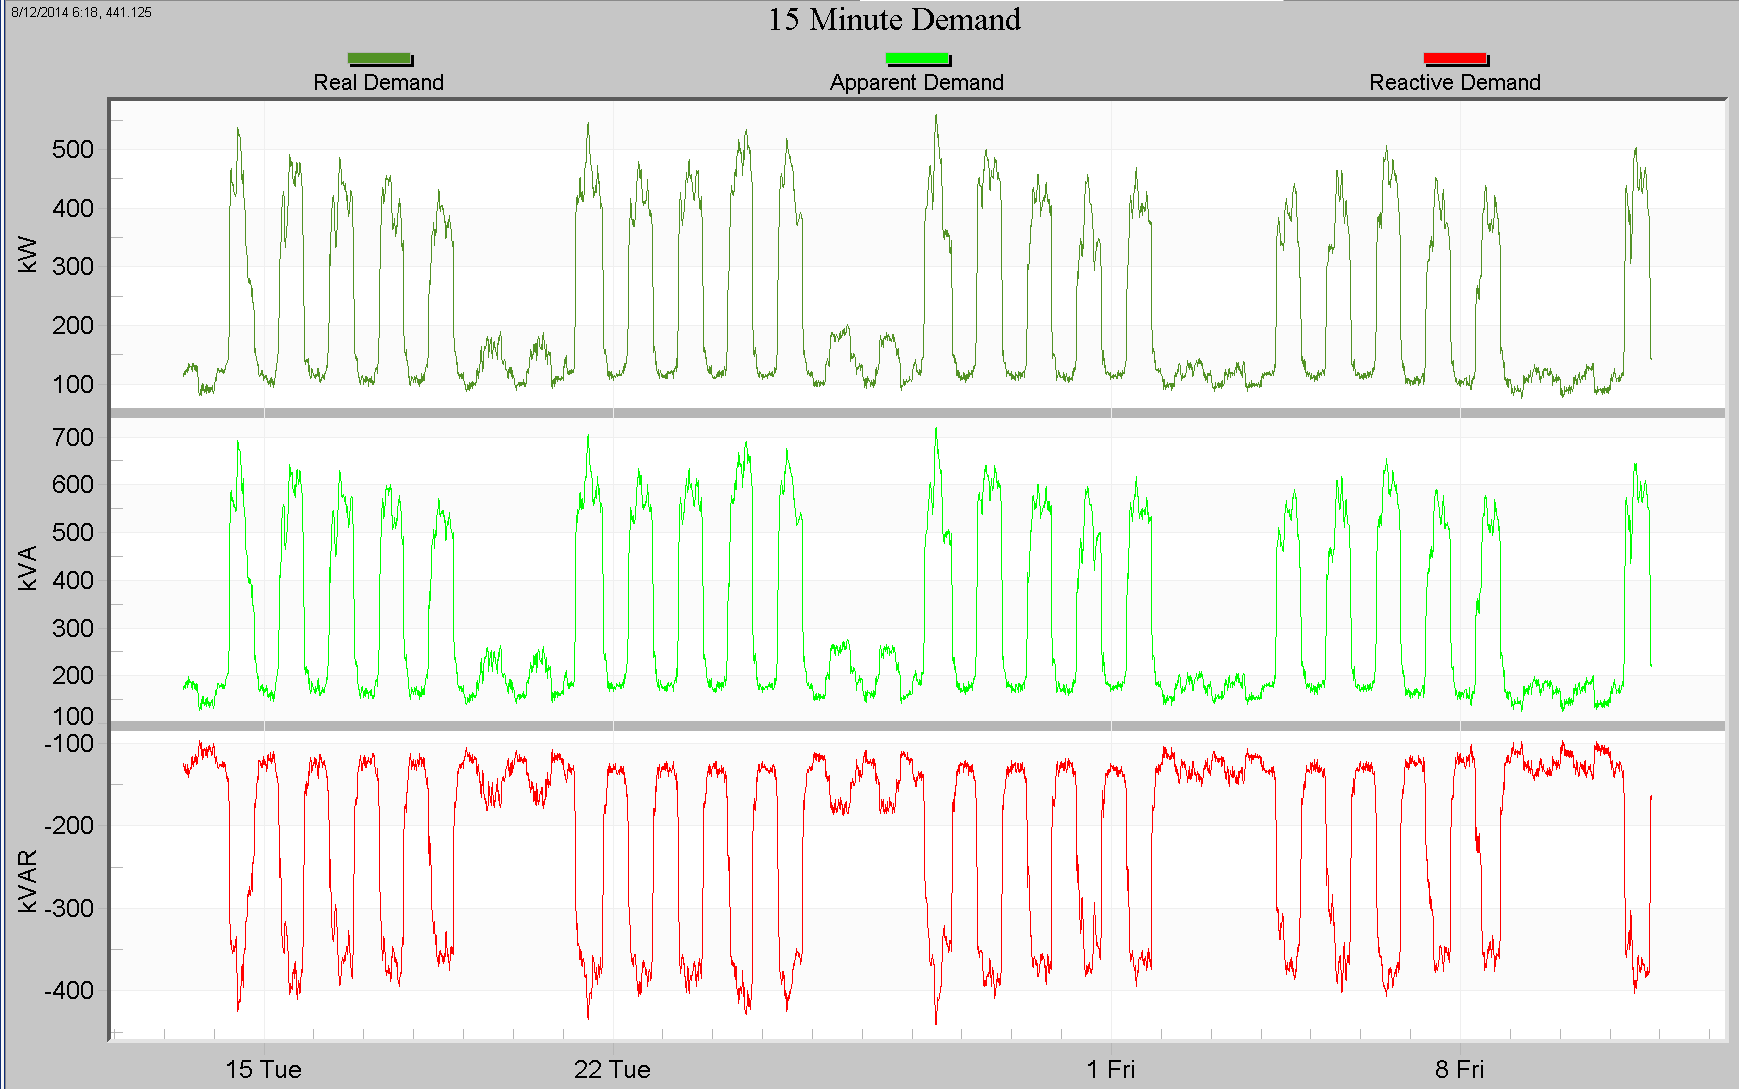
A utility customer may just need the peak demand estimate from the utility to complete their expansion planning as far as NEC 220.87 requires. In case of a major expansion, the utility itself should also look at transformer loading, voltage regulation, and harmonic levels, both existing and with the proposed new loads. The peak demand graph in ProVision shows the total single or 3 phase demand for real, reactive, and apparent power. A 3-phase example is shown in Figure 4. Total maximum 3-phase real power is around 550 kW and maximum apparent power just over 700 kVA.
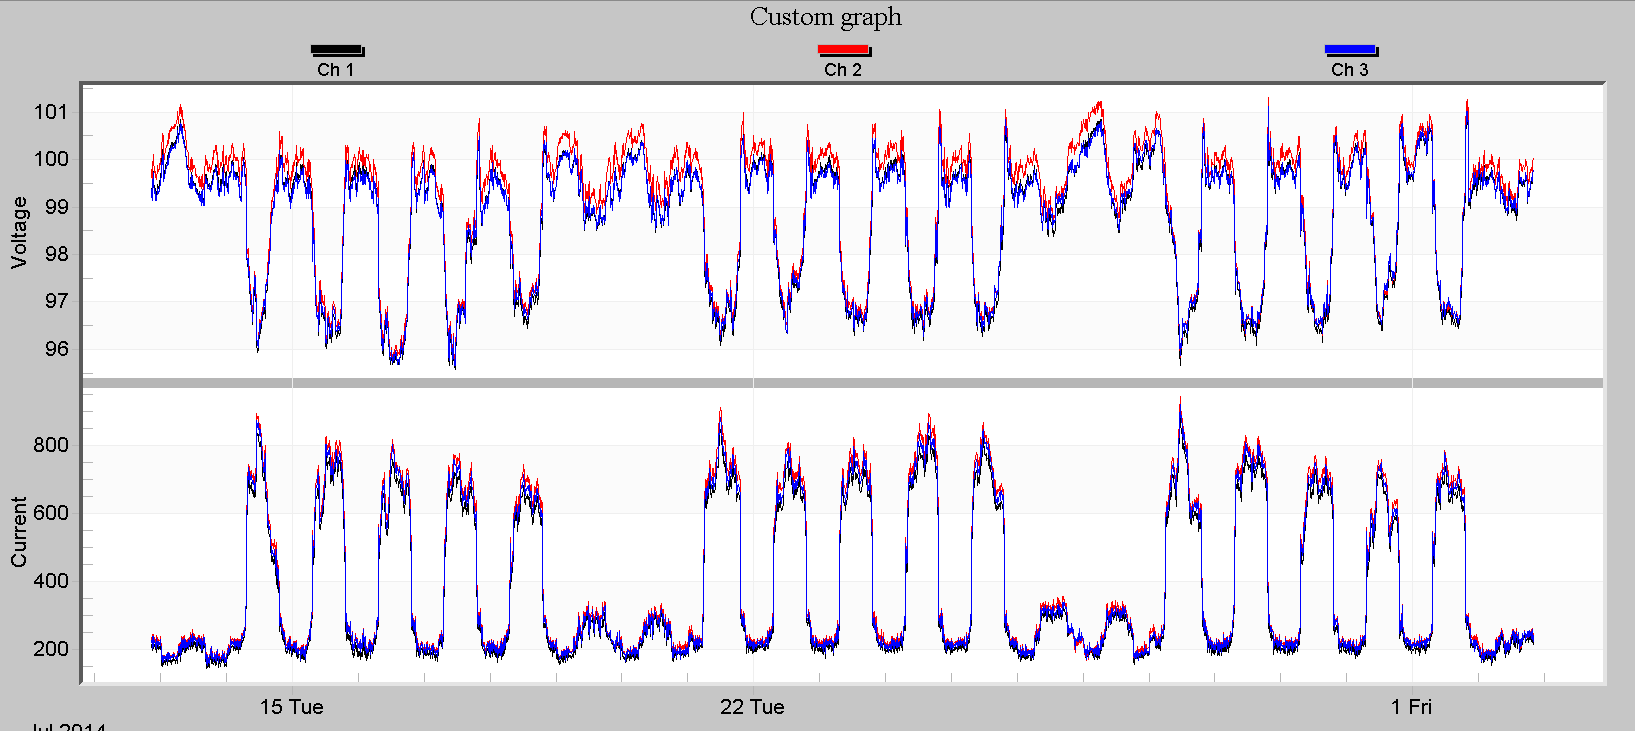
Voltage regulation is shown in a custom graph in Figure 5. Three voltage phases are graphed with per-unit scaling (100=1.00) on the top plot, and RMS current on the bottom plot, all as 15-minute average values. The voltage is 4% low during peak loading during each weekday, but the total swing is less than 5%. Significant additional load may call for a tap change or upstream voltage regulator adjustment.
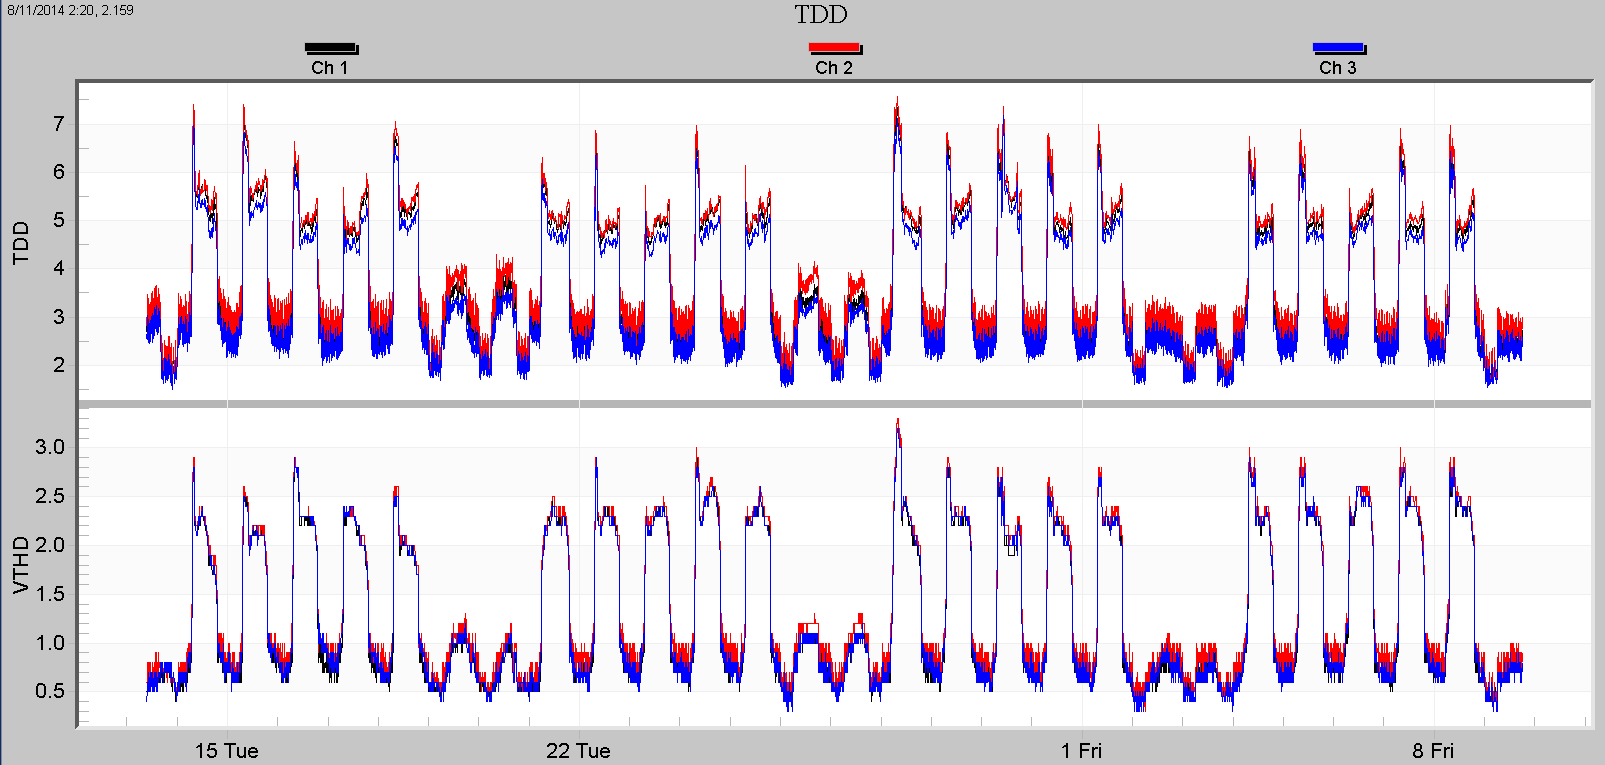
Plotting Total Demand Distortion is straightforward since the maximum demand current is known (the original reason for the recording!). Entering 900A for this recording gives the TDD plot in Figure 6 (top plot). Maximum TDD is 7.5%, just barely within the IEEE 519-2014 limit of 8.0%. If the new loads are rich in harmonics the TDD may be increased past the limit. The voltage THD (bottom plot in Figure 6) is under 3.5%, so it’s possible the system could tolerate additional current harmonics in excess of the IEEE 519 limit without raising the voltage THD excessively. A full IEEE 519-2014 harmonic analysis requires higher resolution data than 15 minutes, but in many cases the results from this type of load survey may be sufficient for planning purposes in a location that has no existing harmonic problems.
Conclusion
Utility customers adding load or expanding operations must comply with the NEC, including the load planning in NEC 220.87. The minimum data requirements and recording methods are given here, along with recommendations for additional data that may be useful for the utility in conjunction with additional customer load. The basic NEC requirement is maximum demand current over 30 days. Data on transformer loading, voltage regulation, and harmonic levels are also important for the utility. The recording setup and data analysis methods shown here enable the utility to fully characterize a customer’s loads to facilitate the expansion planning for both parties.
