Abstract
Power Quality Monitoring data can be used to detect and identify potential problems either before equipment begins to fail or before it fails completely. Symptoms recorded by PQ monitors can indicate impending failures. This allows preemptive action to prevent major disturbances, equipment or conductor failures, customer outages, and complaints.
Predictive power monitoring requires longer term monitoring of systems and equipment performance to establish a “normal operation” baseline for future comparison. These baselines can be used to detect trends and changes over time as well as alarms sent when measured data crosses these normal boundaries.
Monitoring
When using predictive monitoring, you want the monitor to be as close to the load as possible. The closer the monitor is to the load, the better the baseline can be established. When multiple loads are being monitored, the ranges measured can have greater variation. Also, if there is one load with a rated voltage, alarms can be set close to the rating to make sure that the rated voltage is maintained. Watching long term trends and comparing current data to the baseline can show problems. For example, when motors or connectors deteriorate then impedance generally rises. As the impedance rises there is a corresponding drop in voltage. Graphing voltage over time can show this drop and preventive maintenance can be scheduled to repair the motor before complete failure occurs. Accumulated power quality data can be used over time to understand specific equipment performance producing a better baseline. Alarms can be tuned over time as more data is acquired.
In a balanced 3-phase system it is good to get a baseline for voltage unbalance and monitor for changes. Rising voltage unbalance can indicate a failure of a voltage regulator or a change in loads. Unbalanced voltage on a heavy loaded motor will cause an increase of voltage on the motor. Graphing voltage unbalance over time can show trends that may indicate the need for corrective action, as shown in Figure 1. A suggested upper limit for 3-phase unbalance is 3%.
Harmonics are caused by nonlinear loads where current is not directly proportional to voltage, and can cause heat problems in transformers and rotating equipment, as well as being able to affect other power customers. Monitoring for Total Harmonic Distortion (THD) can detect these problems. A suggested upper limit to voltage THD is 5%. Solutions to harmonic distortions include locating the source, identify harmonics that cause the problem, install filters or traps at sources. High even harmonics may indicate faulty bridge rectifiers.
Neutral to ground voltage can be an indicator of problems on 3-phase systems. The more unbalanced or harmonic load that is applied, the more current flow in the neutral wire and the more this voltage is elevated. The difference in voltage drop due to the current flowing in the neutral line, due to its impedance, compared to no voltage drop in the ground line. No current should be flowing in the ground line unless there is a ground fault condition, so some difference is to be expected under normal conditions. It is usually only when equipment is very sensitive to these variations that this slight elevation would present a real issue.
Ideally in a balanced 3-phase system, there is no current on the neutral – the 3-phase currents exactly cancel on the neutral, resulting in no net current flow on that wire. That’s only true for 60Hz current though – triplen harmonics (odd multiples of the 3rd harmonic) don’t cancel out, they add. So, if there is neutral current in a 3-phase system, either the loads aren’t balanced, or they have harmonics. So, just looking at RMS neutral current can be some help in looking for harmonics (although if you can actually measure THD and the harmonics themselves, that’s much better). The neutral-ground voltage depends on the neutral current. Ideally that voltage is zero, but if there is current flow, you’ll see a voltage proportional to the current, and the neutral wire resistance (V=IR). It is normal for the voltages measured on the neutral line to be slightly elevated above the system’s ground due to current flow in the neutral to hot circuit.
One of the main issues that results from triplen harmonics is the overheating of transformers and rotating equipment. If triplen harmonics are applied to a 3-phase motor, it will attempt to drive the motor in reverse. In order to compensate, the motor must draw additional current at the fundamental, eventually causing it to overheat. Some of the other negative effects of triplen harmonics include increased hysteresis losses in transformers, decreased kVA capacity, neutral overloading, unacceptable neutral-to-ground voltages, distorted voltage and current waveforms, failed capacitor banks, breakers and fuses tripping, erroneous register of electric meters, wasted capacity and inefficient distribution of power, and an increased maintenance of equipment and machinery.
Examples
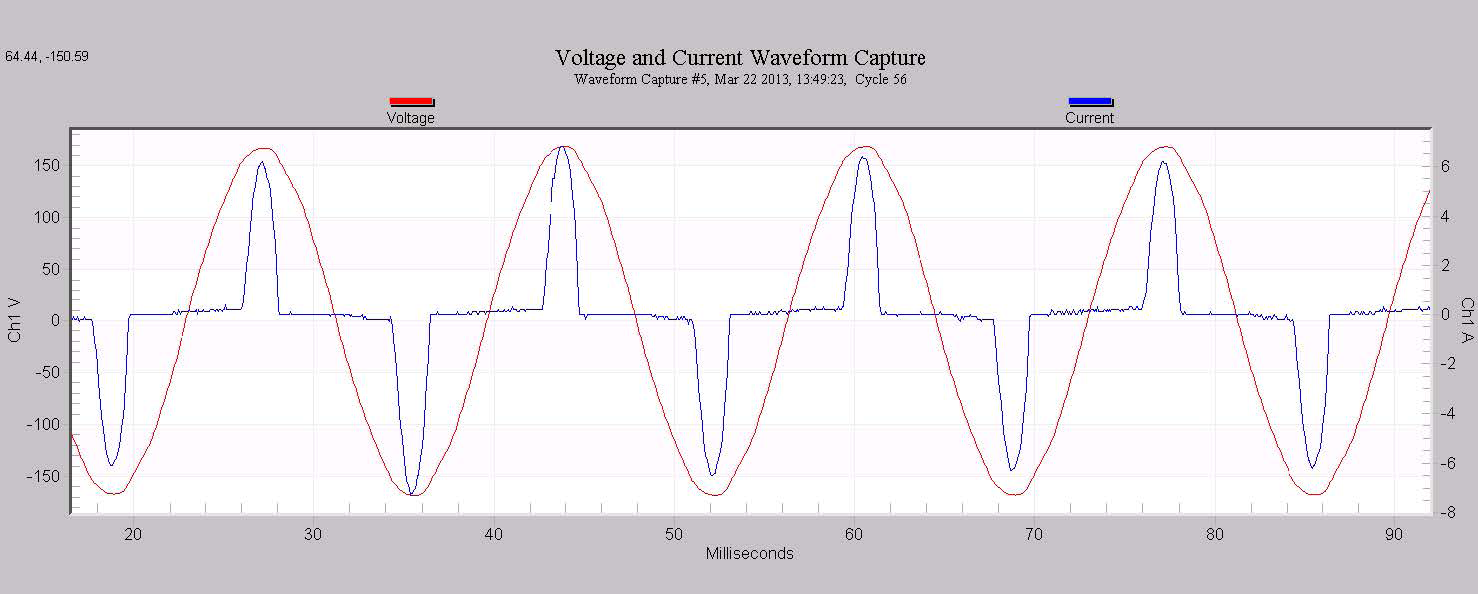
High current near positive or negative peaks of the voltage waveform suggests dielectric breakdown, flashover, or impending component or equipment failure. The Provision Voltage and Current Waveform graph in Figure 2 shows a waveform (captured by a PMI Eagle 440) with current that jumps at two consecutive voltage peaks. This high current near the peak of voltage waveform causes abrupt voltage drop. High current alarms can be used to detect this problem.
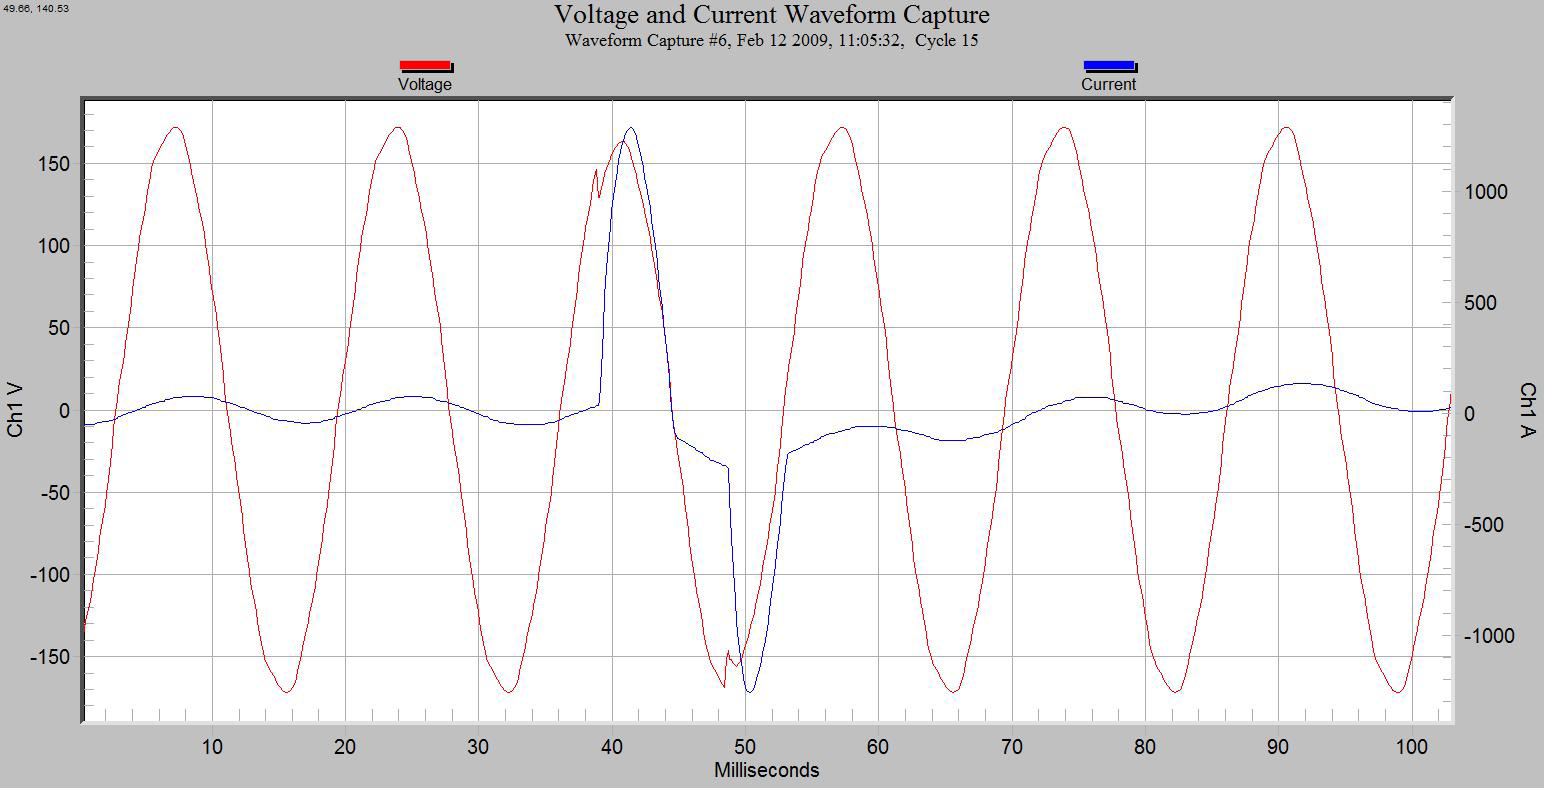
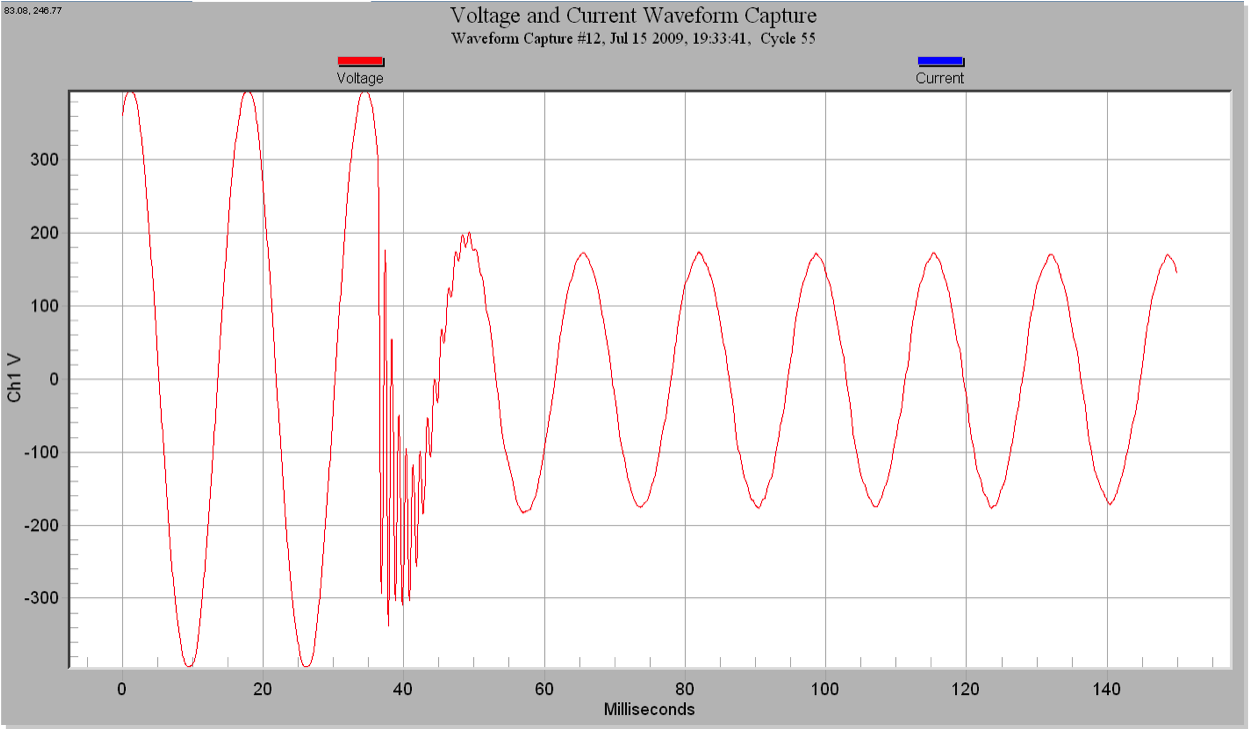
Figure 3 shows a Provision graph of a waveform captured by a PMI Eagle 440 showing a single line to ground (SLG) fault. There is a Voltage sag to 0.43 pu retained voltage. The graph shows the system resonance excited by abrupt change in voltage. Low voltage alarms can be used to detect this problem.
Voltage spikes can indicate several problems. Figure 4 shows a Canvass graph of a RMS voltage stripchart captured by a PMI Plug-in Boomerang. When the line into the home was checked by service personal, a shorting underground service line was found. The stripchart graph shows the voltage spikes and the disconnects during the repair. High voltage alarms can be used to detect this problem.
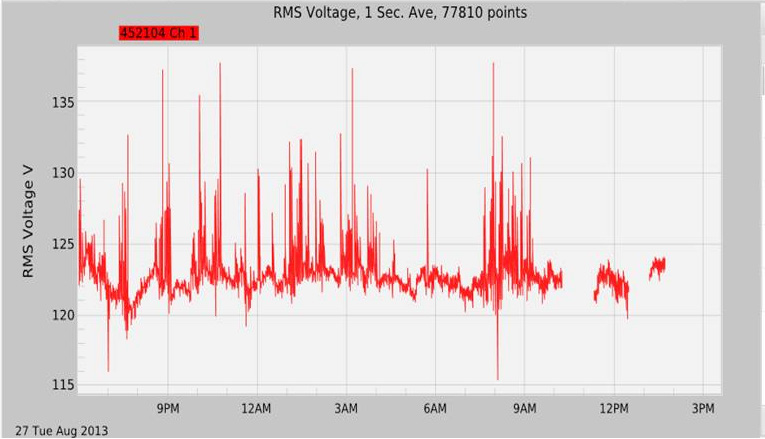
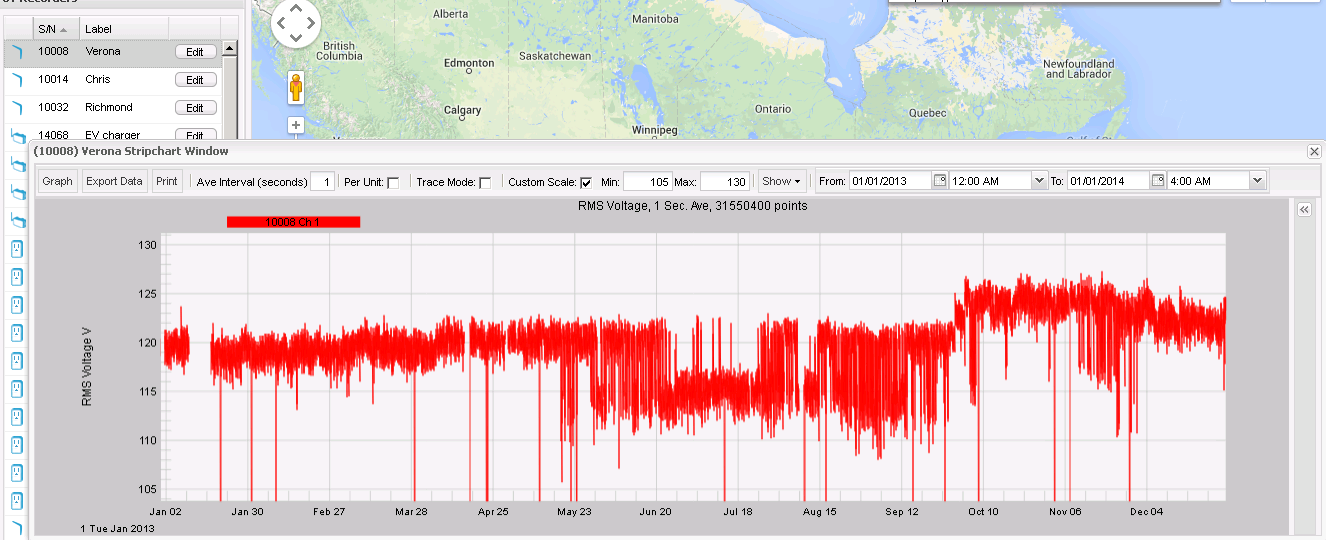
Figure 5 shows a one year voltage graph in PMI’s Canvass system showing data generated by a Boomerang voltage monitor. The ability to see changes in data over a long period of time helps in showing changes to the baseline, and spotting trends and changes in load patterns. In this Figure, a significant change in equipment occurred from late May through October, with a second change in the delivered voltage in June and July. Continuous long-term monitoring can be very useful for seasonal trends, or correlating smaller changes that may not be apparent immediately.
Parametric Graphs
Parametric graphs present a different view of load waveforms by graphing the current waveform against the voltage waveform. This can be useful for characterizing load properties, and establishing a baseline signature. Comparing parametric graphs over time can be useful perspective for spotting changes to the baseline. A typical electronic load is shown in Figure 6, with the traditional and parametric plots. This switching power supply only draws current during a small conduction angle near the peak of the waveform. This property is expressed in the parametric view (Figure 7) by the horizontal section – the region with no current flow, surround on each end by steep vertical lines – the region of large current flow. The slope of the two vertical lines is the same, and represents the load impedance while current is allowed to conduct.

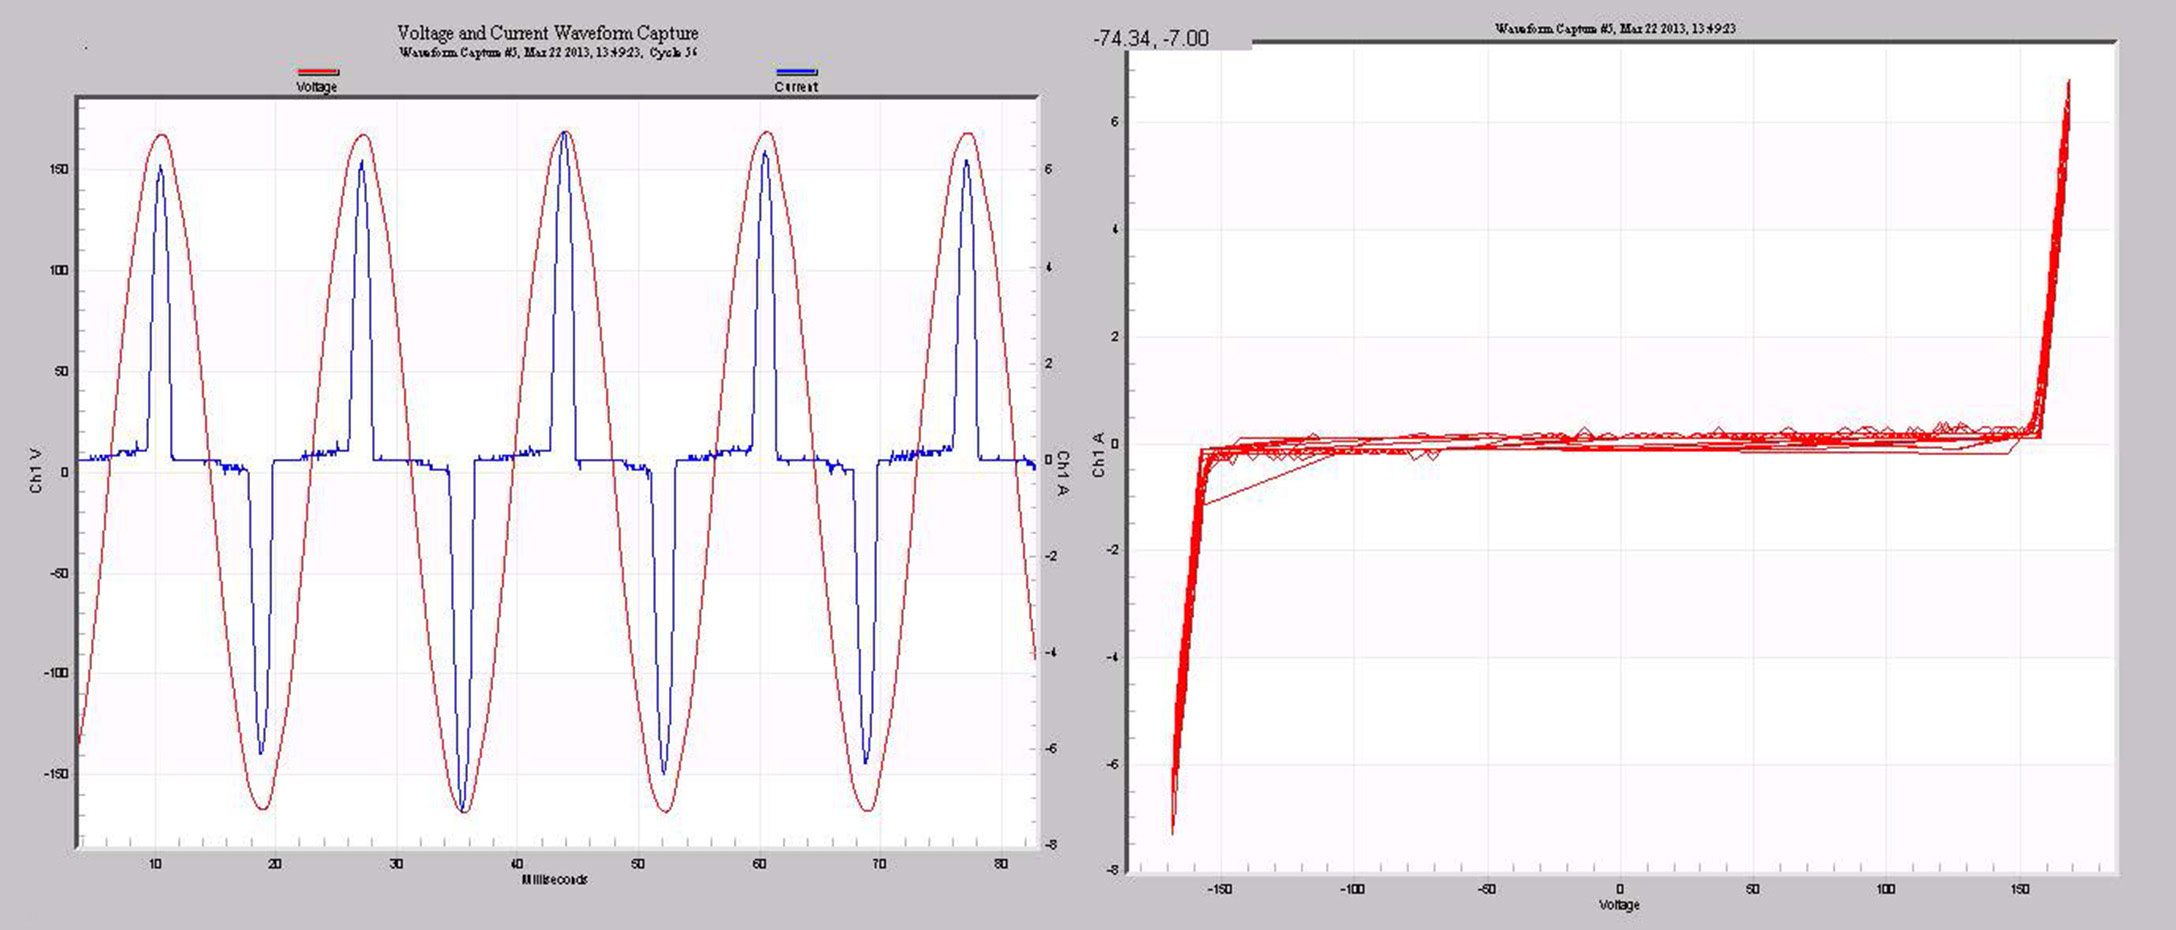
Parametric graphs give some interesting views, but how are they used? These plots are most useful when a single load is monitored. They give a voltage-independent display of the load characteristic – the parametric plot, in theory, should be unchanged if the voltage waveform changes. At the very least, it’s less sensitive than the standard time series display. These load signatures are useful for troubleshooting large loads such as simple AC and VFD-based motors. Reference parametric plots should be stored during “normal” operation, for comparison with later recordings to help predict failure, or troubleshoot a problem. For equipment manufacturers, the parametric plot reveals characteristics about the load that are not as easy to spot in the standard waveform, such as impedance vs. point on waveform. In a collaborative troubleshooting process, these graphs can be shared with the customer or equipment manufacturer to help determine a root cause.
For monitoring of aggregate loads (e.g. at service entrance, substation, etc.), the parametric plots allow for an easier determination of load impedance. Impedance can be estimated on a regular waveform capture graph by picking a point on the voltage and current sine waves (at the same time), and dividing, but a more accurate estimate is possible by using the parametric graph, and using the slope of a linear portion. The vector diagram can also be used for impedance calculations, by dividing the voltage and current phasors, but this assumes a constant impedance throughout the waveform, and ignores harmonics.
Conclusion
Power quality monitors can be used to monitor equipment in predictive and preventive roles. Early detection of problems can save time and money and provide better service to customers. PMI’s complete line of power monitors and their supporting software can provide useful information to find equipment problems early.
