Abstract
The rapid deployment of electric vehicle (EV) charging infrastructure is reshaping electric distribution systems in North America. This white paper provides a focused technical overview of EV charging technologies, emphasizing the power quality (PQ) implications of Level 1, Level 2, and Level 3 charging, particularly DC fast chargers in the 150 kW to 350 kW range. It also summarizes the transition from CHAdeMO and CCS1 to the NACS connector and its impact on utilities (CHAdeMO chargers tend to max out at around 50kW). Finally, the paper addresses power quality (PQ) issues introduced by charging systems, including harmonic distortion, voltage variation, and feeder impacts, and provides PQ monitoring recommendations.
Introduction
EV charging systems vary widely in voltage, current, and system topology. Level 1 and Level 2 chargers are most commonly used in residential and light commercial environments, while Level 3 chargers—DC fast chargers—are increasingly deployed in public and fleet applications. The rising power levels of these chargers impose new types of loading on distribution systems. Utility engineers are now seeing significant PQ impacts, especially in harmonics and voltage stability, that require targeted investigation and mitigation.
EV Charger Classifications
Level 1 chargers operate from standard 120 V outlets, drawing 12–16 A (1.4–1.9 kW). These chargers have minimal PQ impact and typically do not require utility involvement.
Level 2 chargers are powered by 208 or 240 V circuits and deliver between 3.8 kW and 19.2 kW. They are often installed in residential and commercial settings. While generally benign, their simultaneous operation in clusters can cause transformer loading issues, voltage unbalance, and localized thermal stress on distribution equipment.
Level 3 chargers bypass the vehicle’s onboard charger and deliver DC power directly to the battery. These systems typically use three-phase AC input and contain internal power conversion stages that draw significant, nonlinear current. Most Level 3 systems in active deployment today range from 150 kW to 350 kW.
Charging Connectors and Communication Protocols
CHAdeMO, an early DC fast charging standard used primarily by Japanese EVs, relies on CANbus for communication. It has largely been phased out in North America due to limited power capability and network coverage.
CCS1 (Combined Charging System) is currently used by many North American EVs and supports both AC and DC charging. It communicates over Power Line Carrier (PLC) using HomePlug Green PHY and supports ISO 15118-based features such as Plug and Charge. The communication is between the car battery system and the charger to negotiate charge levels.
Tesla’s North American Charging Standard (NACS), also using PLC, is now broadly supported across the industry due to its widespread network and compact connector design. Most major OEMs have announced transitions to NACS ports in future vehicles.
While these transitions are significant for vehicle and equipment manufacturers, utilities do not need to take direct action based on connector standards. The power draw, control signaling, and PQ behavior of the chargers are the primary concerns, and these are largely independent of connector type.
Charging Costs and Load Shaping Implications
The cost of charging EVs varies based on location and charging speed. Residential charging typically falls between $0.10 and $0.18 per kWh, aligning with standard utility rates. Public Level 3 charging, however, can range from $0.25 to $0.60 per kWh depending on station operator pricing and demand-based tiers.
These price differentials influence user behavior and charging timing. Higher costs at public DC fast chargers encourage EV owners to shift their primary charging to home settings, often during off-peak evening hours. Conversely, low or flat-rate fast charging—especially when subsidized—can drive heavy daytime demand at fleet or commercial charging hubs.
From a utility perspective, this user behavior affects:
- Peak loading: Clusters of Level 2 charging in residential neighborhoods may exacerbate evening peak demand if customers charge immediately after returning home.
- Load leveling opportunities: Time-of-use (TOU) pricing or demand response programs can incentivize off-peak charging and shift large aggregate loads to more favorable grid conditions.
- Unpredictable demand spikes: Low-cost public charging may lead to uncoordinated high-power demand surges, particularly in commercial districts or transit corridors with large charger banks.
These load patterns influence transformer sizing, regulator tap settings, and load forecasting accuracy. Utilities should evaluate local load profiles where EV adoption is accelerating, and use waveform and RMS trending tools to capture load correlations with price-driven behavior. PMI’s Seeker and Revolution instruments can be deployed to monitor feeder load variation during high-demand intervals and inform future load-shaping or DER planning initiatives.
Power Quality Impacts
Harmonic Distortion
DC fast chargers contain AC-DC rectifiers and high-frequency DC-DC converters, which introduce nonlinear currents that can distort the supply voltage waveform. While charger manufacturers are required to limit harmonic emissions, installations with multiple chargers or weak grid interconnections may still exceed recommended voltage distortion limits, especially at low-order harmonics.
Utilities should evaluate voltage total harmonic distortion (THD) per IEEE 519 guidelines. Voltage distortion exceeding 5% THD or 3% individual harmonics may cause sensitive equipment malfunctions or interact with other nonlinear loads.
Recommended instrumentation for field measurements includes the PMI Seeker for mobile or temporary deployment and the Revolution for long-term, high-resolution waveform capture at substations, feeders, or service entrances. These instruments can log harmonic spectra, trigger on events, and support waveform analysis via PMI’s PQ Canvass platform.
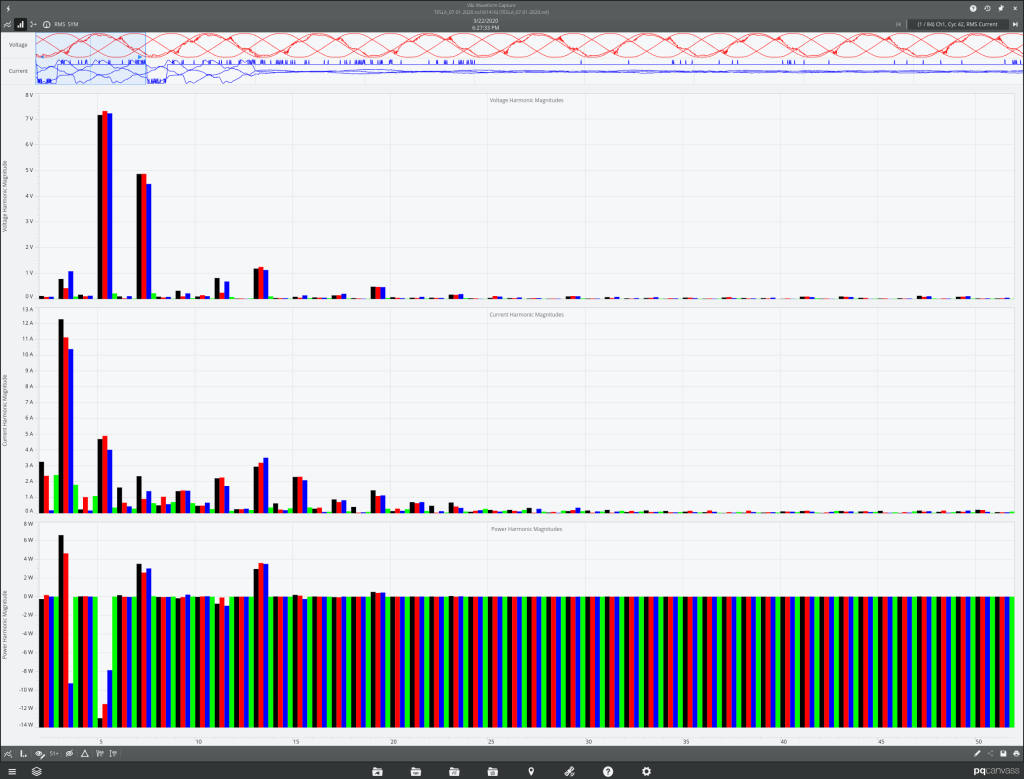
Figure 1 shows a waveform capture from a Tesla v4 supercharger. Specifically, this capture shows the predominant current harmonics at 180Hz, 300Hz and 660Hz (the 3rd, 5th and 11th harmonics). This is a common characteristic of high speed DC fast chargers (DCFCs).
For EV charging systems—especially Level 2 and Level 3 chargers—the most prominent current harmonics typically arise from the power electronics used in AC-DC conversion. The dominant harmonic content depends on the topology of the converter, switching frequency, and the quality of filtering in the charger. Here’s what you can generally expect:
Level 2 Chargers (Single-Phase, Residential/Commercial)
Most Level 2 chargers use single-phase diode bridge rectifiers followed by a DC-DC converter. In this setup, you will typically observe:
- 3rd harmonic (180 Hz) – very common in single-phase rectified loads.
- 5th harmonic (300 Hz) – often prominent.
- 7th harmonic (420 Hz) – less than the 3rd or 5th, but still significant.
- Higher odd harmonics (9th, 11th, 13th…) – generally decreasing in magnitude with order.
Because these chargers usually draw current only on the peaks of the voltage waveform (unless power factor correction is included), the current waveform is rich in lower-order odd harmonics. The 3rd harmonic is especially important because it is zero-sequence and accumulates in shared neutrals, which can lead to overheating in residential feeders.
Level 3 Chargers (Three-Phase, DC Fast Charging)
Most Level 3 chargers use three-phase rectifiers (often IGBT-based) with active front-end (AFE) converters, particularly in higher-end designs. These typically have better harmonic performance due to active filtering and Power Factor Correction (PFC), but:
- 5th harmonic (300 Hz) and 7th harmonic (420 Hz) remain the most prominent.
- 11th (660 Hz) and 13th (780 Hz) harmonics may also appear, especially if the charger uses a 6-pulse rectifier without proper filtering.
- In 6-pulse rectifier systems, you’ll often see strong harmonics at: h = np ± 1 where n is an integer and p is the pulse number (so 5th, 7th, 11th, 13th, etc.).
- In 12-pulse systems, expect the lowest significant harmonics to start at the 11th.
Some newer chargers with AFE designs can keep current THD <5%, but this depends on design quality and how many chargers are operating together. High voltage unbalance can increase current distortion, in particular 3rd harmonic current that may otherwise be low in a 3 phase charger. This effect is noticeable even at 1% unbalance with simple 6-pulse diode-rectification front-ends.
Summary of Common Harmonics by Charger Type
| Charger Type | Prominent Harmonics | Notes |
|---|---|---|
| Level 2 (Single-Phase) | 3rd, 5th, 7th, 9th | 3rd is zero-sequence – check neutral loading |
| Level 3 (6-pulse) | 5th, 7th, 11th, 13th | Expect higher THD unless filtered |
| Level 3 (12-pulse or AFE) | 11th, 13th, 23rd, 25th | Lower THD; harmonics shifted to higher order |
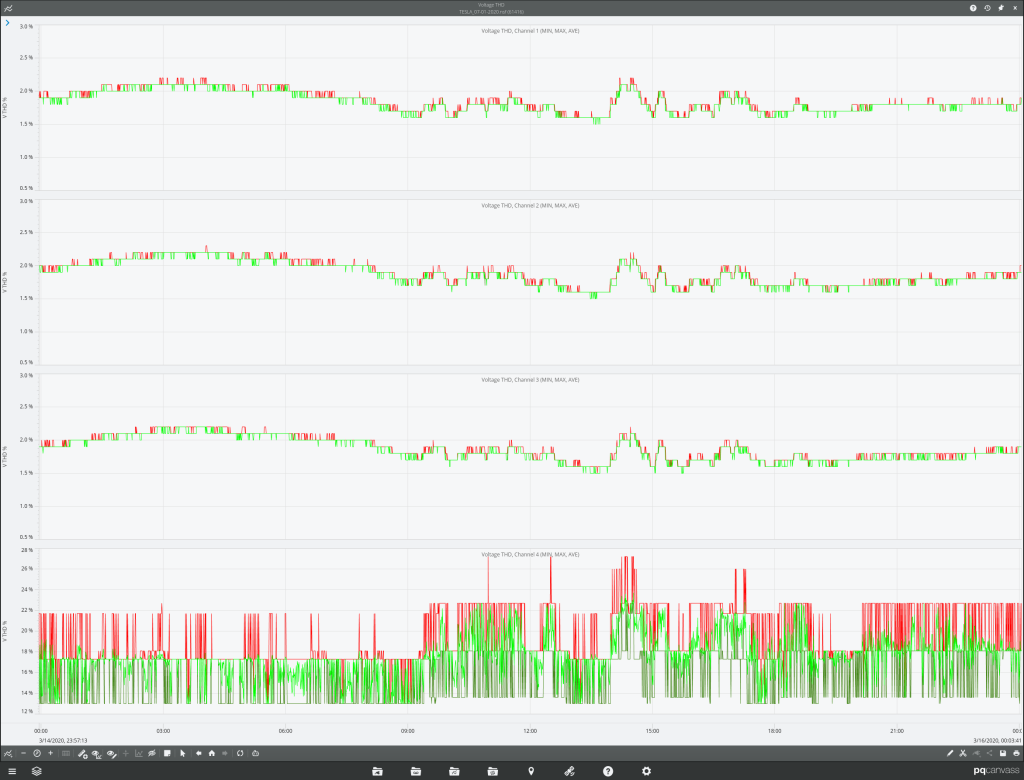
It is worth noting here that VTHD remains steady at this charging station, even during a charging session. Figure 2 shows that the VTHD remains steady around 2% for the duration of the session, with small (~0.5%) variations when the session comes to an end.
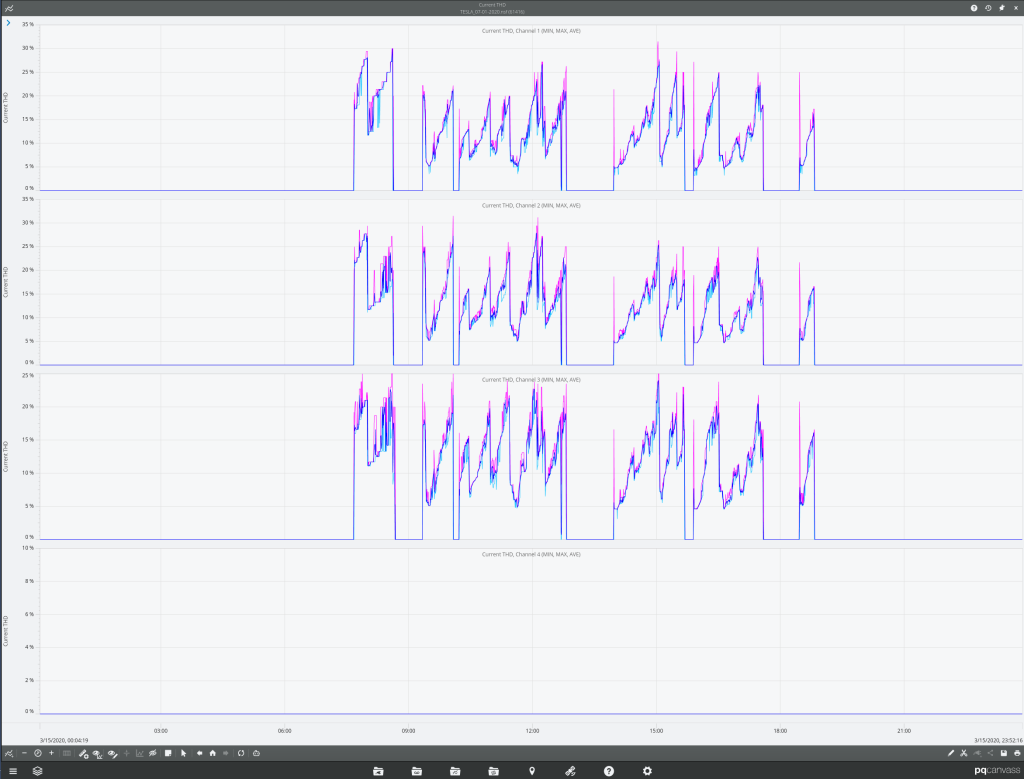
Current THD, on the other hand, is seen varying significantly with the load. See Figure 3.
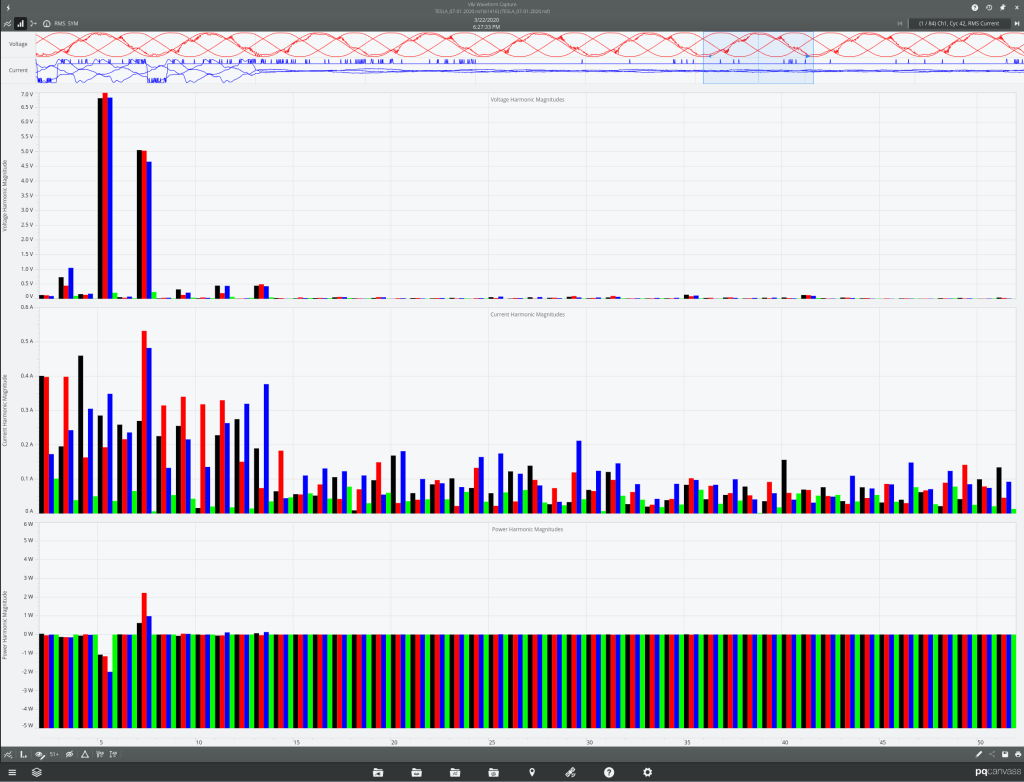
Voltage total harmonic distortion (THD) during a Level 3 DC charging session is generally influenced by the aggregate harmonic current drawn by the charger and the impedance of the upstream power system. In well-designed systems with modern chargers using active front-end (AFE) converters and effective filtering, voltage THD at the point of common coupling (PCC) typically remains below 2%, even during full load operation. However, in installations with multiple chargers, weak feeder conditions, or chargers lacking active harmonic mitigation, voltage THD can rise above 3%, particularly during periods of simultaneous high-load charging. The most affected frequencies are usually the 5th and 7th harmonics, though higher-order components may appear depending on the switching strategy of the charger. While current THD may be substantial—especially in non-AFE systems—voltage THD is usually constrained by system impedance but may still exceed IEEE-recommended limits in marginal networks. Monitoring with high-resolution tools such as the PMI Seeker or Revolution can help utilities assess distortion trends and identify locations where mitigation may be warranted. See Figure 4 for more details.
Power Factor
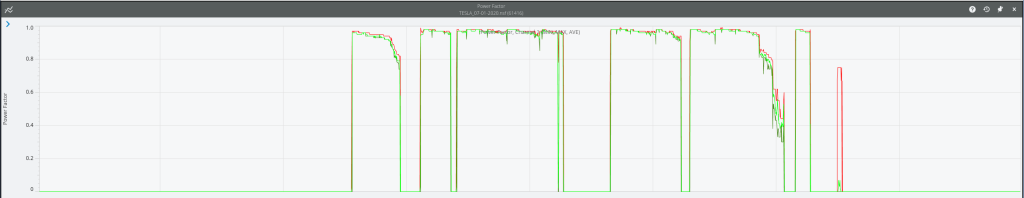
During a Level 3 DC charging session, the power factor observed will depend largely on the charger’s design. Most modern DC fast chargers rated between 150 kW and 350 kW use active front-end converters with built-in power factor correction. These systems are engineered to maintain a high power factor—typically between 0.98 and 1.00—by keeping the current waveform closely aligned with the voltage and minimizing harmonic distortion. As a result, both displacement and true power factors remain near unity throughout the bulk of the charging session. In contrast, older or lower-cost chargers that use 6- or 12-pulse rectifiers without active PFC may exhibit a good displacement power factor but a true power factor closer to 0.85 due to significant harmonic content. Additionally, transient periods such as the initial connection, ramp-up, or tapering phases may cause brief dips in power factor, sometimes falling below 0.90, along with short-lived reactive power fluctuations. These effects are typically temporary and stabilize once the charger reaches its steady-state operating condition.
This is fairly well exemplified by looking at the true power factor for our recording. Note that power factor does stay near 1.0 during steady-state periods of the charging session, but tapers off and can be seen dropping as low as 0.38 towards the end of the session as the charger reduces its output to the vehicle. The low power factor is not as serious in this reduced output stage since the absolute power level is small. See Figure 5. (It is worth noting that most chargers reduce their output to vehicles once the vehicle reports an 80% State of Charge (SoC). This is done to reduce excess heating and prevent damage to the vehicle’s batteries.)
Voltage Sags, Swells, and Flicker
Fast ramping of high-power chargers can result in voltage sags during start-up or during multiple-vehicle charging events. Swells may also occur upon load shedding or disconnection. Flicker becomes a concern on weaker systems with intermittent charging behavior.
These disturbances can be captured using voltage RMS trending and flicker severity indices (Pst/Plt). Correlation with load current step profiles and time-of-day trends can help isolate root causes and inform mitigation options such as service transformer upsizing or feeder reconfiguration.
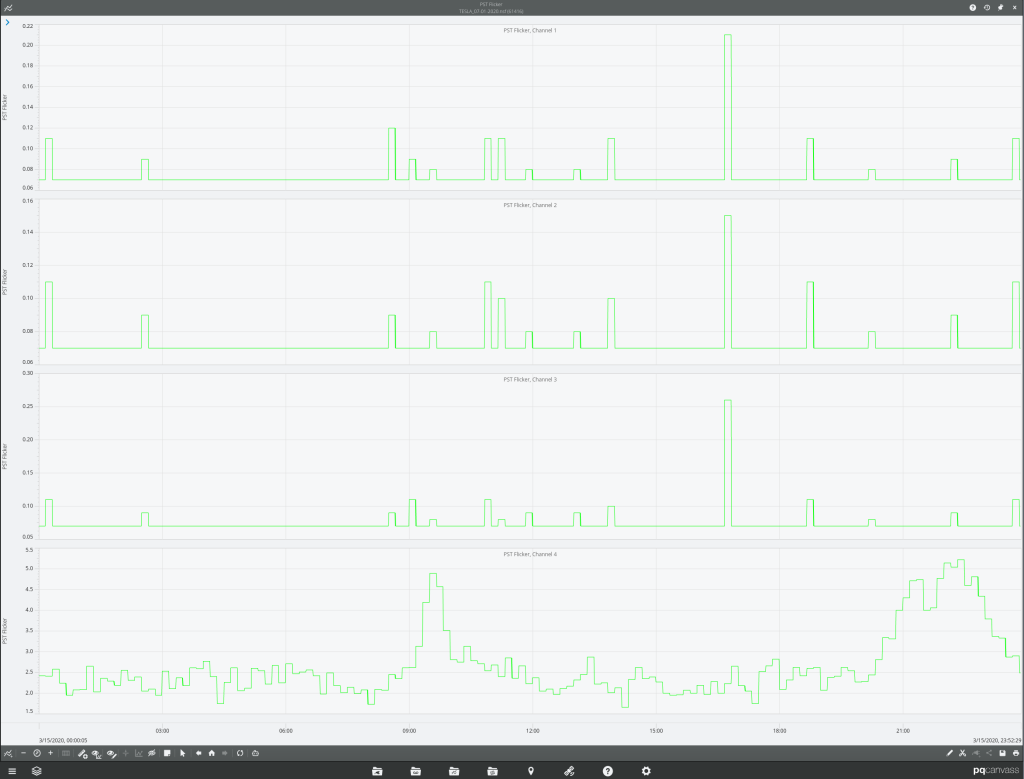
Figure 6 shows Pst flicker readings during a DCFC session. Note that even during its peak, the Pst levels are well below the recommended value of 1.0.
Residential Feeder Loading
Level 2 charger deployment in residential areas can lead to significant simultaneous loading on distribution transformers, especially during evening hours. Transformers originally sized for conventional household loads may experience excessive neutral currents (due to phase imbalance), heating, and reduced lifespan.
Utilities should monitor load unbalance, neutral current, and thermal stress on transformers serving multiple EV chargers. PMI’s Seeker is well-suited for short-term load studies at the transformer secondary or service entrance, and can be combined with temperature logging to evaluate thermal headroom.
Transients
The power electronic switching behavior of fast chargers may generate impulsive or oscillatory transients, particularly during connection, disconnection, or fault recovery events. These transients can excite feeder resonances, interfere with neighboring electronics, or degrade protection system performance.
Field capture of high-speed transients with microsecond resolution is supported on Revolution and Seeker models equipped with appropriate sampling configurations. Data analysis should focus on ring frequency, damping time, and coordination with nearby capacitor banks or voltage regulation equipment.
Recommendations for Utility PQ Investigation
- Use a PMI Seeker for localized PQ surveys at transformer secondaries, services, or individual EVSE installations.
- Deploy a PMI Seeker or Revolution at feeders or substations with heavy Level 3 charger installations for long-term harmonic and event logging.
- Measure voltage THD and flicker using IEEE 519 and IEEE 1453 guidelines.
- Investigate transformer loading trends and neutral current using RMS trending and daily profiles.
- Monitor load variations in response to public charging pricing models and time-of-use incentives.
- Use PMI’s PQ Canvass software for visualization, report generation, and IEEE compliance.
Conclusion
The growth of EV charging infrastructure introduces increasingly complex PQ challenges, particularly at the distribution level. Level 1 and 2 chargers affect local feeders and transformers, while Level 3 fast chargers impose large, nonlinear loads that must be studied and, in some cases, mitigated. Utilities should focus on waveform distortion, voltage variation, and loading impacts—parameters that can be effectively measured and analyzed using PMI’s Seeker and Revolution platforms. Charging costs, particularly when structured to incentivize off-peak use, can serve as a critical lever for shaping demand and mitigating the impact of high-powered charging on local PQ.
