Abstract
The Significant Change graph shows single cycle measurements, with one second resolution in a single graphical time series trace. This graph of the triggered Significant Change record type is especially useful in situations where a long stripchart interval (e.g. 5 or 15 minutes) doesn’t provide enough time resolution, or in a very long recording, where stripchart memory isn’t enough for the entire session. The Significant Change graph can fill in the gaps with one second time resolution.
Significant Change Record Overview
The Significant Change record type is a triggered record, with a voltage reading and timestamp logged whenever the voltage on a channel makes a “significant” change from the previous reference level. The reference level voltage begins as the nominal voltage for the circuit type (determined automatically during the two minute countdown), and if a Significant Change is triggered, the triggered voltage value becomes the new reference level. The threshold value (in Volts) governs how far the voltage must vary from the reference level to trigger again. Either a one cycle min or max voltage reading may trigger a Significant Change, at most once per second.
Significant Change Graph
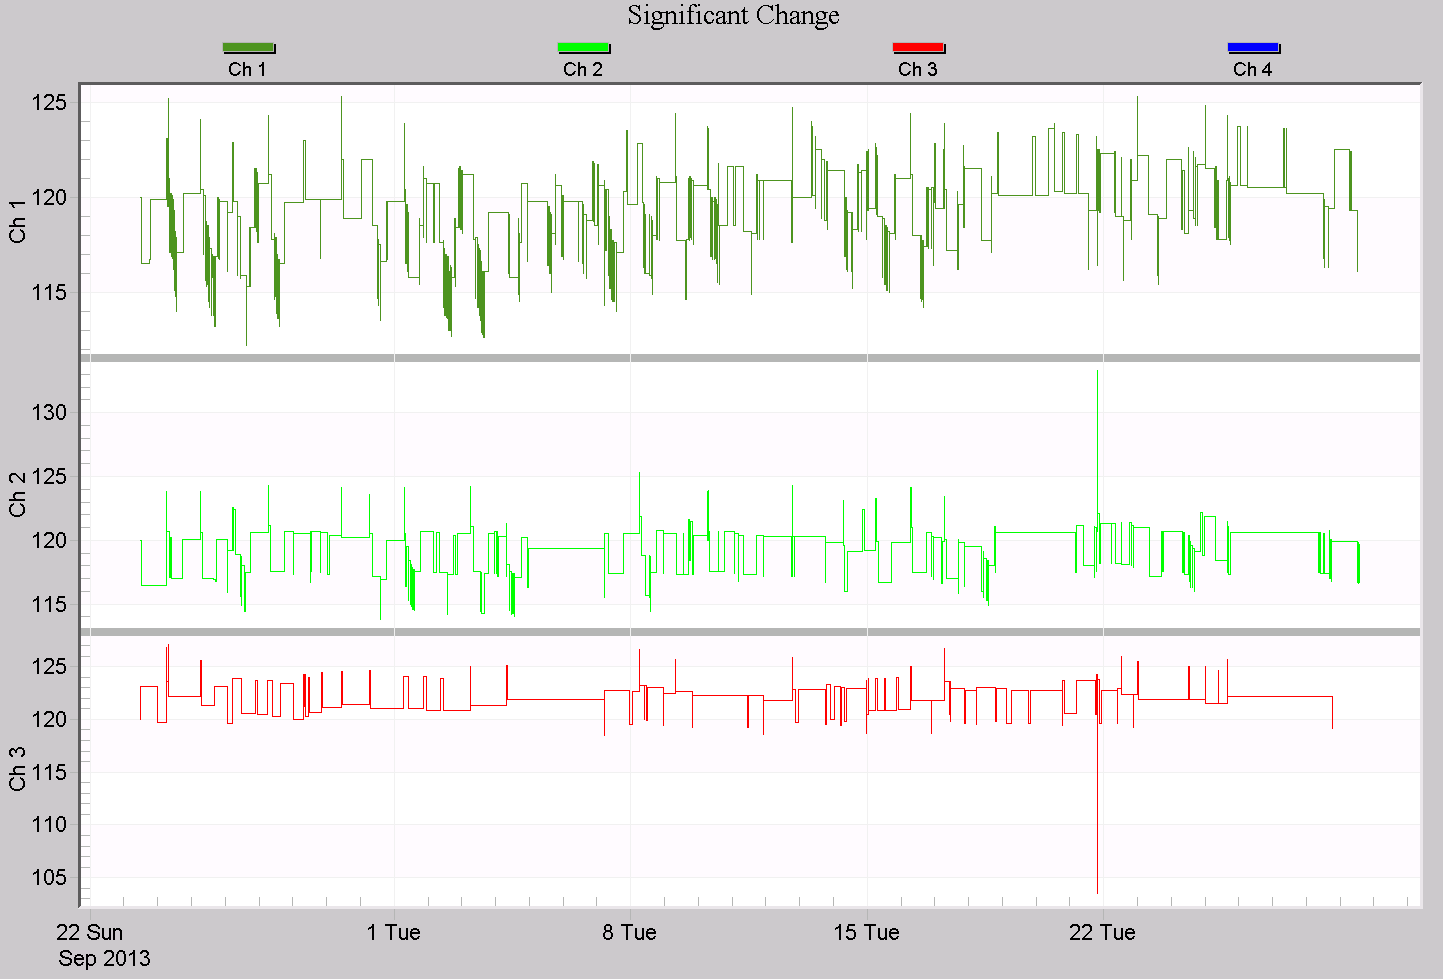
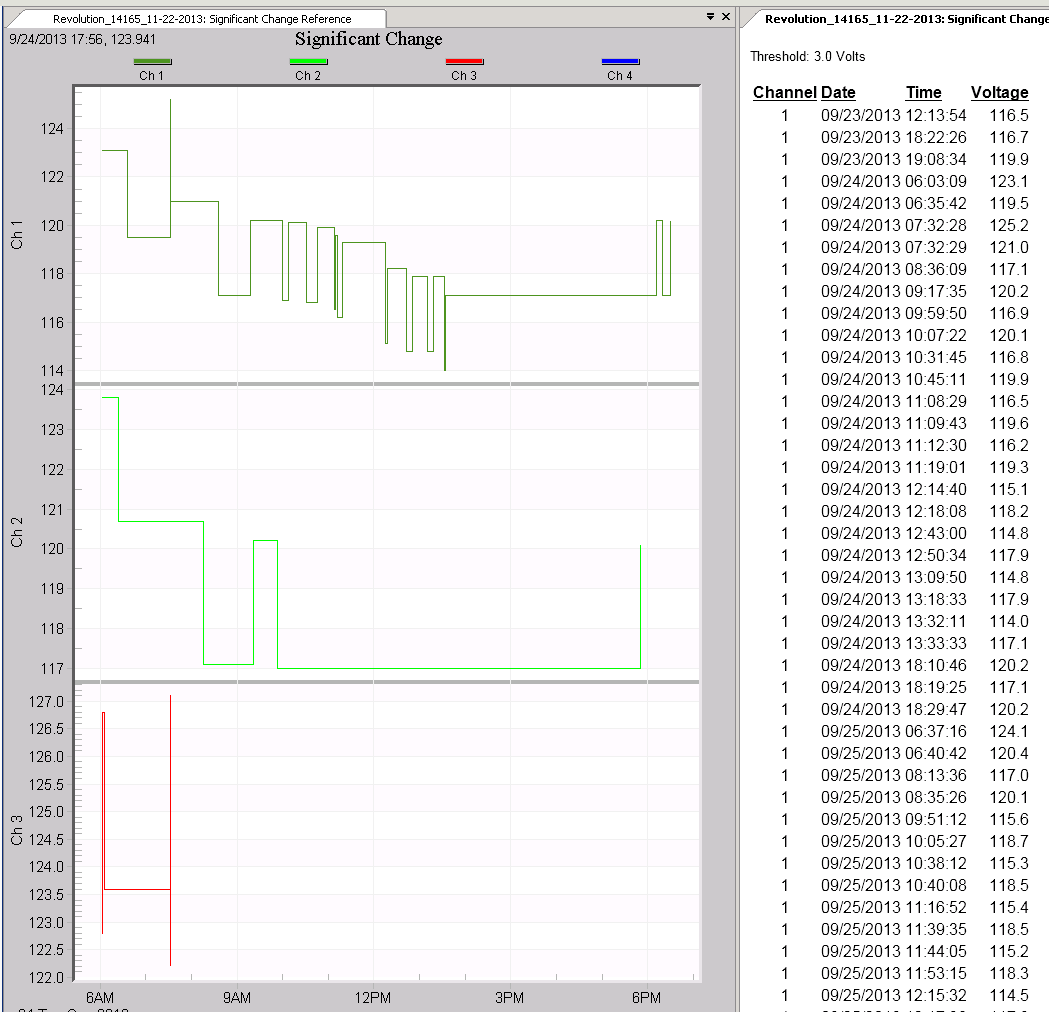
A corollary to the Significant Change Report, the Significant Change Graph is a stripchart of the reference voltage level. Since each trigger voltage forms the next reference level, the graph shows the triggered values at each trigger point (example in Figure 1). Each change in the reference level corresponds to a new Significant Change event, which is also available in report form. It’s important to keep in mind that after the trigger, the voltage may vary up or down from the new reference level by the threshold level (defaults to 3V) without triggering a new Significant Change. This means that even though the reference level is plotted as a flat horizontal line, the voltage may actually be moving around during that time, but within the threshold value. As soon as the voltage moves more than the threshold away from the reference, a new Significant Change reference is established, and the graph shows a change with 1 second resolution. Zooming into the graph in Figure 1, in Figure 2 the voltage movements in channel 1 on the Significant Change graph are reflected in the report version – the graph shows the reference voltage level each time a new event is triggered.
The Significant Change Graph always has one second resolution, but at the expense of some voltage resolution (within the threshold level). This can be viewed as a form of compression, where a longer recording time and/or higher time resolution is gained by trading off voltage resolution.
Using the Graph
There are several situations where the Significant Change graph can be used to augment or even replace the regular RMS voltage stripchart graph:
- When the stripchart interval is large (e.g. 15 minutes), combine the Significant Change graph with the RMS stripchart to get accurate RMS values with 1 second resolution
- When the stripchart wrapped around due to a very long recording (especially with a very short interval), use the Significant Change graph to fill in the missing portion.
- Use it for a simplified RMS stripchart, where just rough overall voltage levels are shown instead of full min/ave/max traces. This is also useful for providing a simplified voltage graph to customers or non-technical folks, without the complexity of the full stripchart.
In Figure 3, the Significant Change trace and RMS min/max/ave stripchart traces are shown on the same graph, using a mixed graph. The Significant Change is shown in blue, and roughly follows the RMS voltage steady-state changes. In this stripchart, a 1 minute average is used. During times where the blue Significant Change trace is flat, the actual voltage is still fluctuating, but always within the threshold value (3V here). As soon as it moves beyond that value, the trace moves. Since Significant Change may be triggered by a 1 cycle value, the reference voltage is sometimes influenced by quick sags, and if the average voltage is within the threshold, the reference stays at that sag value. This effect can be seen in the first portion of Figure 3, where the Significant Change is lower than the average volts for a few hours (but always within 3V).
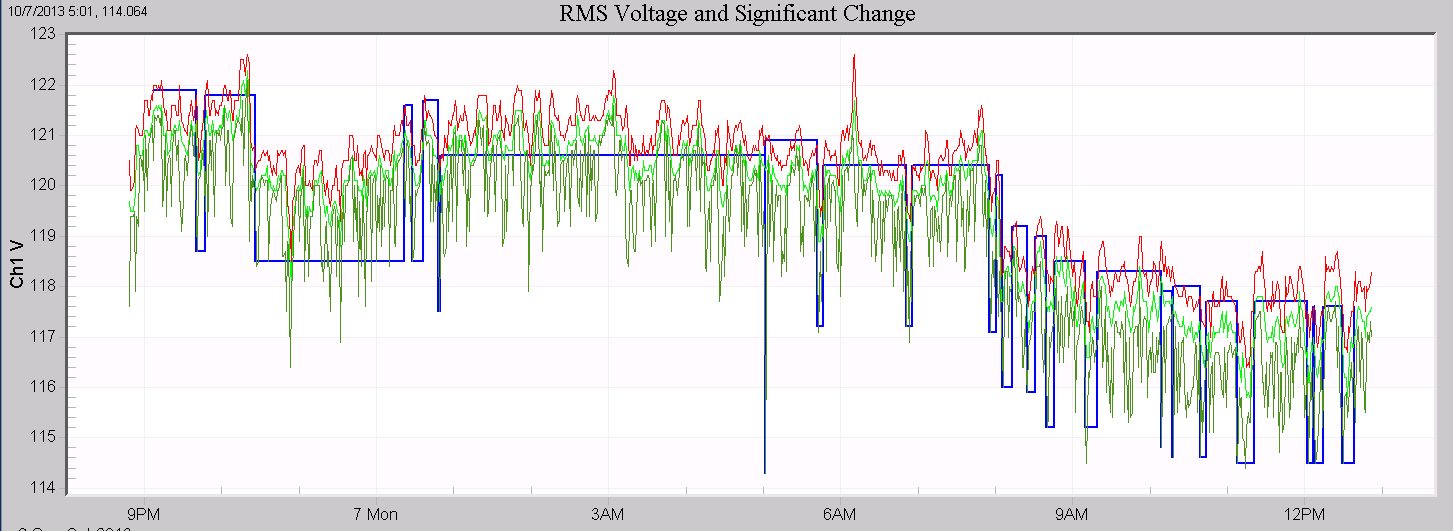
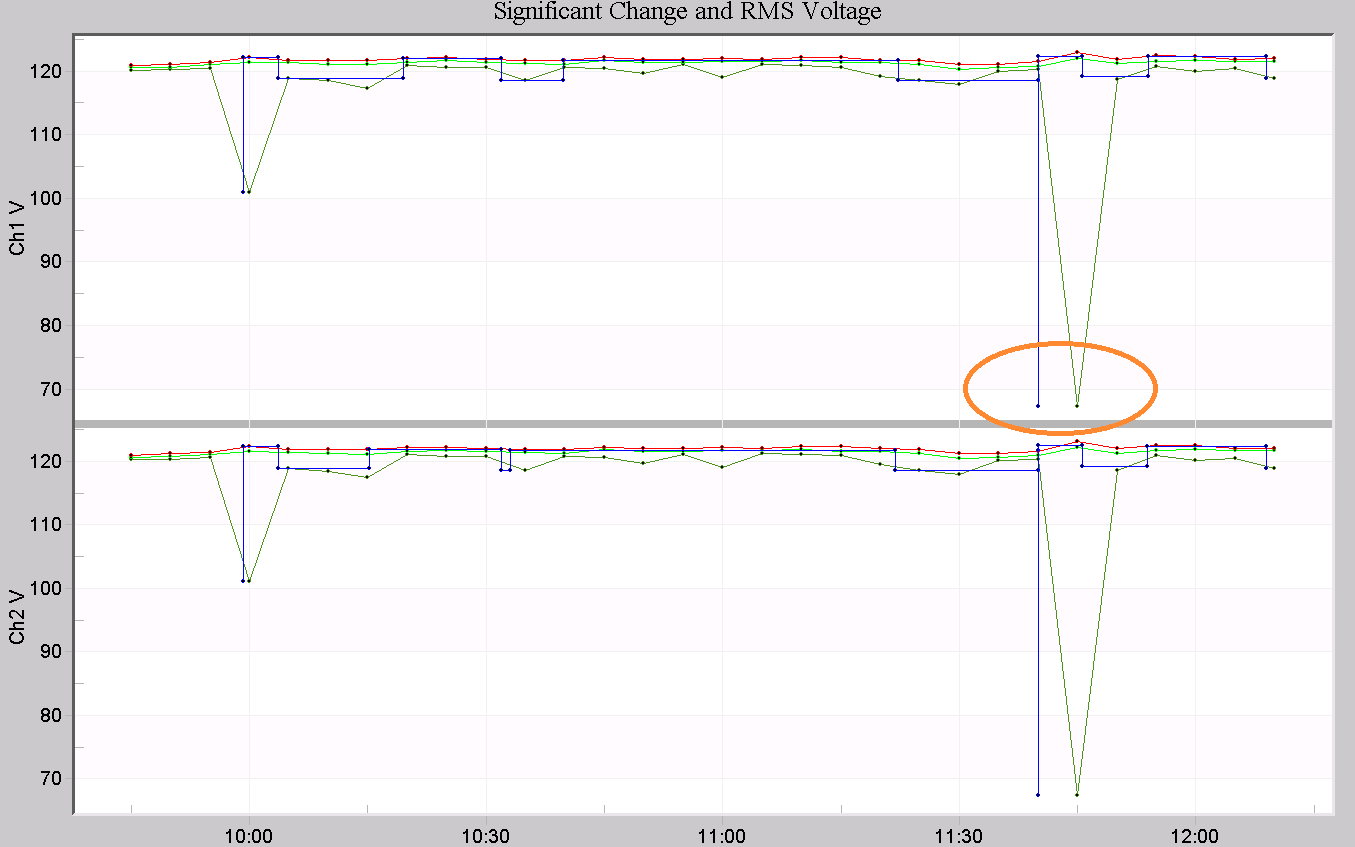
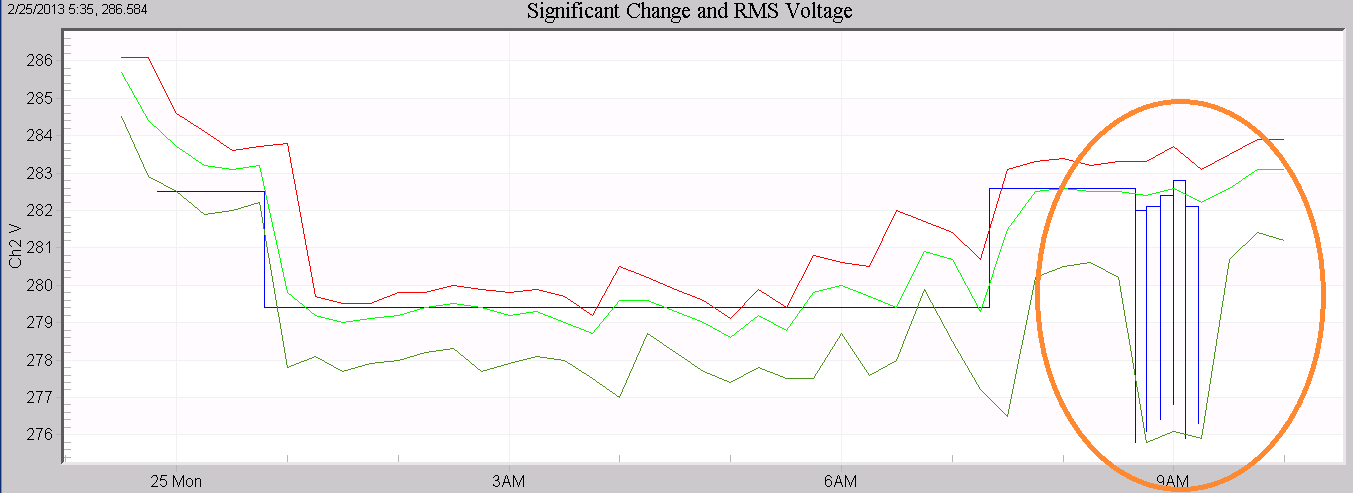
Figure 4 shows an example where a large stripchart interval, 5 minutes, presents some ambiguity as to the exact time of a voltage sag. The Significant Change trace (blue), is accurate down to 1 second for the same event. “Mark Data Points” is enabled on this graph, to illustrate the time resolution of the 5 minute stripchart points compared to the 1 second Significant Change resolution. Another example is shown in Figure 5, where a 15 minute stripchart interval is used. Within 15 minutes, several voltage fluctuations can occur, but with a single min/ave/max value in the stripchart, the time detail is lost. The Significant Change trace (blue) reveals this detail in channel 2, where the voltage moved more than the threshold several times.
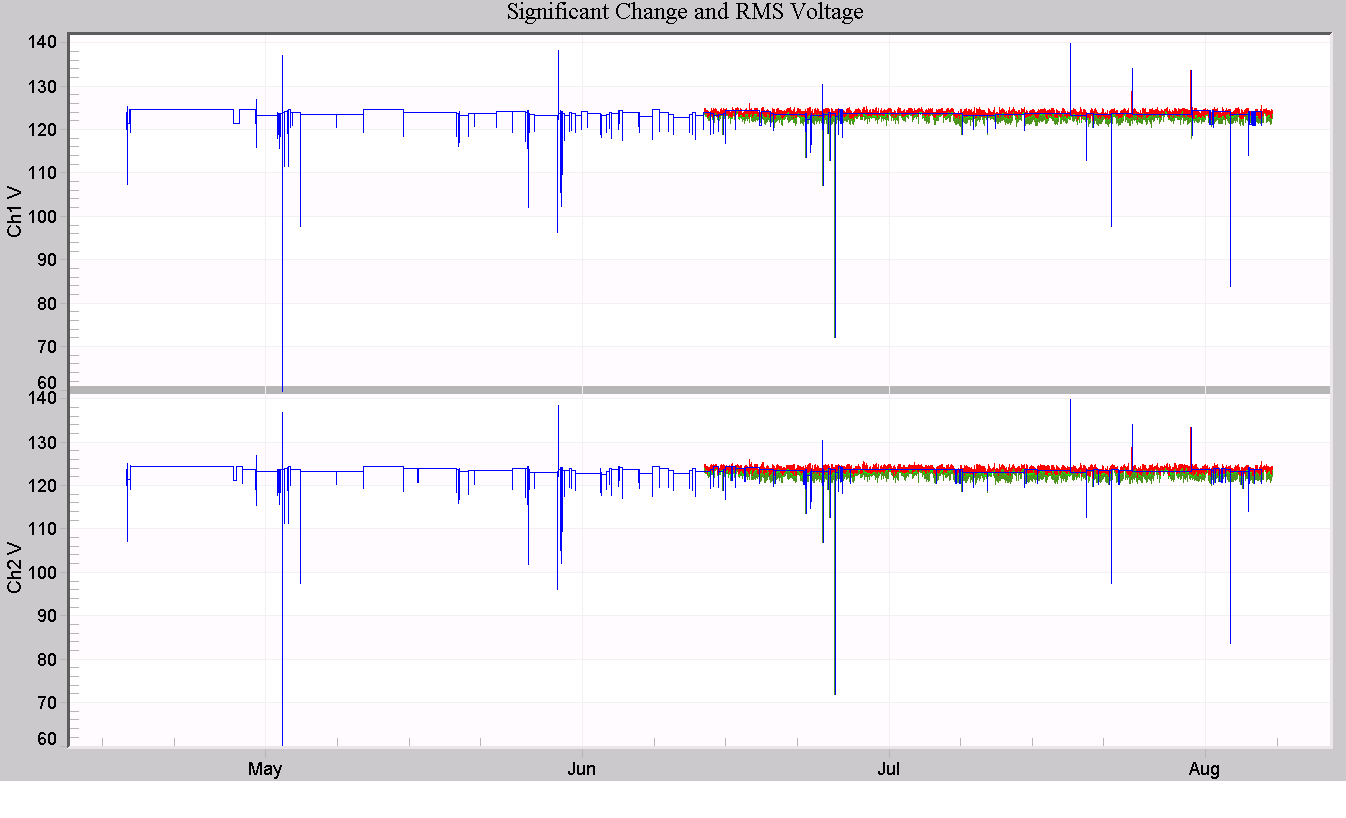
In very long recordings, it’s possible for the stripchart recording to overflow the available memory, and wrap around. In Figure 6, a 112 day recording is shown, using a 1 minute stripchart interval on an Eagle recorder. The RMS voltage stripchart only covers the last 50 days, but the Significant Change data covers the entire period. Since Significant Change events are only logged when triggered, it doesn’t use memory continuously, like the stripcharts. Here, the Significant Change data (in blue) can provide some detail on the first half of the recording, which is not present in the regular stripchart data.
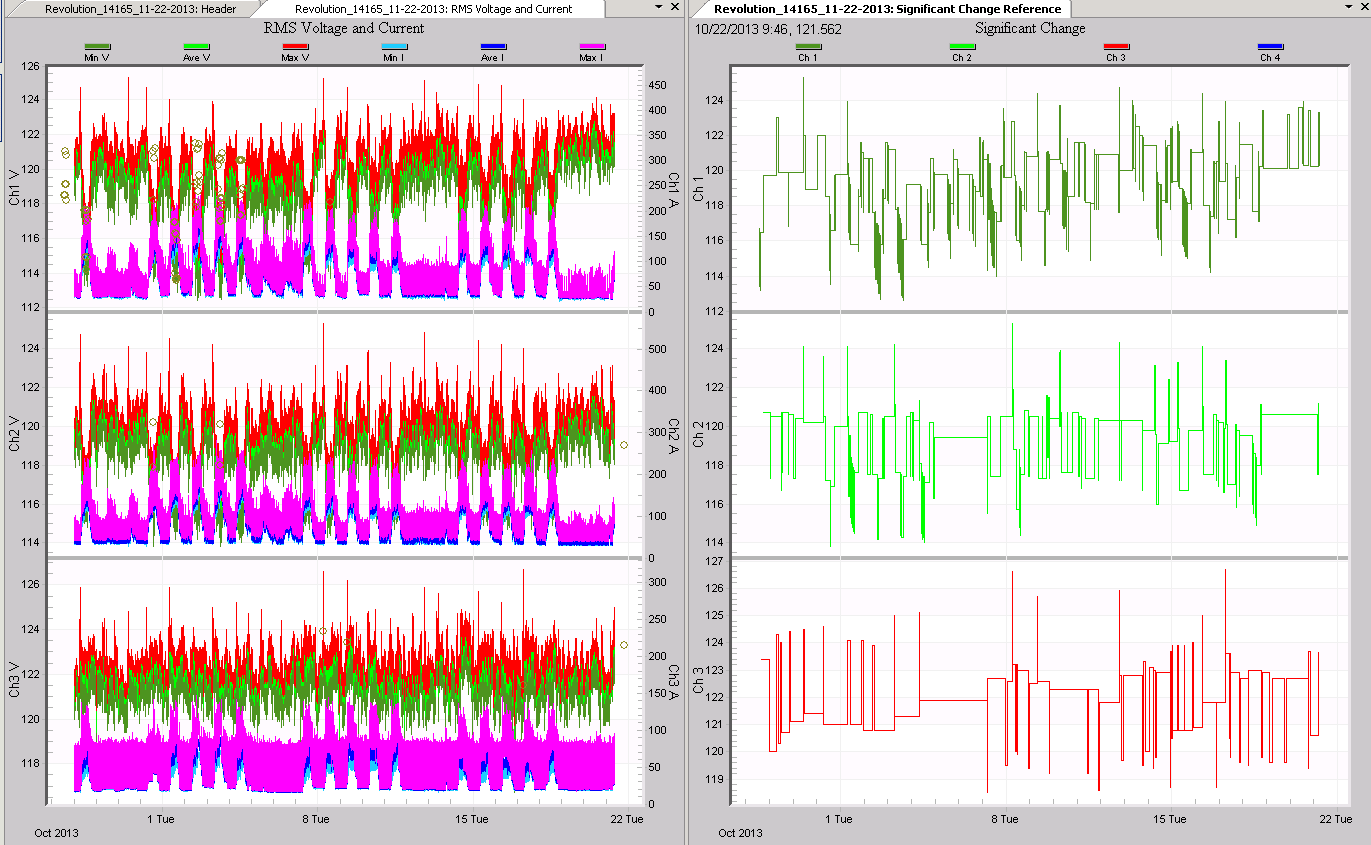
A final use for the Significant Change Graph is to provide a simplified graphical presentation, while still showing important voltage changes. This can be useful when sharing information with non-technical folks. In Figure 8, the default RMS Voltage and Current graph is on the left, and the Significant Change graph on the right. The Significant Change graph captures most of the important voltage detail without providing an overwhelming amount of data for someone not accustomed to PQ. It’s possible to remove traces or display some of the simpler built-in voltage stripcharts, but only the Significant Change Graph can give one cycle min/max values along with steady-state information in a single trace per channel.
Conclusion
The Significant Change graph can be used to augment the information in the normal RMS stripcharts in several ways. Since it’s a triggered record type, memory usage is not continuous, and it provides one second time resolution with one cycle RMS resolution. This unique graph can provide extra insight into long recordings.
