Introduction
PMI View for iOS continues to evolve with new features and improvements since our last white paper. This document highlights the significant additions that enhance your ability to perform power quality analysis in the field.
Through multiple releases, we’ve focused on streamlining common workflows, adding powerful new analysis tools, and improving the overall user experience. These updates reflect direct feedback from power quality professionals who use PMI View daily for critical field operations.
The application now requires iOS/iPadOS 17.0 or later, taking advantage of the latest platform capabilities to deliver better performance and reliability. Notable additions include a revamped device management system, enhanced recording templates, expanded visualization options, and new tools for validating equipment hookups.
At a Glance
This white paper explores the following major additions to PMI View:
- User Interface and Quality of Life Improvements:
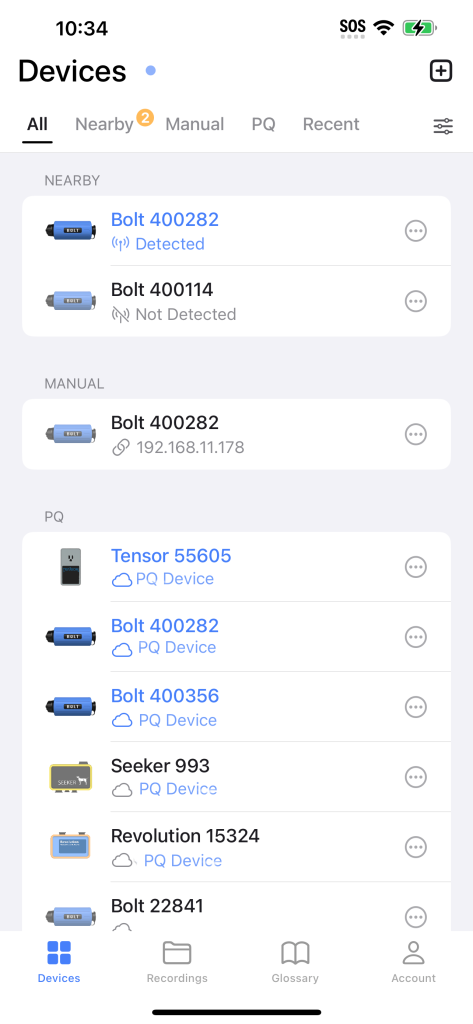
- Redesigned device list with filtering and pinning capabilities
- Initialization countdown timer for better recording setup
- Proactive incorrect hookup detection and warnings
- Streamlined side menu for quick access to essential tools
- Enhanced Recording Features:
- Comprehensive inspection tools for interval data
- Advanced waveform navigation and filtering
- Customizable histogram visualization
- Template and Settings Management:
- Import and edit recording templates
- Undo/redo capability for configuration changes
- Device settings retrieval and modification
- Quick recording restart functionality
- Live Data Visualization:
- New harmonics meter for real-time analysis
- Enhanced waveform plotting options
- Multi-view support: line-to-line, 3-phase
These additions complement PMI View’s core functionality while introducing new tools to make your power quality analysis more efficient and effective.
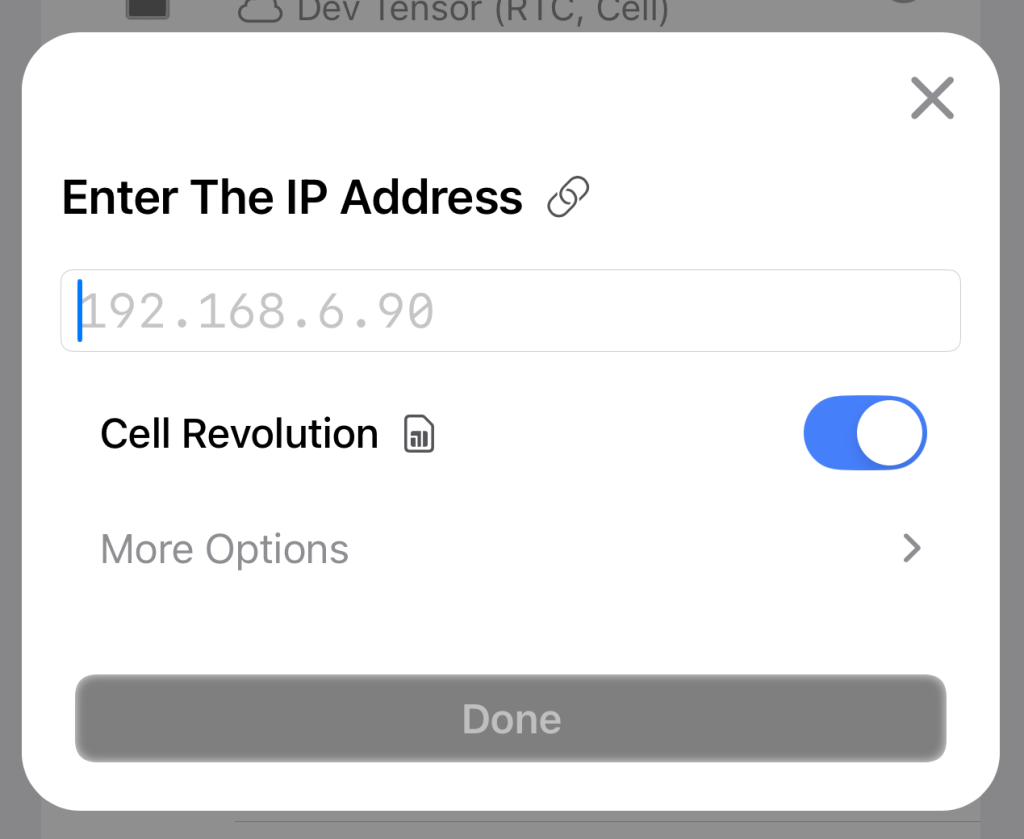
Cellular Revolution Support
PMI View now provides limited support for Revolutions with cell communication:
- Add Device (Plus icon on the top right hand)
- Select “Manual”
- Select “Enter IP Address”
- Toggle “Cell Revolution” on
- Enter your Revolution’s IP address, then press “Done”
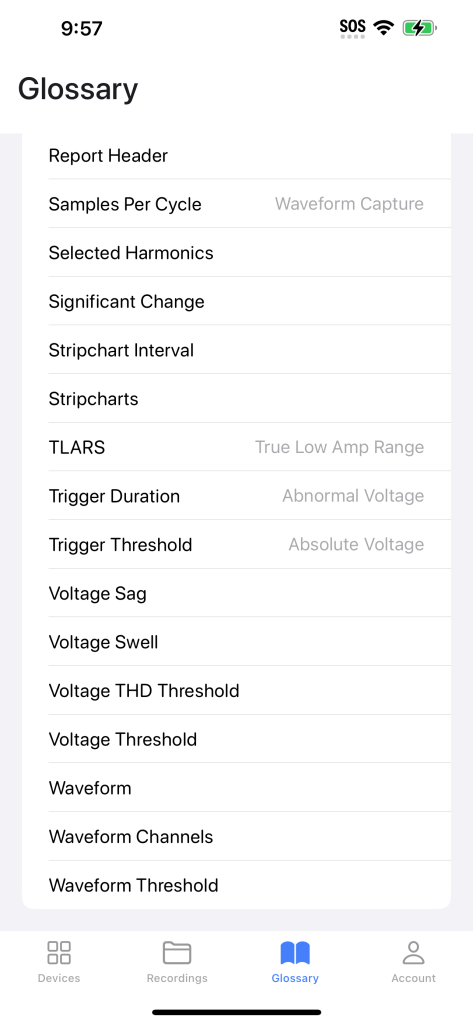
Glossary
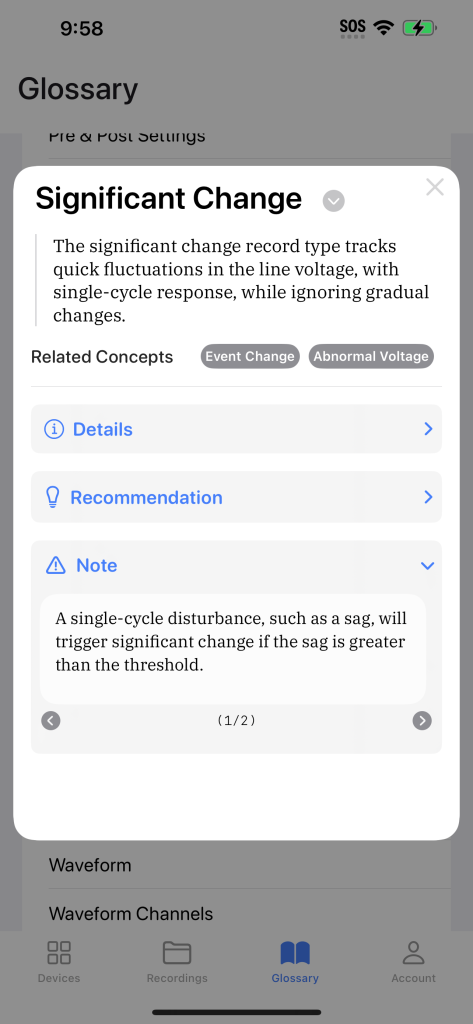
PMI View now includes an integrated glossary that serves as a helpful reference for PMI data types and power quality terminology. Users can access detailed explanations of technical terms directly within the app, complete with practical usage notes and related concepts. Depending on the term, you’ll find helpful sections such as:
- Details: In-depth information
- Notes: Important considerations about the parameter or data type
- Use: Common cases where the recorded data can provide insights, or when to use an initialization parameter
- Recommendations: Recommended values for parameters
- Tips: Helpful tips to consider
- What’s Recorded: What data is recorded or displayed
Recording Features
PMI View enhances your ability to analyze power quality data by improving our recording management and inspection tools.
Recording Inspection
PMI View makes it simple to review and analyze your power quality data on-the-fly.
Interval Data
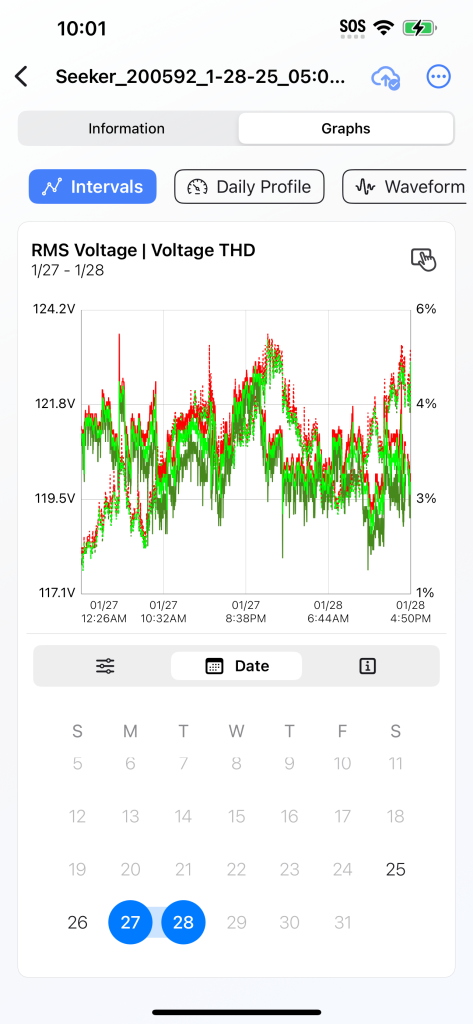
The interval graph is one of the most useful record types. In a single interval graph, you can see power quality events such as single-cycle voltage sags and current surges, as well as long-term voltage trends. Users can now examine an entire recording session at a glance, with the interval data view.
- Dual-Measure Comparison: Plots your chosen measurement (e.g., RMS Voltage, Current, Power Factor) over time on dual Y-axes, making it easy to compare two measures side by side.
- Calendar Navigation & Zoom: Use the calendar to easily jump to specific days or weeks, and pinch-to-zoom horizontally for finer resolution.
If the zoom feature is locked (indicated by a lock icon), simply narrow the date range to enable zooming.
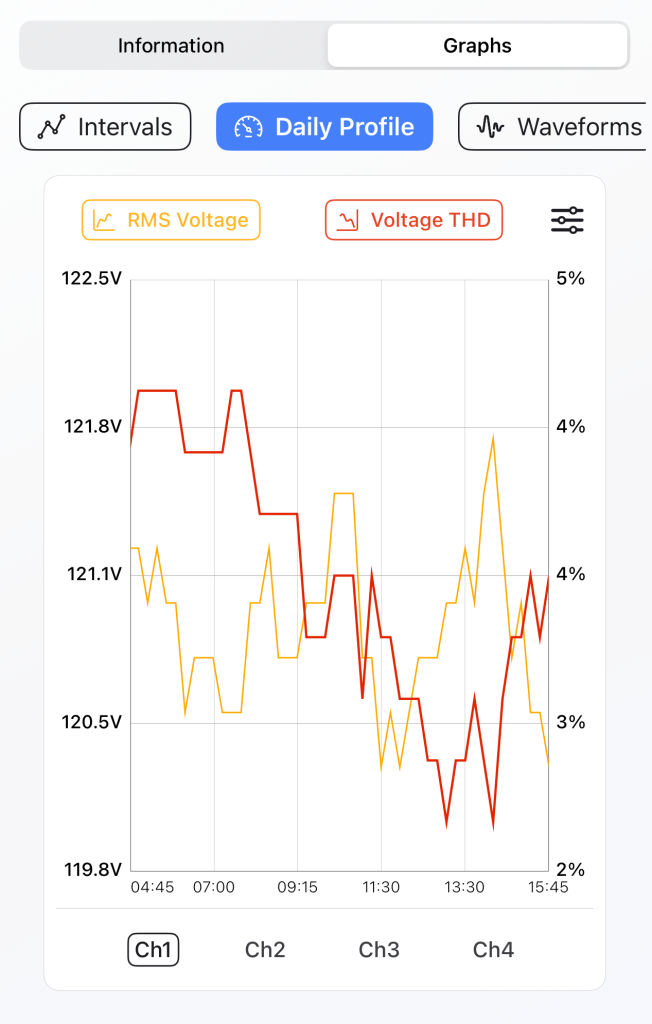
Daily Profile
Designed for identifying recurring daily patterns, Daily Profile displays recorded data into a single 24-hour timeline. Zoom gestures are supported for finer resolution. This allows you to compare measurements from the same time on different days, revealing peaks and valleys that repeat day after day.
Selecting the options icon allows you to customize the chart event further.
- Dual-Chart Comparison: Activate the “Second Chart” option to place two parameters side by side (e.g., Voltage on Chart 1 and Current on Chart 2).
- Flexible Appearance Settings: Adjust chart colors, toggle 24-hour clock labels, and pinch-to-zoom into smaller segments for detailed inspection.
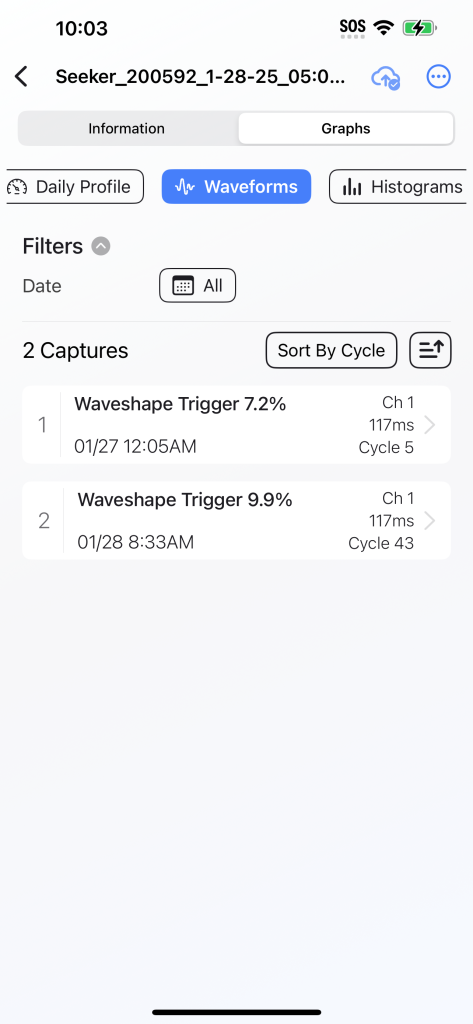
Waveforms
Waveforms give you a closer look at individual events triggered by conditions like sags, swells, or transients. With clues provided by the waveform shapes, it is sometimes possible to determine the cause of a voltage disturbance. PMI View allows users to examine waveform traces from a recording in detail.
- Organized Capture List: Sort waveform captures by date, cycle number, or event magnitude; filter them by trigger type.
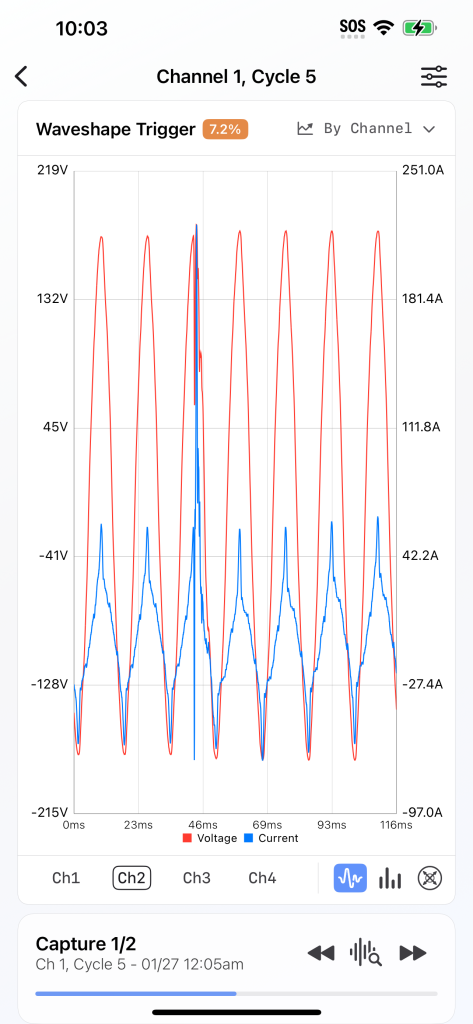
- In-Depth Analysis: Open an interactive plot to zoom in horizontally, and switch between waveforms, harmonics, or vector diagrams.
- Customizable Display: Toggle legends, change trace colors, or disable the fundamental for harmonic views.
- List Navigator & Quick Jump: Quickly move forward or backward through captures using on-screen arrows.
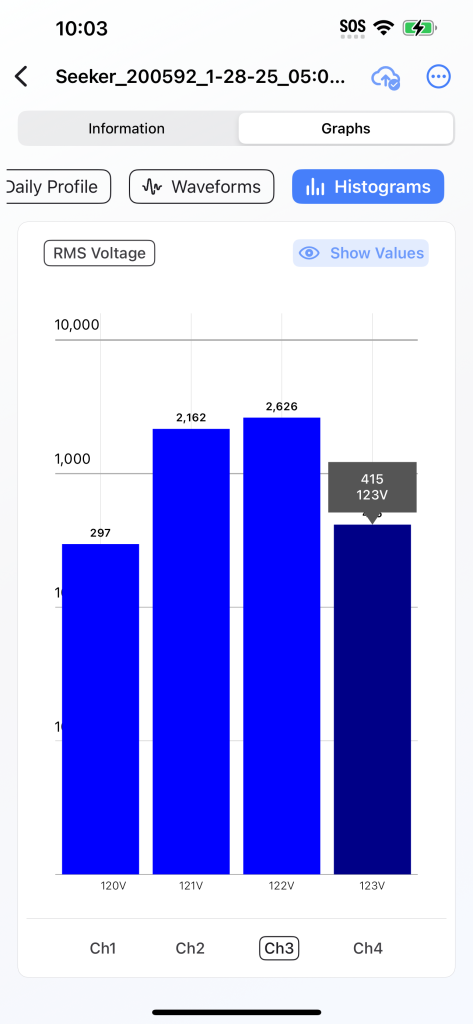
Histograms
Histograms give you a statistical perspective on your data by showing how often certain parameter ranges occur, helping you spot outliers or confirm nominal operating conditions at a glance.
- Interactive: For measures with a wide range, users can pinch-to-zoom the graph, and tap any bar to see an informative overlay.
Through all these recording inspection features PMI View offers a valuable toolkit for detailed power quality analysis on the go. Whether you need a high-level overview or a detailed second-by-second examination of an event, the interface is designed to give users the tools they need.
Recording Template Management
PMI View has introduced a new interface for managing both downloaded recordings and recording templates—making it easier than ever to organize, edit, and deploy your preferred configuration settings.
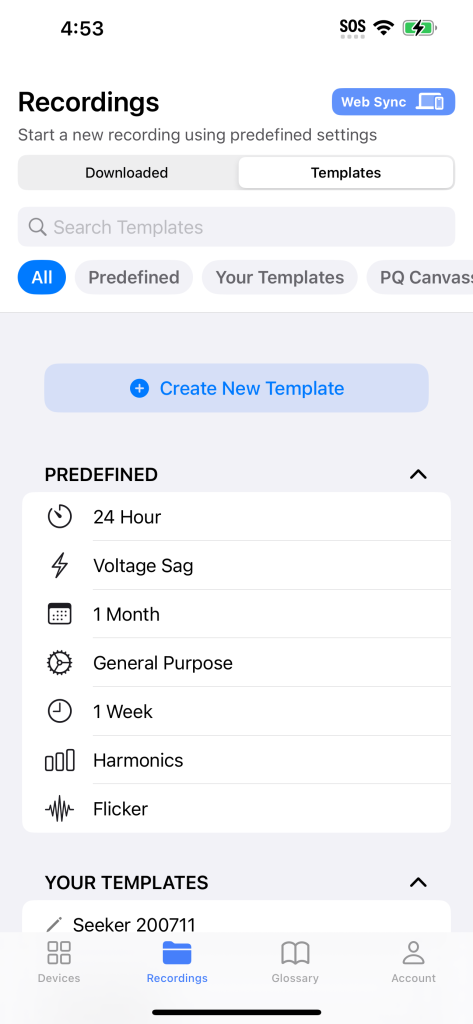
Integrated Recordings Tab
All recording content—both downloaded recordings and initialization templates—is grouped under a single “Recordings” tab. Within this tab, you can quickly switch between Downloaded recordings you’ve already retrieved from devices and Templates you can use for future recordings.
For both tabs, users can utilize the search bar to quickly find what they need. For templates, the toolbar lets you filter by:
- All: Everything in one list
- Predefined: Built-in templates that come with PMI View
- Imported: Imported XML templates created from ProVision
- Your Templates: Any templates you have created or saved
- PQ Canvass: Templates imported from your PQ Canvass account
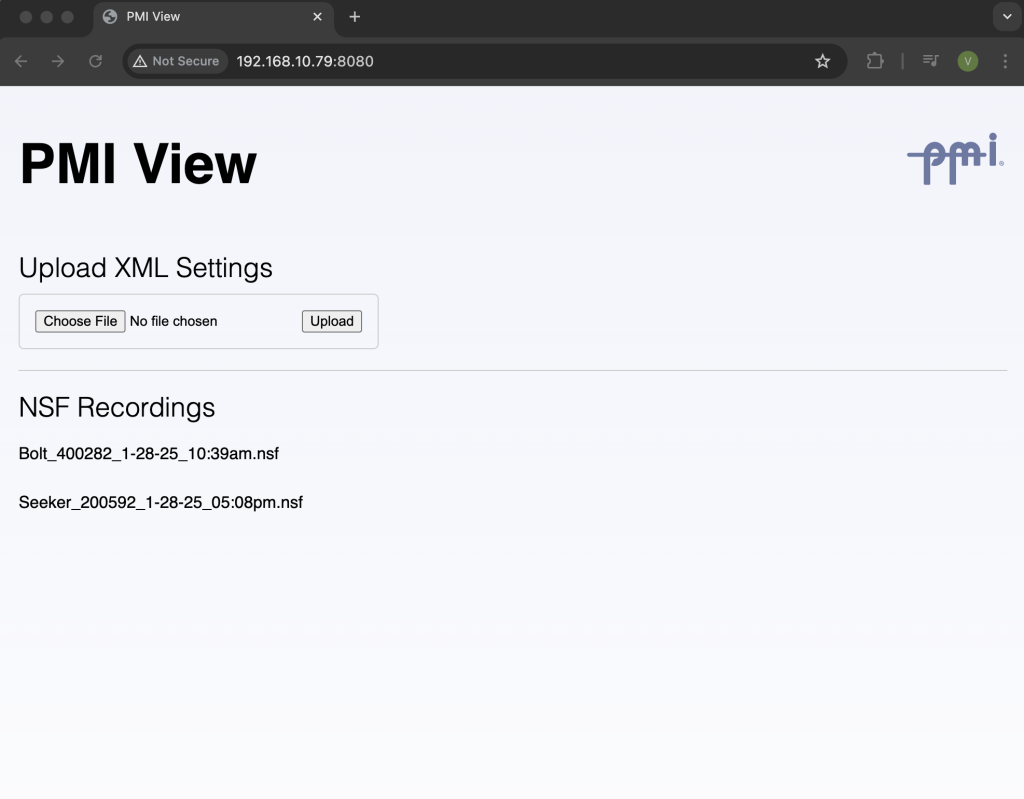
Web Sync & Imported Templates
Beyond the built-in template set, you can import custom templates or configurations from external sources. Using the new Web Sync feature, PMI View will accept XML-based settings created with ProVision. Once imported, these templates become available in your list under “Imported”.
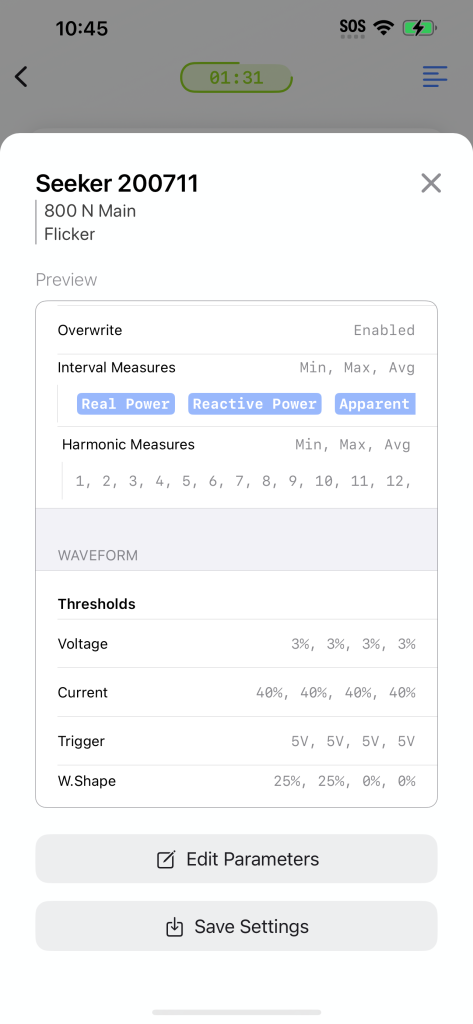
Quick Inspection
PMI View has added a preview window to quickly examine a recording template without having to go into the editor. It also displays the recording header at the top, making it easier for field staff to pick the right template at a glance.
Recording Initialization
PMI View now supports full recording initialization directly from the app, featuring an interface designed specifically for mobile. By utilizing intuitive controls like scroll wheels and number lines, PMI View makes precise edits on a mobile screen fast and frictionless. The app offers full support for all parameters, from the interval measures to waveform triggers.
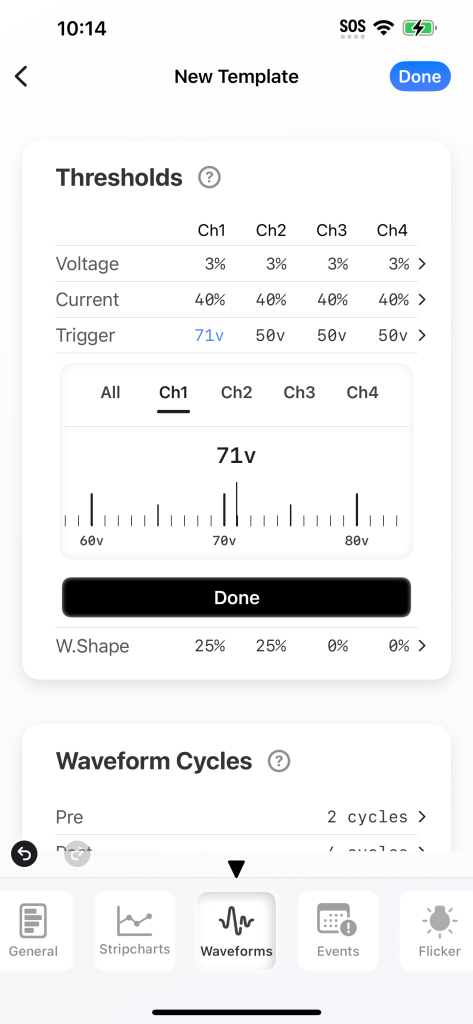
PMI View also introduces new features to help users during template configuration.
- Undo/Redo Capabilities: PMI View also has the ability to undo or redo changes to your initialization template before you finalize them.
- Helpful Hints and Recommendations: Next to the parameter fields is a small question mark (?) icon. Tapping it displays a brief explanation of the parameter, typical ranges, and any recommendations or best practices. These hints ensure that even less frequent users or new team members can configure settings with confidence or avoid unnecessarily modifying advanced parameters.
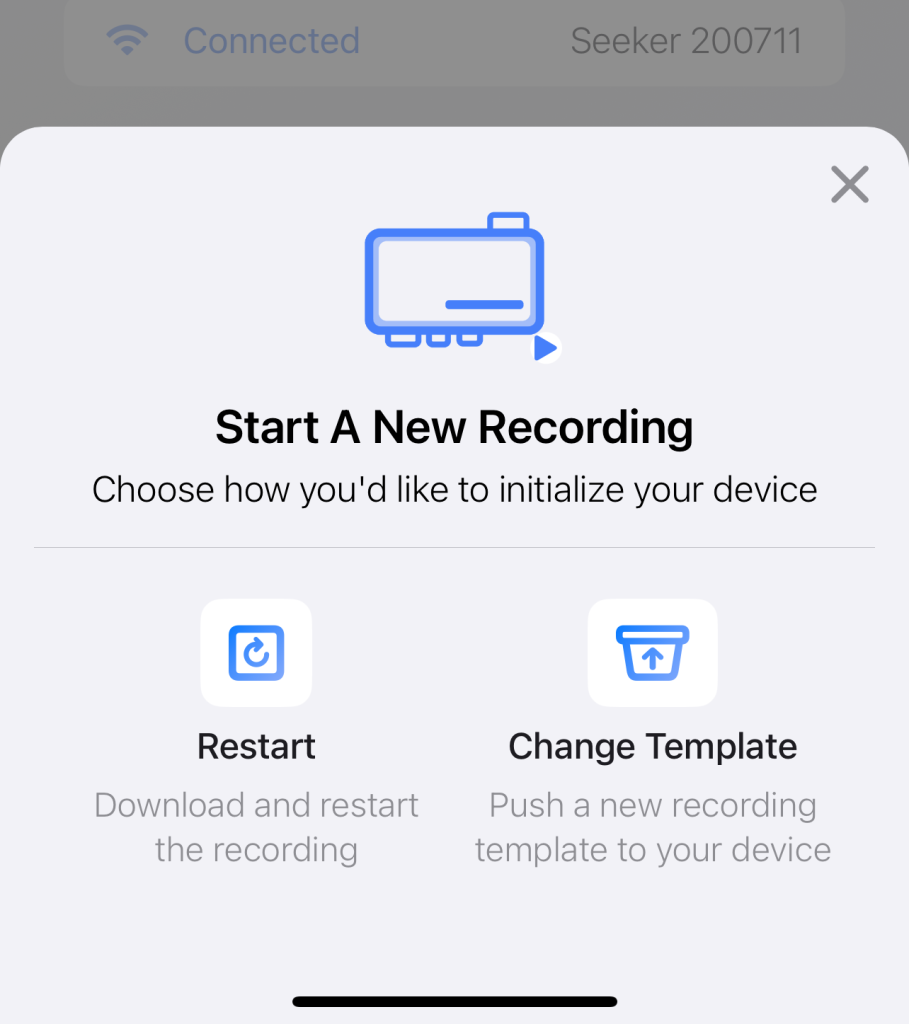
When you connect to a device and select Start a New Recording, PMI View presents a popover of initialization options. You can:
- Restart: Download the current recording (if any) and then re-initialize it using the same settings.
- Change Template: Push a brand-new configuration template to the device, overwriting the existing setup.
- If desired, you will be prompted with the option to download the current recording before the recorder is initialized.
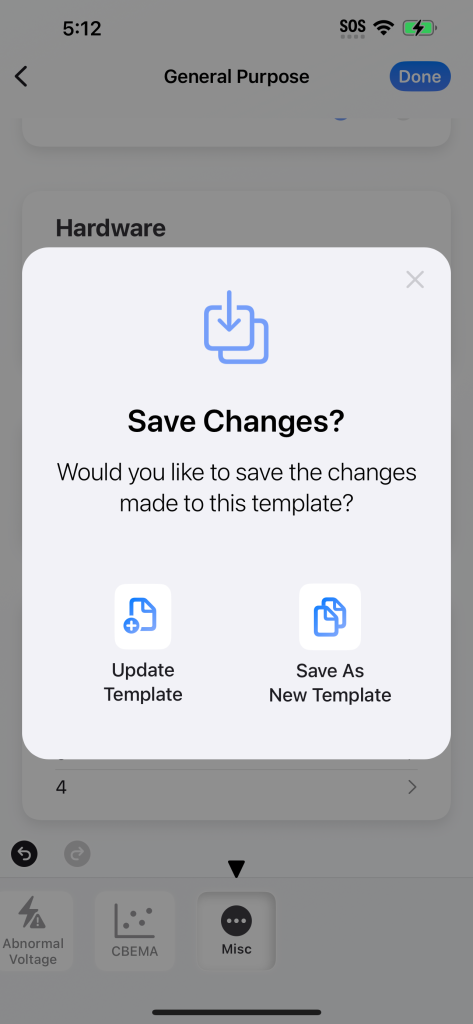
Editing a Template
From any template’s preview screen, a single tap on Edit Parameters opens up full configuration details. After making changes, you have two choices:
- Save Changes Locally: Overwrite the existing template on your device.
- Save As New Template: Preserve the original while keeping your edits in a separate entry.
Device Menu
PMI View enhances the device menu with new operational controls and monitoring features.
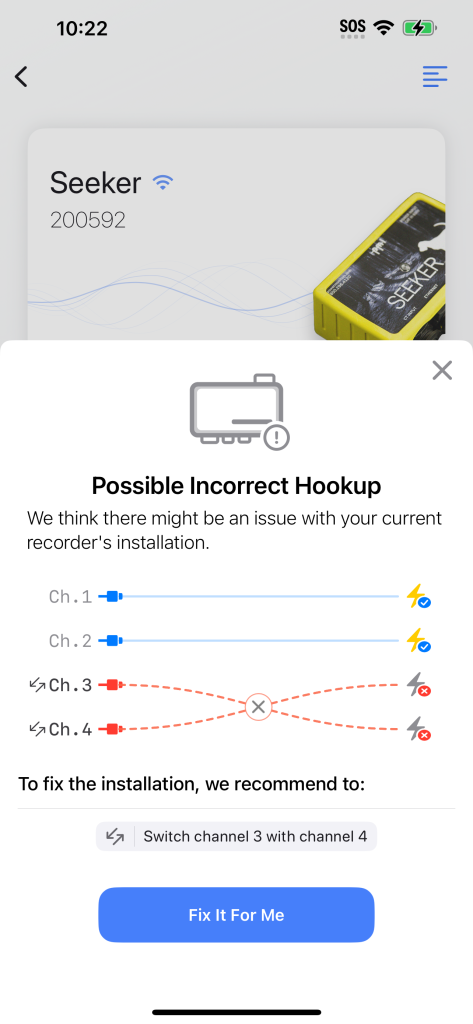
Hookup Validation
For all PMI devices, PMI View can now analyze live data to detect potential wiring or installation mistakes. If a potential error is found—such as reversed CT phases—an alert is shown at the top of the header. Furthermore, PMI View also shows the steps necessary to fix any potential connection or hookup errors.
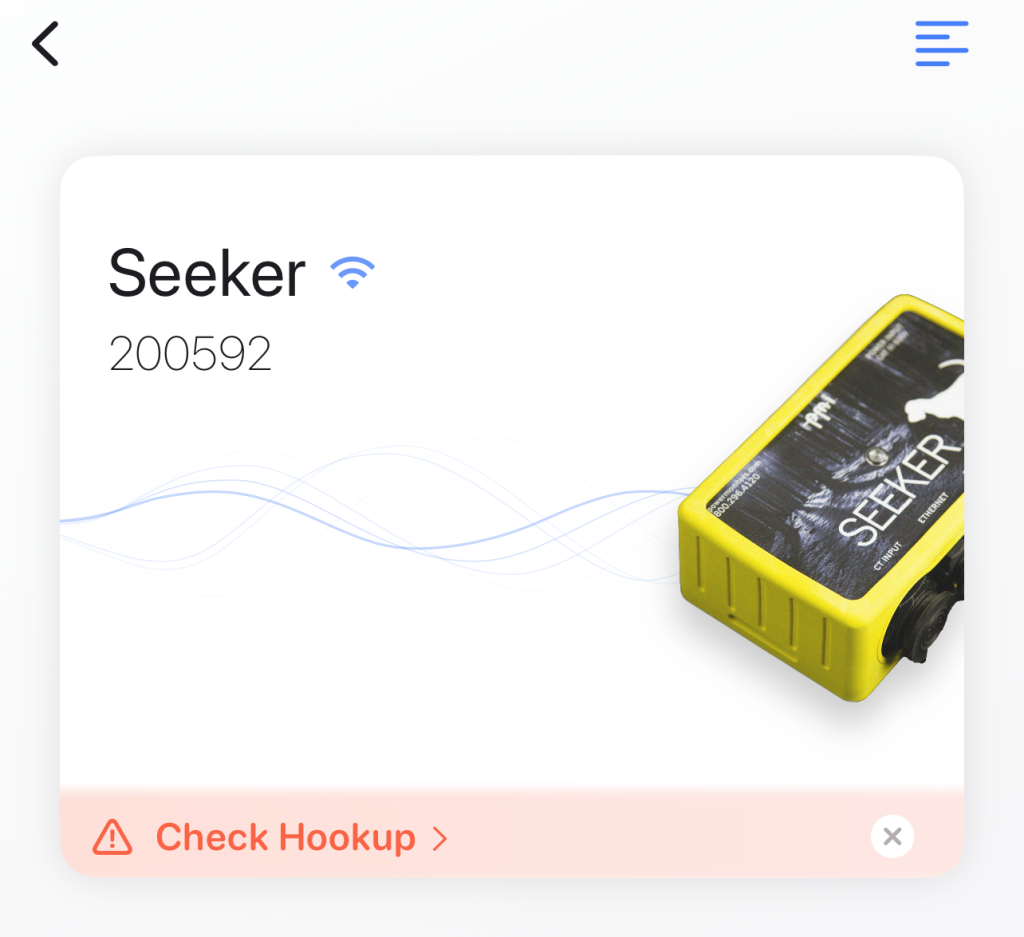
When a user connects to a device, PMI View will automatically start validating its installation. Tapping the display warning shows a detailed visual breakdown of the steps needed to take to fix the suspected problem.
- For users who wish to ignore these warnings, simply tapping the side menu and tapping “Disable Warnings” hides any hookup warnings. Users can also re-enable them following the same steps.
Initialization Countdown Timer
A countdown timer will now display to show how long until the device finalizes its initialization. This will appear regardless of initialization source (PQ Canvass, ProVision, etc.). Specifically, this screen shows how much time is remaining in the 2 minute countdown period that occurs immediately before the recorder begins its recording session.
Live Data Changes
PMI View also introduces some improvements to live data in order to enhance real-time power quality assessment in the field.
Harmonics Meter
The new harmonics meter provides a real-time view of harmonic content, allowing users to quickly analyze issues related to harmonic distortion.
- Real-time display up to the 16th harmonic
- Support for up to the 51st harmonic on compatible devices
Waveforms
PMI View has extended the live waveforms by adding new plots, and making it easier to compare diagrams.
New Plots: Tapping the drop-down menu on the top-right hand side of the waveform chart presents various plot options:
- Line-to-Line: Displays delta voltages between lines
- By Channel: Displays the Voltage & current for the selected channel
- By Measure: Displays all channels for the selected measure
- Integrated harmonic and vector diagram access directly from waveform chart
- For devices with an auto-corrected CT hookup, users can show the raw waveform before and after the channel map is applied
Conclusion
The latest iteration of PMI View represents a significant advancement in mobile power quality analysis. With streamlined device controls, expanded recording options, and better real-time analysis tools, PMI View makes power quality assessments simpler and more efficient. The new device management interface simplifies connections across multiple device types, while proactive hookup validation helps prevent common field mistakes before they impact data collection. Enhanced recording inspection tools, from interval graphs to daily profiles, provide useful insight into power quality data directly from mobile devices. The addition of comprehensive template management and initialization features ensures consistent, accurate device configuration across an organization. These improvements, combined with an intuitive mobile-first interface, establish PMI View as an essential tool for modern power quality analysis.
Feedback
The continuous evolution of PMI View is driven by the valuable input we receive from power quality professionals who use our software daily. We encourage users to share their experiences, suggestions, and feedback by contacting our development team at support@powermonitors.com.
