Abstract
The CBEMA and ITIC curves are used to show voltage events. Some PMI recorders can record these events and then ProVision can be used to plot these events on the CBEMA and ITIC curves. If you have a recording from a device that cannot record ITIC events directly, you can still plot these events by hand. To plot an event on these curves you need voltage change and event duration. The method for plotting an event on the ITIC curve from ProVision data is shown here.
What Are CBEMA and ITIC Curves?
The CBEMA and ITIC curves are both used to visibly represent voltage events. The terms and associated curves are used somewhat interchangeably even though there are subtle differences between the two. The CBEMA (Computer Business Equipment Manufacturers Association) curve was originally created in the 1970’s. It is designed as a guideline for manufacturers in designing computer equipment and defines various regions based on input voltage where computer equipment may encounter operational issues and the region that can be tolerated by most computer equipment.
Voltages overages of durations above the curve can damage equipment and voltages and durations under the curve can cause operational issues. The ITIC (Information Technology Industry Council) curve is a modified version of the CBEMA curve created in the 1990’s. The ITIC curve also defines regions based on input voltage but in a clearer fashion with discrete steps.
Either curve can be used to create a visual representation of voltage acceptability by plotting the magnitude and duration of voltage events. For more information about the CBEMA and ITIC curves see the whitepaper titled “CBEMA and ITIC Curves.”
ProVision Example
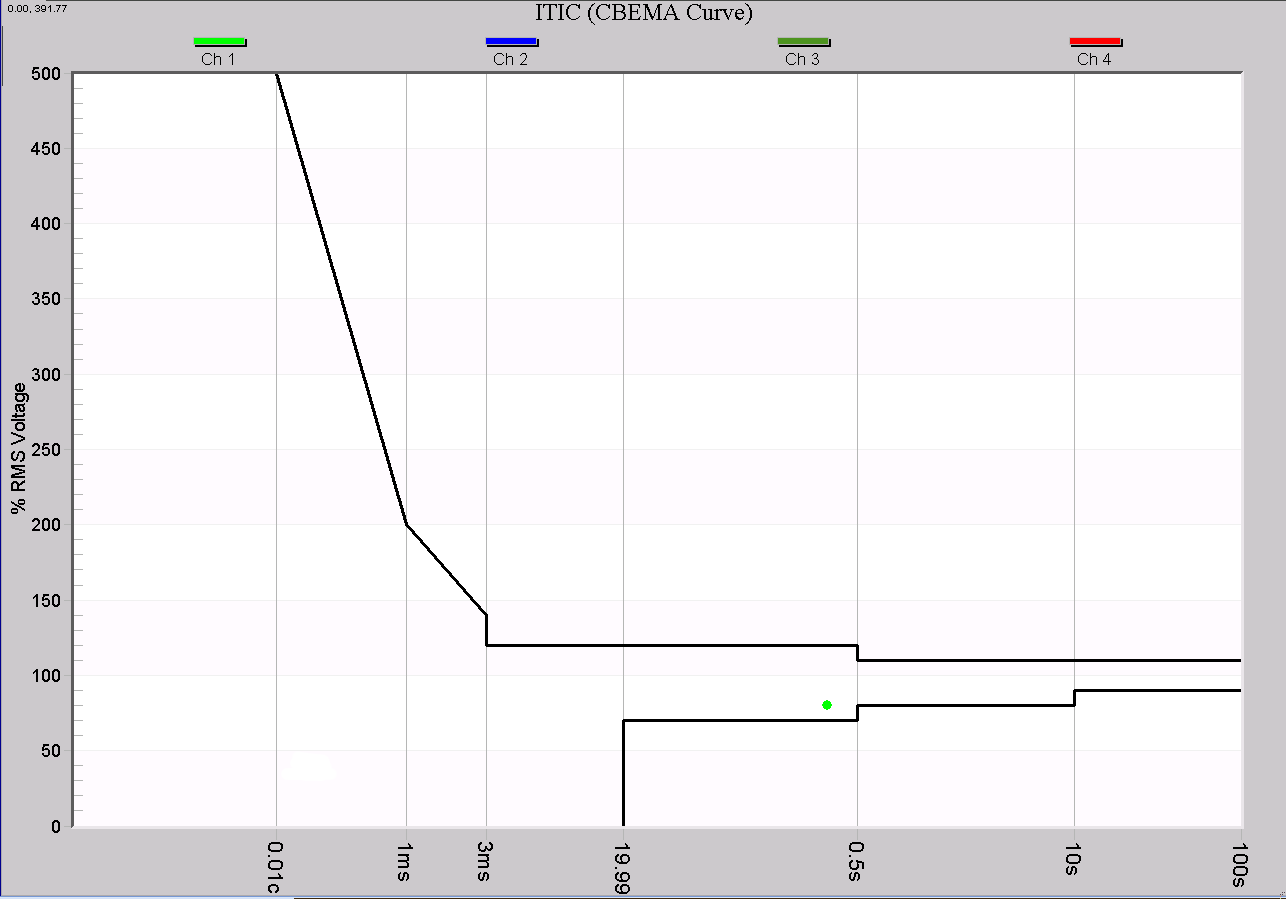
Some PMI recorders, such as the Revolution, record CBEMA/ITIC events. Figure 1 shows an ITIC curve generated in ProVision from a Revolution recording. Here the event is already plotted on the curve, so no further calculations are needed.
Graphing the CBEMA/ITIC Curve by Hand
The Revolution implements CBEMA/ITIC recording directly, with events plotted on the curve displayed in ProVision. If you have data from a recorder that cannot measure ITIC events directly, you can still plot these events by hand. To plot an event on these curves you need voltage change and event duration.
Graphs like the stripchart show voltage dips, and may contain limited duration information, but there may be several problems using just stripchart data for ITIC event plotting. First the recording interval can be too large to be able to determine accurate information. The stripchart show one cycle min/max values, but the duration resolution is usually limited to the stripchart interval timescale. Second, the scaling can cause small changes hard to see. The waveform capture has the information we need but it also can be hard to determine these values.
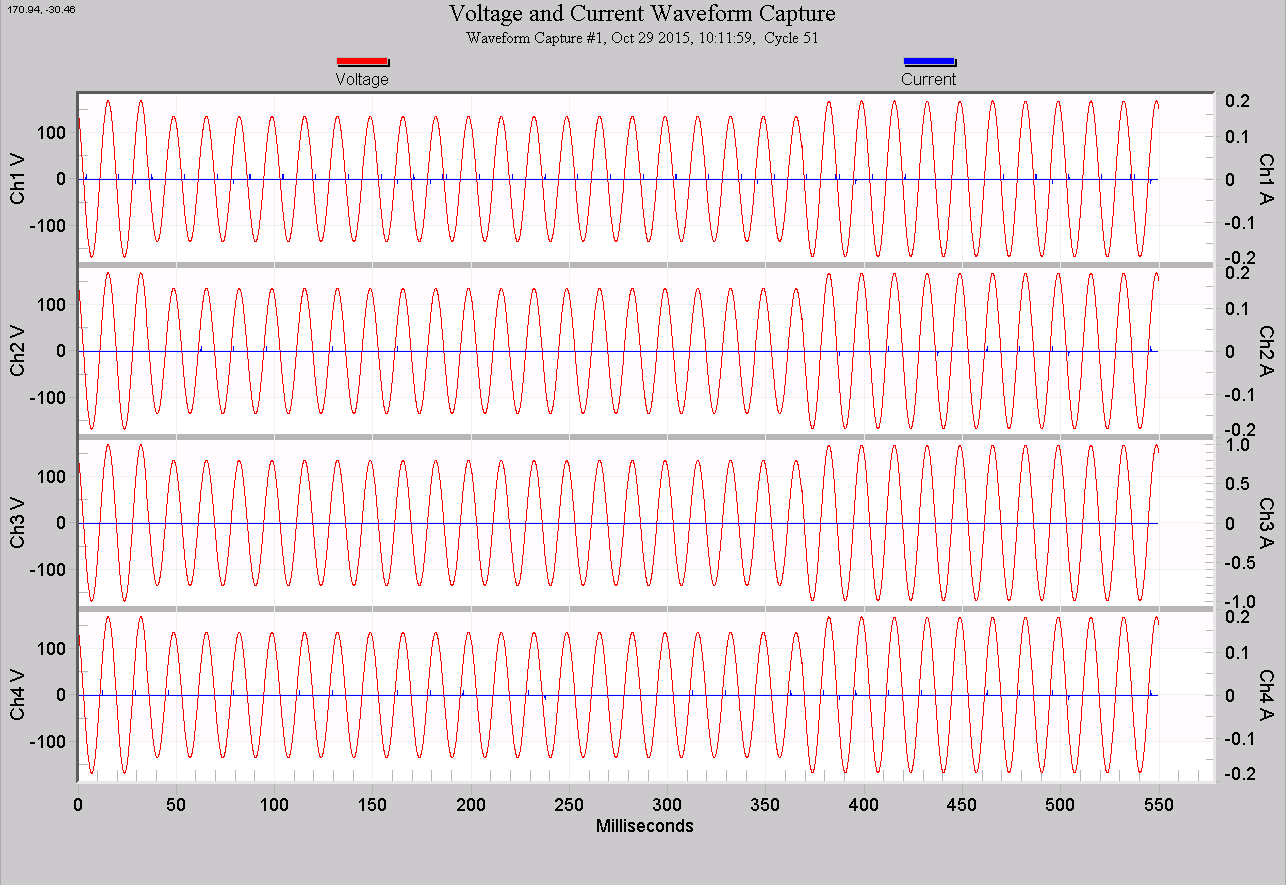
A useful tool is the RMS Capture graph. The RMS Capture graph is useful for getting voltage and duration data. It takes the waveform capture information and presents it in a different view. Figure 2 is a waveform capture showing a voltage sag. It is difficult to get scope of the voltage sag due to the scaling on the waveform graph and the way the data is presented. Figure 3 is a RMS Capture graph showing the same voltage sag. From this view it is easy to see the voltage sag and the duration – roughly 93V, and 15 cycles. Figure 1 shows how ProVision would graph that event.
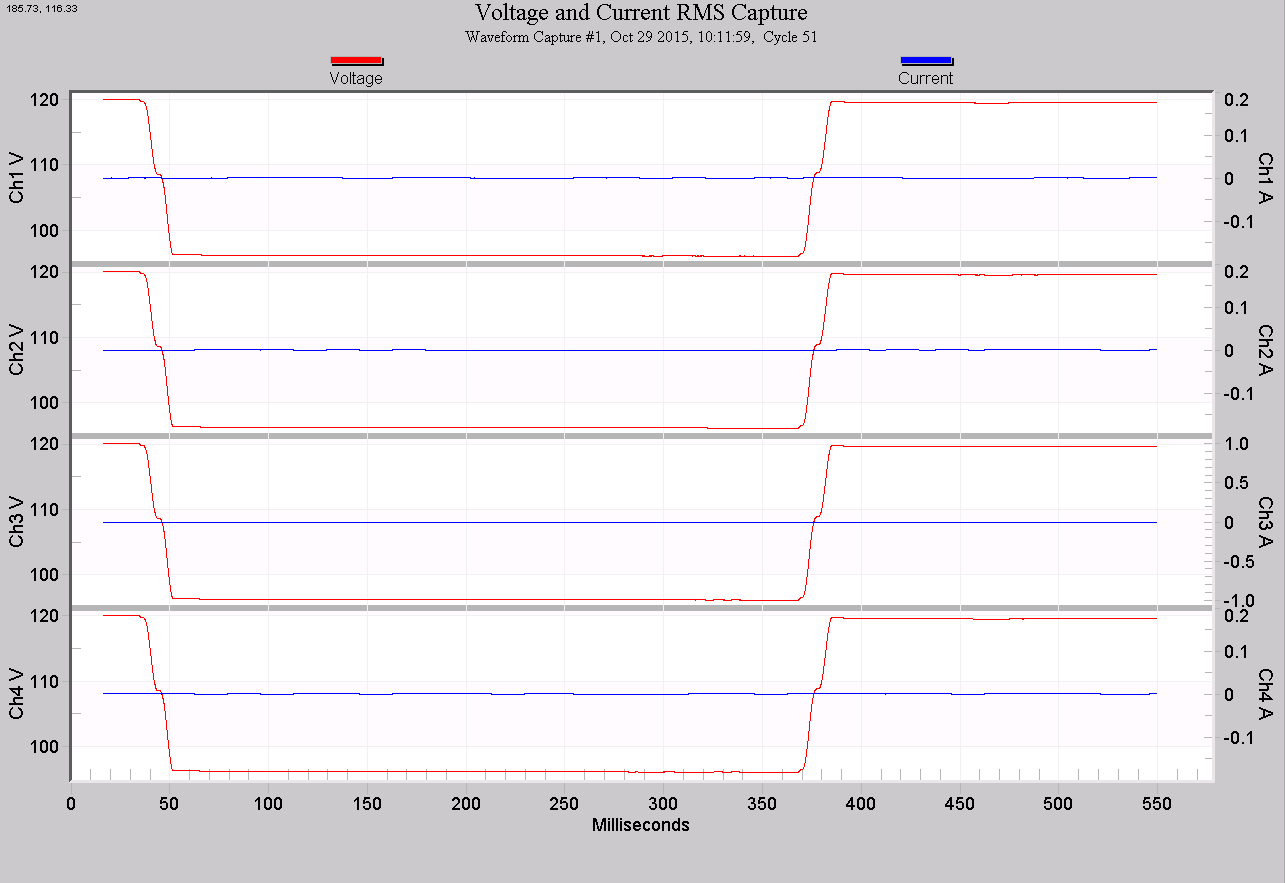
This example was a simple artificial example from a test recording. The recording was generated by connecting a Revolution to a programmable voltage source. The source was configured to supply a steady 120V RMS voltage, and was programmed to generate a 15 cycle sag down to 93V. To graph this by hand on the CBEMA curve simply find the 15 cycle column on the x-axis, and the 93/120 = 78% row on the y-axis, and mark the point where they intersect.
This simple example is great for showing a CBEMA/ITIC event but real world events could last longer than the number of cycles recorded in a waveform capture.
How do we compute duration when the sag lasts longer then our waveform capture cycle threshold? In the case of a longer duration, often the next recorded waveform capture is caused by the end of the voltage sag. Note: you can press page down to show the next waveform capture when you are in a waveform capture graph.
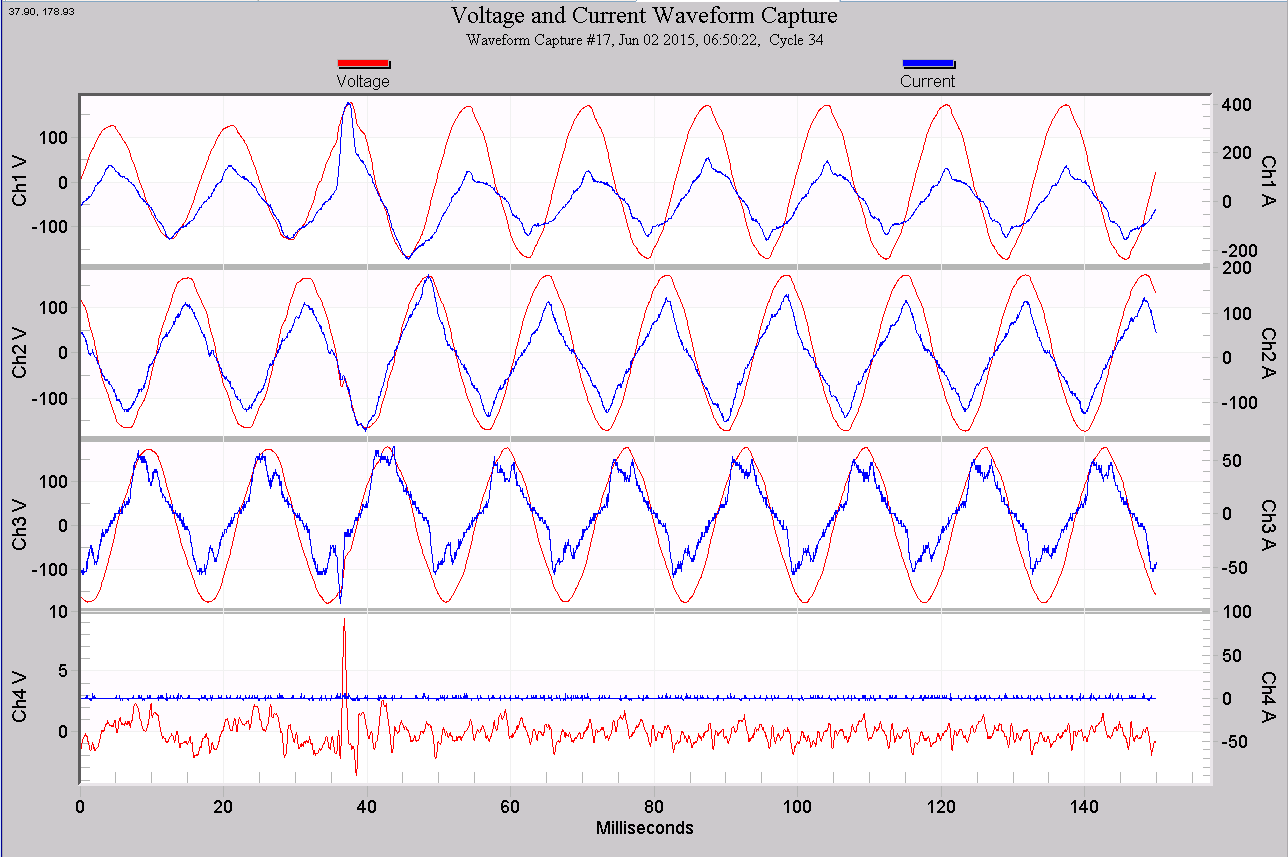
Figure 4 shows a waveform capture showing the start of a voltage sag and Figure 5 shows the end of the same voltage sag. This recording was made by a Revolution and the PMI Headquarters building located at the service entrance. In this case there were a few waveform captures in between the two shown waveforms because of variations of the voltage and current during the sag. Figure 6 and Figure 7 shows the RMS Capture graphs for the same waveforms.
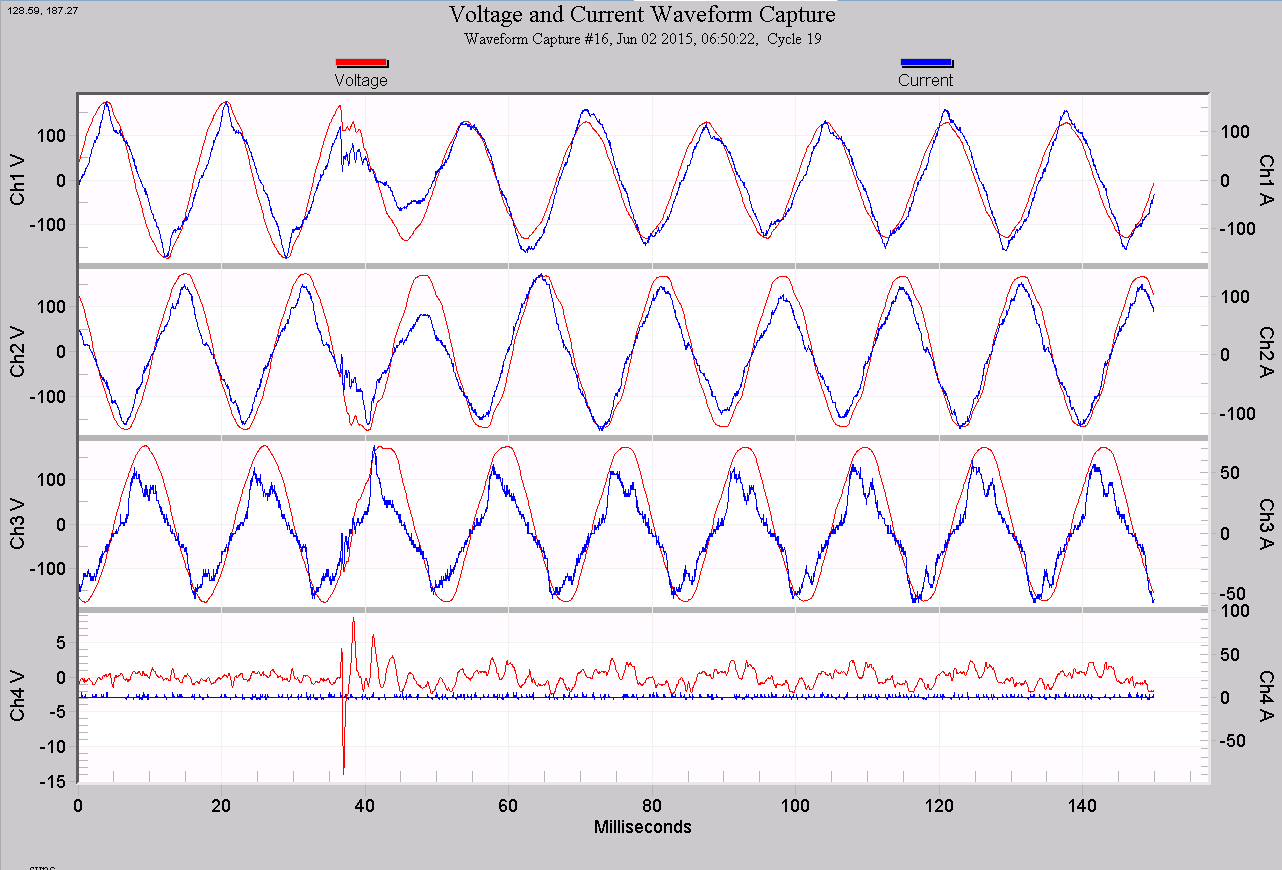
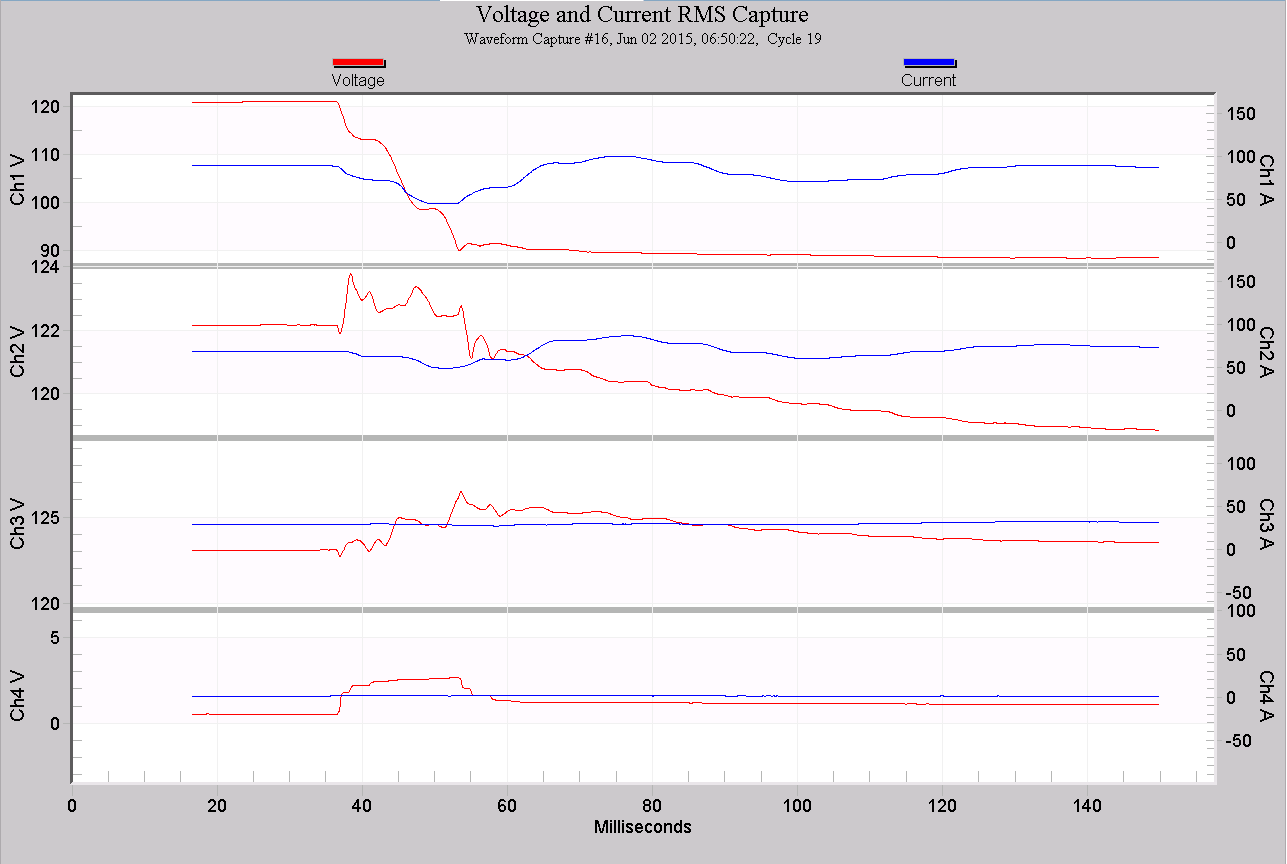
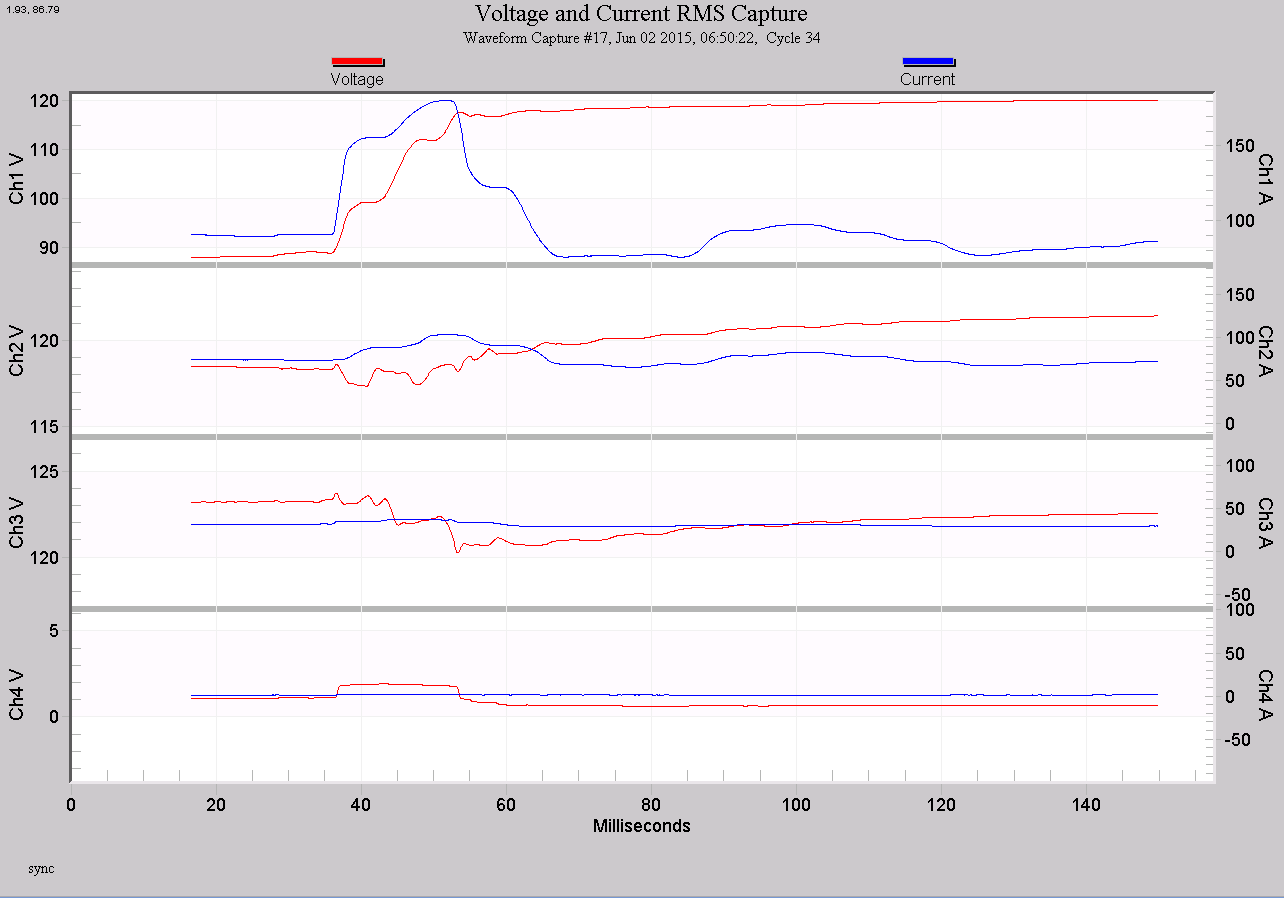
In our example, the channel 1 voltage sag started at 6:50:22 cycle 19 and ended at 6:50:22 cycle 34 for a total of 15 cycles. Fifteen cycles is 0.25 seconds. From the RMS Capture Graph I right-clicked and chose View Report. This opened the RMS Capture Waveform Report. The report showed a voltage sag to 88.5 volts on Channel 1. The voltage 88.5 is 73.7% of the nominal 120 volts. Now we have the information we need to plot the point on the CBEMA/ITIC curve.
Figure 8 shows a ITIC(CBEMA) curve with our calculated data point plotted. Notice that the point is just inside the tolerated area of the curve.
Conclusion
The CBEMA and ITIC curves are useful tool for working with sensitive computer and business equipment. Many PMI recorders and ProVision can plot CBEMA/ITIC curve events making analysis of these events easy.
When a recording does not have recorded CBEMA/ITIC curve events, the waveform capture holds all of the information needed to plot these events by hand. The RMS Capture graph and report displays this information in a convenient format. PMI’s line of power quality devices and software make powerful tools to make you power quality analysis easier.
