Abstract
Photovoltaic (PV) systems generate new power quality and even basic grid stability challenges. The rapid deployment of PV generation requires comprehensive monitoring to help understand and quantify the impacts on distribution systems that weren’t designed for this topology. This whitepaper presents recommendations for PQ recording of an active PV installation, both for addressing immediate problems and for proactive monitoring to address system planning and expansion needs.
Issues with PV Systems
PV systems may create local PQ problems as well as circuit-wide stability issues. PQ problems are generally due to the DC->AC inverter that creates a 60Hz voltage from the DC solar panels. The synthesized AC waveform may be a very coarse “sine wave” with excessive harmonics. These harmonics are caused by the discrete steps in the synthetic output, and are often higher in magnitude and frequency than traditional harmonic voltage caused by nonlinear loads with typical 3rd, 5th, 7th, etc. harmonics. A poorly phase-locked inverter can introduce voltage interharmonics as its 60Hz frequency varies and beats with the utility line frequency. Switching transients from PV system connection or disconnect may present a local transient problem. A PV system can indirectly increase switching transient events by causing distribution regulators or cap banks to operate more often. This is more likely during times of intermittent cloud cover, where rapidly changing PV output causes the system voltage to wander enough to require repeated corrections.
Fluctuating system voltage due to intermittent PV output is also a circuit-wide stability issue. The traditional daily load profile is not reliable if the net substation loading varies with minute-by-minute cloud cover, or with step changes from PV systems that are suddenly switched offline (e.g. for THD violations). If enough PV generation is present to move the system voltage, smarter regulation is needed, possibly using real-time SCADA measurement and control.
A similar issue is present for VAR control. Most PV inverters are designed to operate at unity power factor. In this mode, the inverter supplies real power for other loads on the system, but no reactive power. Power flow analysis and power factor control become much more complex with separate sources of real and reactive power. Optimal power factor capacitor control and even placement require a good understanding of the PV system and surrounding loads. PV inverters with adjustable power factor output, or even dynamic volt/VAR control can improve system efficiency and stability but require even more monitoring.
PV Stripchart Recommendations
The primary PMI data types useful for PV monitoring are the stripchart, waveform capture, and the daily profiles. The daily profiles don’t have any adjustable parameters, so their configuration is not discussed here. The stripchart is used for voltage, current, real/reactive power, and total harmonic monitoring. Waveform capture is used for waveform disturbances and for waveshape/harmonic measurement over the full harmonic spectrum and PV output.
A suggested stripchart configuration is shown in Figure 1. RMS voltage and current are the most basic data types and should always be enabled.
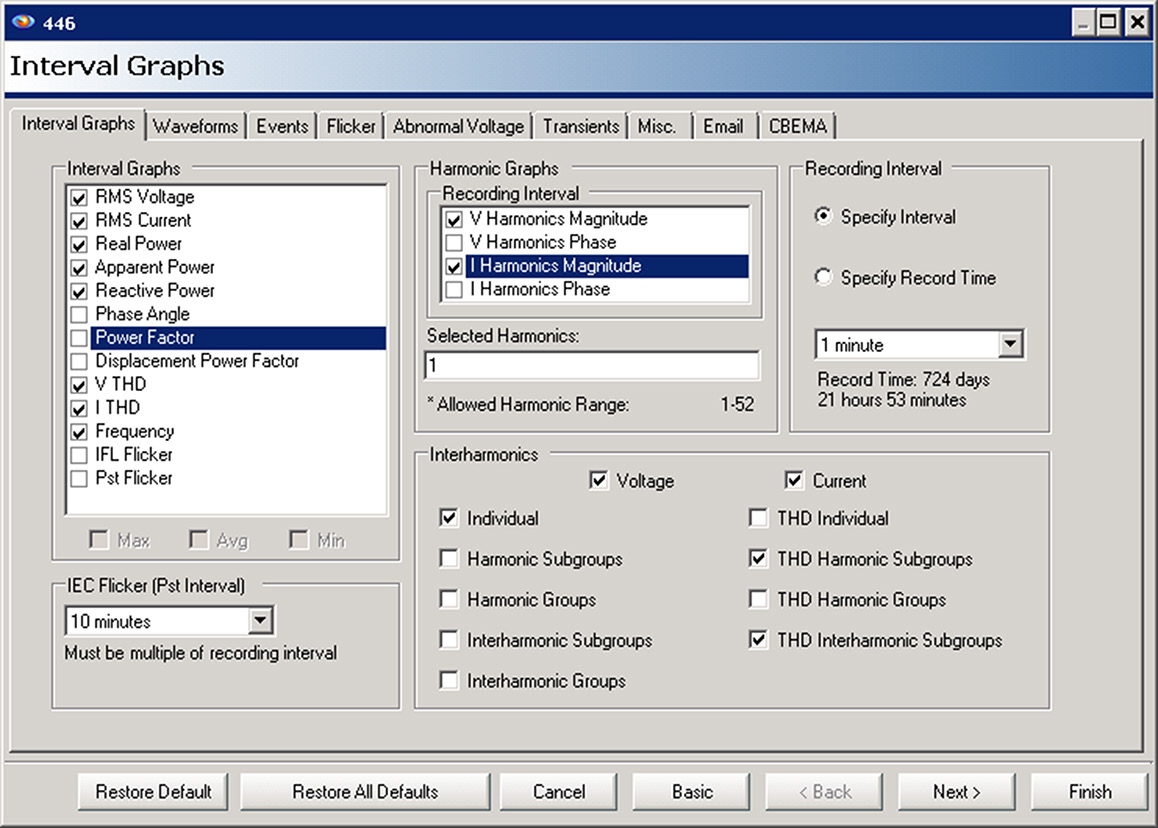
Real power is needed for measuring PV output. Apparent and especially reactive power (VARs) are important for a complete power flow analysis, especially if the inverter is a non-unity power factor type. If the location is purely a PV farm, a unity power factor inverter should have very little VAR flow, but if local loads are present, VAR measurement even with a unity PF inverter is useful. Phase angle and power factor are mostly redundant if apparent and reactive power are both measured. If the power factor information would have indicated a problem, the detailed VAR data would be needed in any case.
Voltage and current THD are basic measurements for quantity harmonic distortion. Excessive harmonic distortion could be caused by a poor PV inverter output, or actually mitigated by an inverter output that’s cleaner than the incoming system voltage. Also, by lowering the system impedance at higher frequencies, the PV output could be lowering the harmonic effect of other nonlinear loads on the transformer secondary. Detailed THD trend data is required to see any of these effects.
Frequency is recommended for situations where the inverter output may affect the power line frequency, due to a poor phase lock, or very large PV output that dominates the entire local system. The frequency data may be compared to data from other locations, or correlated with PV power output. Also, if the inverter is isolated from the main grid, its frequency output has no system reference and should be measured.
If a Revolution is available, basic interharmonic recording may be helpful. The key interharmonics are those around 60Hz, to help identify beat frequency effects or other line frequency variations that would show up as modulation of the 60Hz component. Enabling the 1st harmonic for recording (by entering a 1 in “Selected Harmonics” and also checking “Individual” in the Interharmonics section) enables the 5Hz interharmonics surrounding the fundamental. Figure 1 shows these enabled for voltage and current. In addition, harmonic and interharmonic subgroup THDs are enabled (“THD Harmonic Subgroup” and “THD Interharmonic Subgroup” checkboxes). These are the total distortion values for all harmonics together, and all interharmonics together, respectively. These two measures can distinguish harmonic from interharmonic distortion and identify which may be a problem. All harmonics and interharmonics are included in their calculation even if only the fundamental is enabled for stripchart logging.
The stripchart interval shown is 1 minute. Because PV output can change on a minute level time scale (due to changing cloud cover, for example) a longer interval is not recommended. For maximum time resolution, it’s best to use an interval smaller than the fastest time scale involved, and thus 1 minute is a recommended longest value. An interval like 15 minutes, traditionally used for power logging, is too coarse for PV output swings.
In Figure 2, stripchart data from a PV installation reveals the pattern of power generation and voltage regulation. This 3-phase 1MW system, with the three voltage phases, are graphed on the top plot and total real power on the bottom plot. The system voltage rises with PV output until finally a regulator steps in to lower the voltage. The voltage is actually high even before the PV output begins – a good candidate for overall voltage reduction.
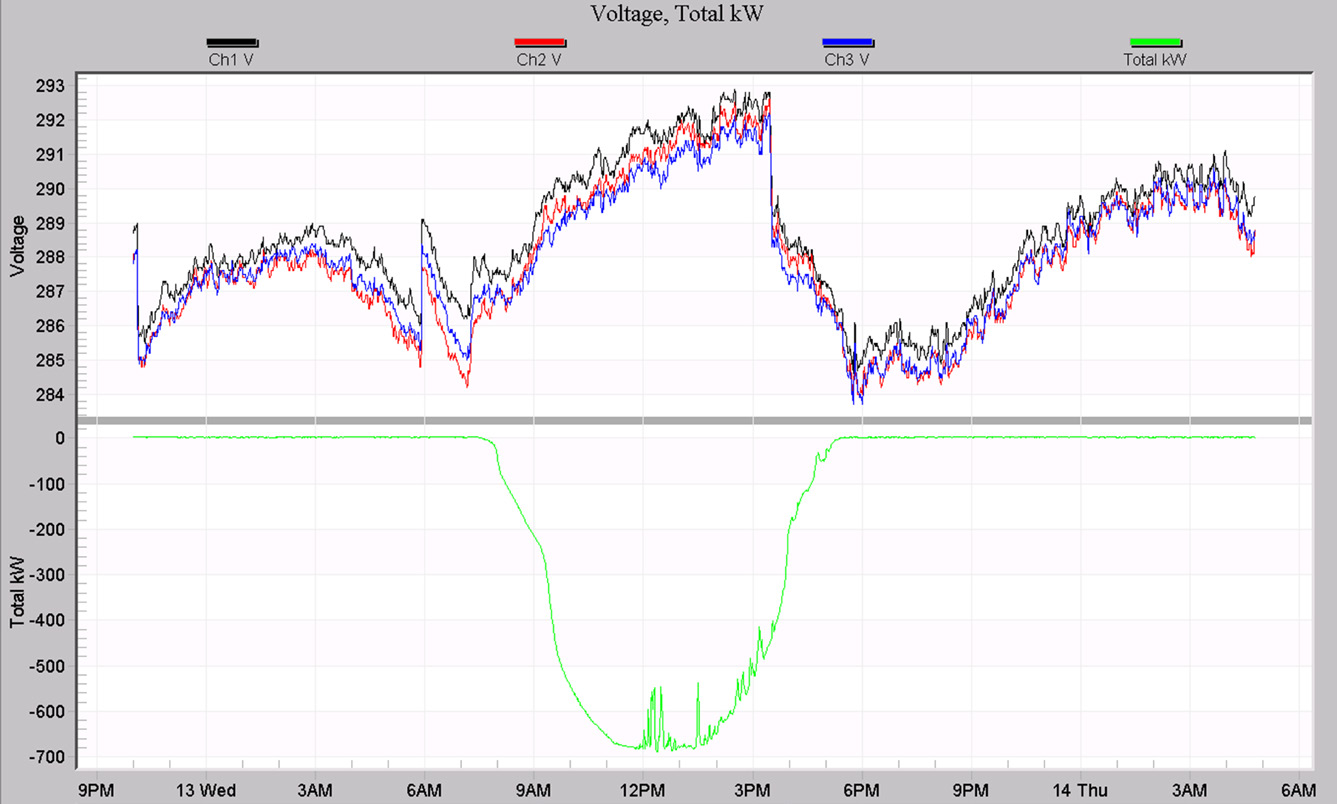
Figure 3 is a plot of RMS voltage and voltage THD. RMS voltage is shown for each phase in a separate plot as black, red, and blue, with THD graphed in gray, light red, and light blue. The RMS voltage and THD are highly correlated, and a closer look shows that the THD is actually lower during daylight hours when the PV output is present. The PV sine wave is actually improving the THD here, although the change is not dramatic.
PV Waveform Capture Recommendations
Waveform capture is the second data type discussed here. A suggested waveform capture setup is shown in Figure 4. Six pre-cycle and 24 post-cycles are used to get a good waveform profile during PV disconnects. The voltage triggers are loosened a bit from the default, but THD is tightened. The THD trigger (only available on the Revolution) catches waveshape changes – typically from capacitor bank changes, which may be in response to PV output changes for volt/VAR response. The current threshold at 10% (of full scale) is set to trigger on PV connection or automatic disconnect – that will produce an abrupt step change in current. Finally, the periodic capture will ensure that typical baseline waveforms are recorded throughout the day. These waveforms are used to evaluate harmonic content as a function of total PV output (many inverters have worse THD performance with lower output). The capture period should be set so an entire day is recorded. In case of a long recording session, the number of samples per cycle may be reduced from the default 256, the period increased, or wrap-around used to analyze the most recent day. For pure wave shape monitoring with no expected transients a minimum 3 cycle capture length is suggested, to maximize the number of waveforms (reduce the periodic capture time to get more waveforms per day). In a single phase recording, only one voltage and current channel may be needed. With a cell Revolution, waveform memory limitations are removed – automatically scheduled downloads let the PC memory replace recorder memory.
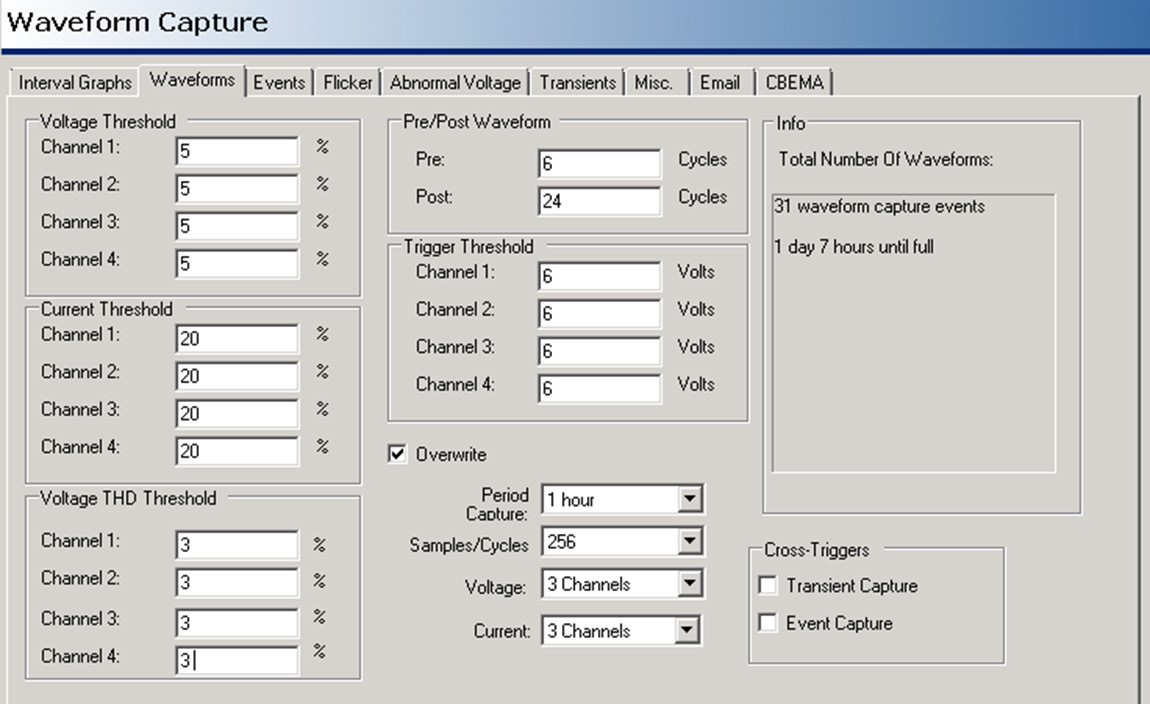
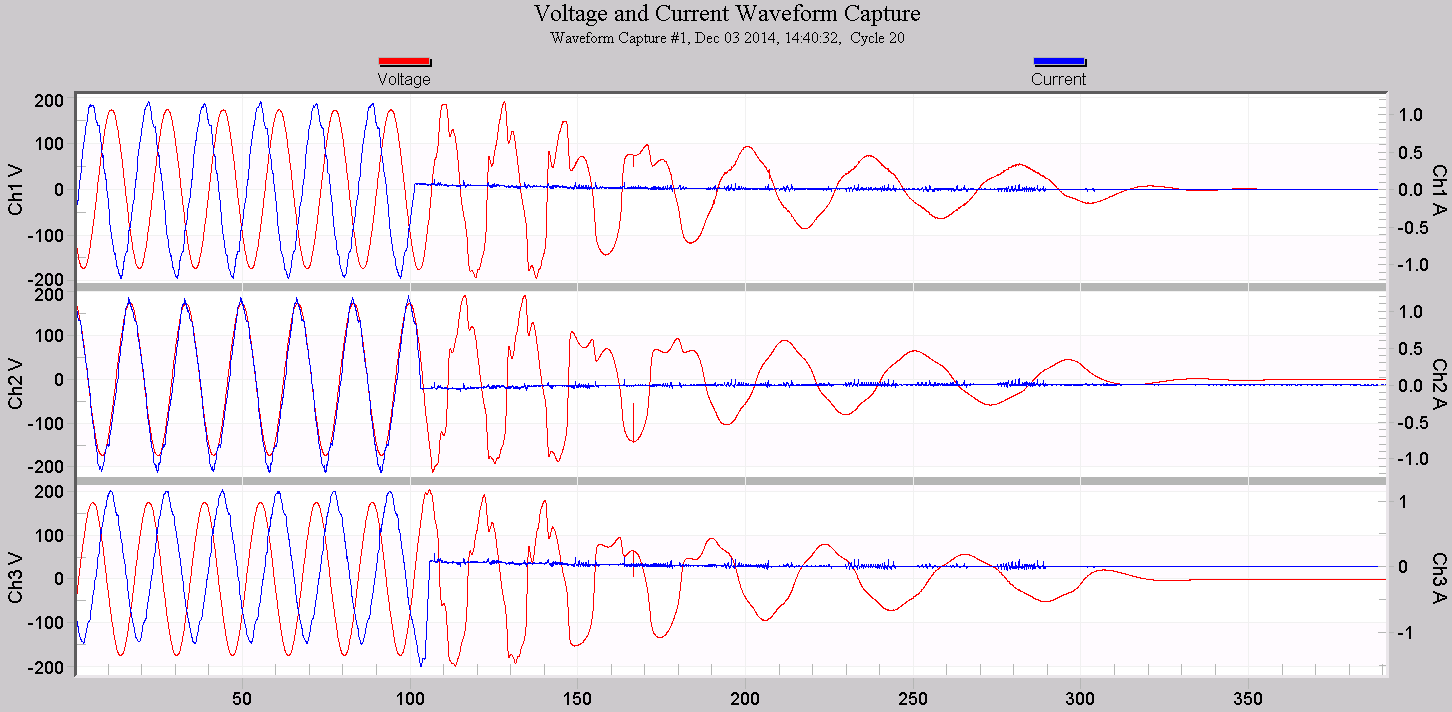
Figure 5 shows a breaker operation disconnecting a non-energized 20MW PV array. Here a long waveform is needed to completely capture the voltage decay.
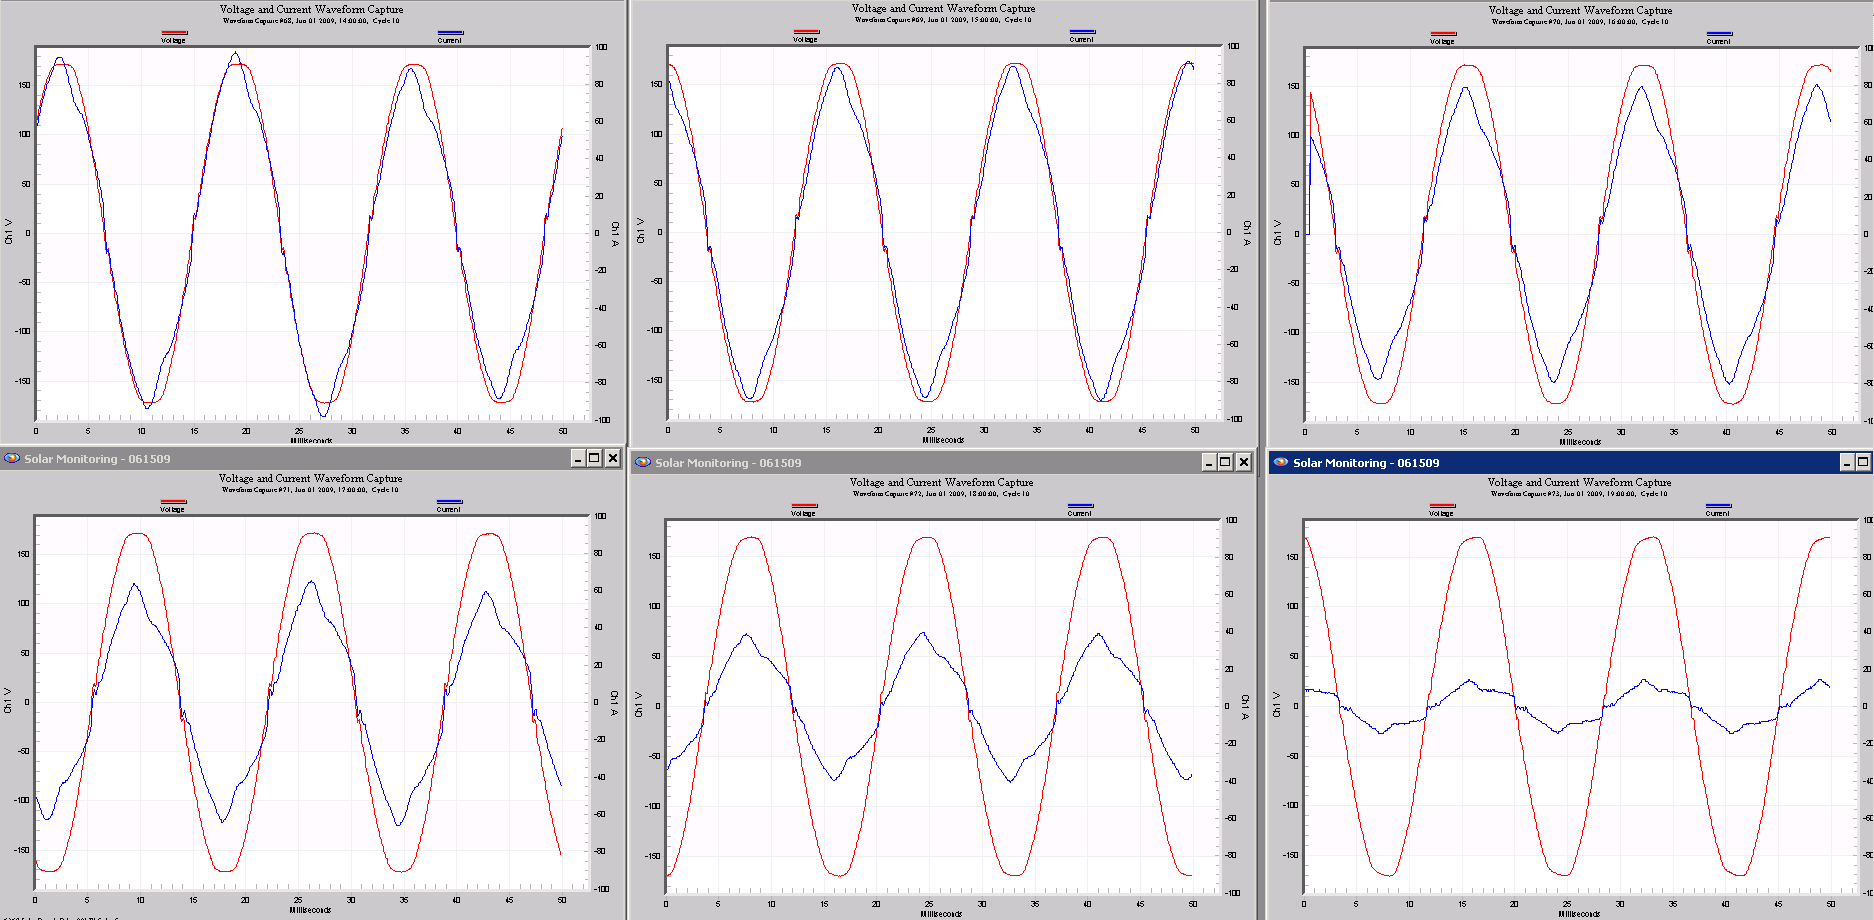
In Figure 6, periodic waveforms from a PV array are shown as the PV output progressively falls from peak daylight through the evening. The periodic trigger time was set to 1 hour, and these captures are the minimum 3 cycle length, spaced one hour apart. The peak PV output is in the top left graph, and the output falls from left to right on the first row, then left to right on the second row (bottom right graph is the lowest output). The red trace is voltage, and the blue trace is one leg of the single-phase point of common coupling. The inverter output wave shape deteriorates as the output level falls. The graphs are all set to the same scale so the current may be compared directly.
Conclusion
PV generation presents many new challenges for utilities, both for steady-state regulation and power quality. Due to the variety of issues that may be involved, several types of data are needed for a complete PV survey. Suggestions for PQ monitor setup and recording are given here to help ensure that all necessary data is captured and to provide consistency among many PV recordings.
