Abstract
A per-unit scaling system simplifies many AC power analysis tasks. Eliminating transformer ratios, normalizing power values to equipment ratings, and allowing for like-to-like comparisons of differing nominals are just three advantages of viewing data as per-unit values. A brief overview of the per-unit system, along with its use in ProVision is described here.
Per-Unit Overview
In a per-unit system, quantities such as RMS voltage, RMS current, and real power are scaled so that they’re a fraction of a base unit quantity. The base quantity is chosen such that the nominal or “normal” per-unit value ends up as 1.00 after the scaling. For RMS voltage, the scaling formula is
Vpu = Vrms / Vbase
Where Vrms is an actual measured RMS voltage reading, Vbase is the base quantity, and Vpu is the resulting per-unit value. Because both the base and measured quantities have units of voltage, the resulting per-unit value is dimensionless. By convention the dimensionless unit is referred to as per-unit, or pu.
For example, consider a single-phase 240V residential service fed from a 25 kVA transformer. The natural base unit for voltage is the nominal, 240 V:
Vbase = 240 V
If the measured voltage is 235.6 V, the per-unit value is
Vpu = 235.6 / 240 = 0.982 pu
Similarly, for an apparent power measurement of 8.25 kVA, the per-unit value is
Spu = 8.25 / 25 = 0.330 pu
The per-unit scaling for current is usually defined by the voltage and power scaling:
Ibase = Sbase / Vbase
and in this case results in
Ibase = 25000 / 240 = 104.2 A
Continuing the example, if the measured current is 45.2 A, then the per-unit current and VA values become
Ipu = 45.2 / 104.2 = 0.434 pu
and
Spu = Vpu × Ipu = 0.982 × 0.434 = 0.426 pu
Note that the current and power per-unit values are nearly the same. If the actual line voltage is at the nominal (i.e. Vpu = 1.00), they will be identical. In most cases, voltage and power are analyzed in the per-unit system.
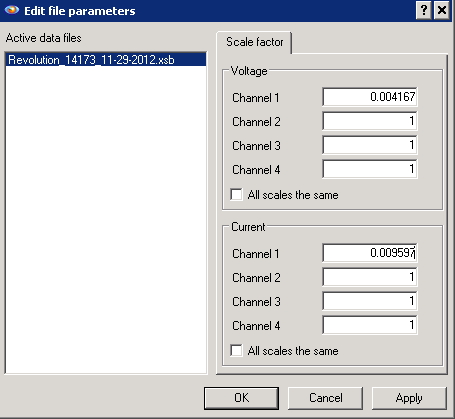
To view per-unit values in ProVision, use the ProVision scale factor feature. These scale factors are multiplicative factors applied to voltage, current, and power measurements, originally intended for PT and CT scaling. In that application the scale factors would generally be whole number multipliers (e.g. 40 for a 200:5 CT). Here the scale factors will be adjusted such that the resulting voltage, current, and power readings are in per-unit values.
For voltage, simply use
Scale Factorvoltage = 1 / Vbase
In our example,
Scale Factorvoltage = 1 / 240 = 0.004167
There is no power scale factor in ProVision. Instead, the voltage and current scale factors are multiplied together, and this product is used for real, reactive, and apparent power scaling. Consequently, the current per-unit scale must be determined in order to use per-unit power values. The calculation for current is analogous as that for voltage, and for our example,
Scale Factorcurrent = 1 / Ibase = 1 / 104.2 = 0.009600
To enter these in ProVision, go to Tools, Scale Factor. This launches the Scale Factor dialog box, as seen in Figure 1. The voltage and current values from above have been entered in the figure. Since this is a single-phase 240V recording, only one channel is needed; the rest are left at the default value of 1. These values are stored with the data file. If PTs or CTs were used in the recording, their ratios may be combined into the per-unit scale values – simply multiply the PT or CT ratio by the original per-unit scaling, and enter that into ProVision.
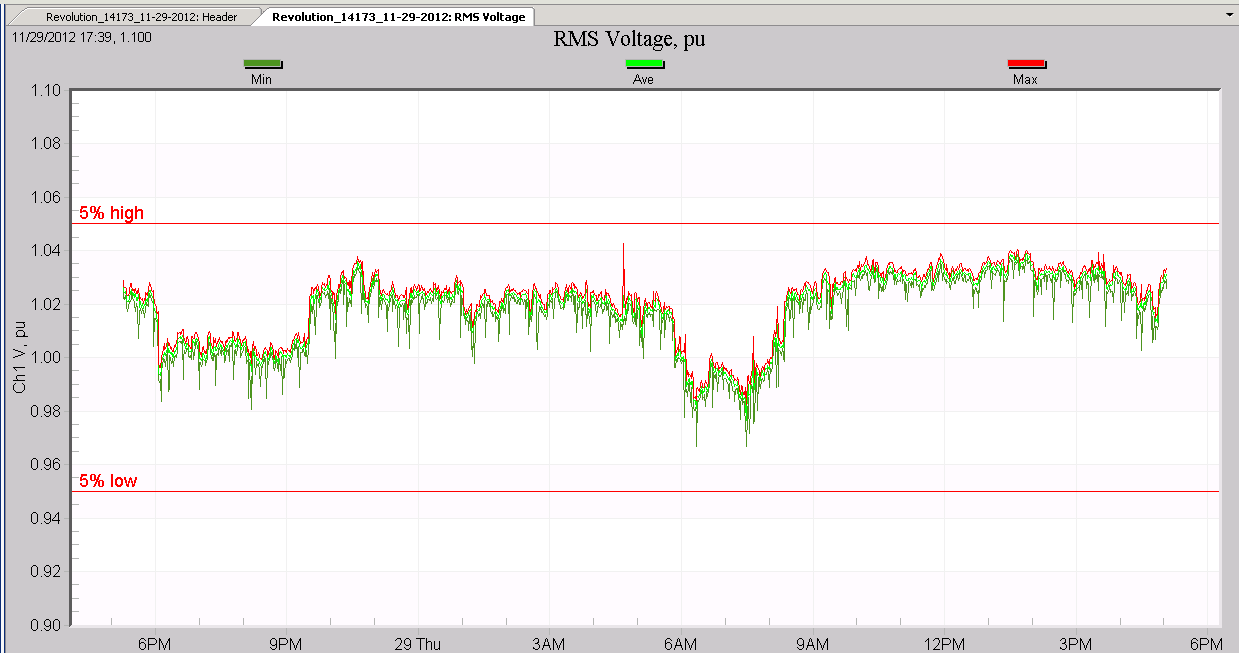
A sample graph with these values is shown in Figure 2. Here the RMS voltage is shown in per-unit. The three voltage traces – min, average, and max, are scaled such that 1.00 corresponds to 240 V. ProVision horizontal line annotations show the ANSI C84 limits of 5% high and 5% low. The voltage shown here is well within those limits.
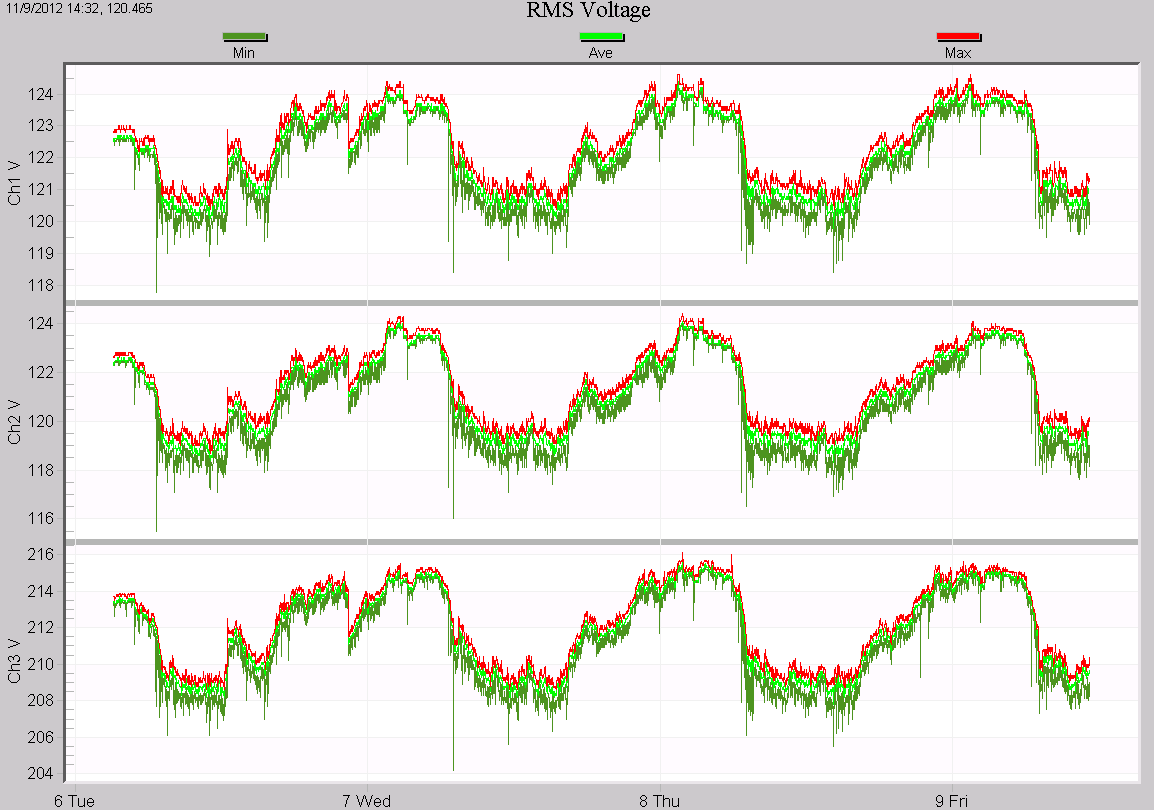
The next example is a more complex system. A 3-phase hot-leg delta service was recorded, with nominal voltages of 120V, 120V, and 208V, fed from a 75 kVA service. The basic voltage plot is shown in Figure 3. Phase C is the “hot” leg, running at 208V nominal. Due to the different scaling for channel 3, it’s difficult to compare voltage levels, and combining the traces on a single plot is even less useful. Per-unit scaling to normalize the voltages fixes this situation.
Per-Unit Scaling
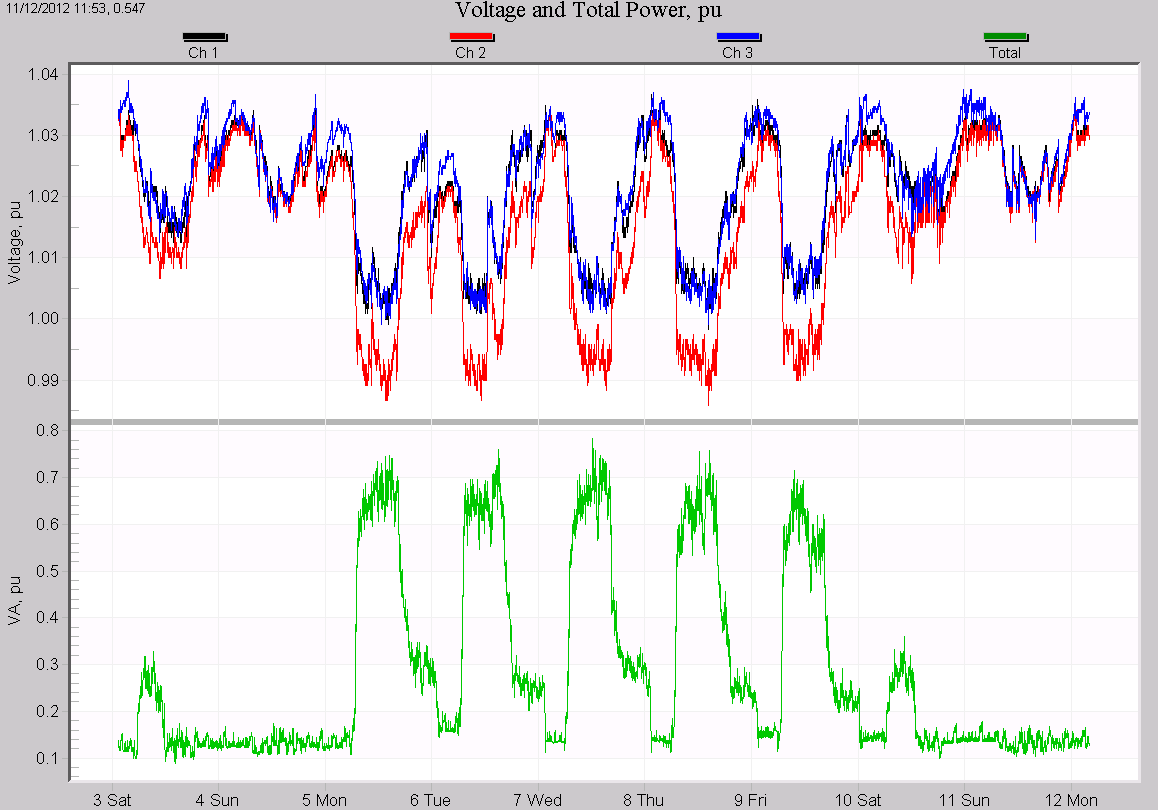
The per-unit scaling for the three voltage channels are 1/120, 1/120, and 1/208. The scale factor for current that results in the correct power per-unit values is 120/75, or 1.6 (75 is used instead of 75000 since ProVision displays power measurements in kW, kVA, and kVAR). The resulting graph is shown in Figure 4. The average voltages for all three phases are in the top plot (black, red, blue for phase A, B, C), and the 3 phase total apparent power (kVA) is graphed in the bottom plot (green). It’s easy to see from the voltage y-axis that all traces are within +/- 5% (i.e. 0.95 to 1.05 pu), and the total power peaks at around 0.7 pu (e.g. 70% loaded, assuming no harmonic derating) during the weekdays. The voltage is sagging around 3% during the day (1.03 to around 1.00 pu), and the relationship to the power consumed is also very clear. Any additional load on this transformer could push past its 1.00 limit, and also cause voltage sag below 3%.
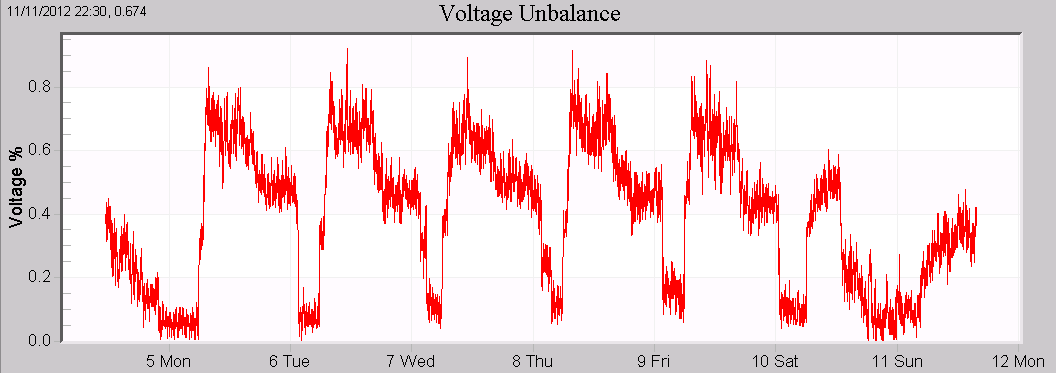
The like-to-like voltage scaling reveals that phase B (red) is sagging lower than the other two phases during the day, but not at night, an indication that the load here is not well balanced. Normalizing the voltage channels is required for a correct voltage unbalance graph in ProVision when the phase nominals differ. Now that they are in per-unit this graph may be generated. This graph is shown in Figure 5 – the unbalance rises to almost 0.8% during weekdays – within acceptable limits for most situations.
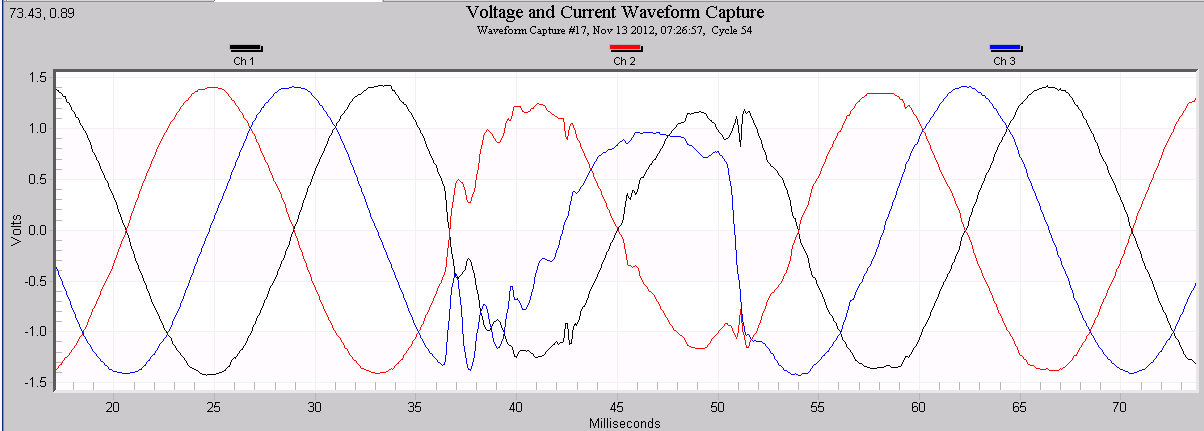
Per unit scaling is also useful for other graphs. A captured waveform is graphed in Figure 6, with 3-phase voltage display. Per-unit scaling is based on RMS values, so the peak of the sine waveforms will rise to 1.41 with a pu value of 1.00. A small fault near the negative peak of phase C produced a sag, until the fault cleared in the next cycle. Phase C, the “hot” leg, is most severely affected. Without per-unit scaling, the relative magnitude of the fault on a per-phase basis is difficult to gauge. Harmonic graphs are also more useful in per-unit scaling when the voltages are at different nominals.
Conclusion
Per-unit analysis for voltage, current, and power quantities is easy with ProVision with the scale factor feature. Per-unit scaling is useful in situations such as a hot-leg delta, where one phase is higher than the others, or when comparing data from two locations with different line voltages. In addition, per-unit readings make it easier to compare levels with percent nominal limits (e.g. the +/-5% ANSI C84 voltage range).
