Abstract
This White Paper describes a basic overview of the functions of PMI’s interval graph recorders.
Interval Graph Recorder
PMI manufactures power recording devices that come in many shapes, sizes and functions to satisfy the various needs of utility customers. Most of the different hardware models PMI offers will support two recording techniques, event driven and non-event driven.
Event Driven
In the case of the event driven recordings, a recorder’s software is configured to perform a recording when certain pre-established parameters are met. Sometimes there is no reason to collect and record data that is normal; it is the abnormal data that usually requires the attention. This can greatly reduce file size because only information of importance is recorded. However, this has to be done carefully, if thresholds are set too high it is possible to miss an event of importance and record nothing! If thresholds are set too low, the opposite can occur. The recorder may try to capture every cycle and it is possible fill up or overwrite internal memory or even worse, miss an event due to a full memory situation. The goal of the of proper configuration is to have the correct threshold balance to record what is needed without going to extremes.
Non-Event Driven
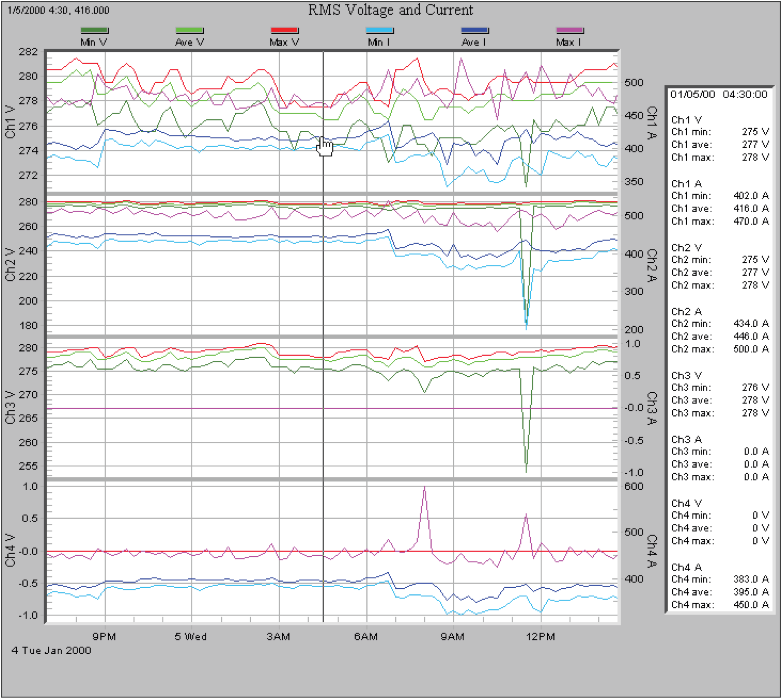
The other type of recording, a non-event driven recording, also referred to as interval graph mode, works very similarly to the traditional strip chart recorder. The first generation strip chart recorders record data on paper. The paper is passed under a pen and the pen is deflected in proportion to the input signal or voltage. The result is a graph or chart of the data. This process typically recorded the average voltage or current if used in a power system. PMI’s recorders do the same basic job as the traditional strip chart recorders and much more. Their advantage is that they record everything and there are no thresholds to set. There are settings dealing with how often to collect data. If sensitivity of these settings is sufficient, they will record abnormalities along with a lot of normal data. This can also be a disadvantage due to the likelihood of collecting a large amount data, however since the data is displayed in a graphic format, it is easy to pick out important data when it differs from normal data. Figure 1 shows a typical display of a recording in the Internal Graph Mode, or Strip Chart Display Mode.
With the PMI recorder in interval graph mode, the recorder records and displays the stripchart-type information except on a computer display where custom prints and reports can be made when necessary. It can also display the maximum values and minimum values along with the average values. These graphs give the worst case values for the Interval, with the resolution of a single cycle. Instead of just displaying the information to a strip chart the PMI recorders store the data to memory.
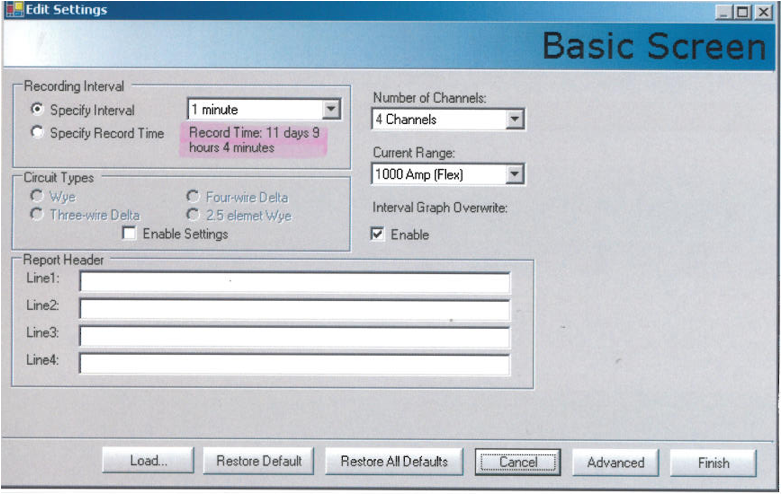
The Recorder has enough memory to record in interval graph mode for at least a week if used in the one minute interval mode. Different PMI recorders models have different memory storage capacities. If more data is required, choose a model that has memory capacity for your particular application. If you are not sure of your future memory needs, it is better to choose a model with higher memory capacity when possible to allow for future memory expansion. During the initialization process, ProVision will give you the estimated record time depending for a particular configuration. This is a great tool for determining the correct configuration settings to help you figure how much memory a job requires. Also, as shown in Figure 2, there is an option allowing the operator to specify the record time. Specifying the recording time allows the recorder to pick the best recording interval timing to meet already established report requirements.
There are two ways to configure memory storage, depending on whether wrap around option is turned on or is turned off. If the wrap around option is off, the recorder will stop after the memory has been filled with data. If the wrap around is turn on, then the old data will be continuously overwritten with newer data in the order it was recorded in.
All PMI recorders can record voltage. Advanced recorder models can record both voltage and current. The highest end models will record voltage, current, real power, reactive power, apparent power, power factor, phase angle, THD, and harmonics up to 51st.
There are only three settings for the non event driven recording. They are the Strip chart Interval setting, the Strip chart Wrap-Around setting, and the Strip chart enabled settings.
The Strip chart Interval setting is simply the interval time setting which determines how often the recorder will record data. The best interval time setting is determined by the time resolution and recording length required. As the time interval is decreased, more data is recorded which equates in more memory used for a given amount of time. The smallest interval is one second. A one second time interval gives excellent resolution, however this setting will use memory up 60 times faster than if the interval is set for 1 minute. The one minute setting is one of the most common settings used for time interval because it is a good compromise between frequency data collection and long recording time.
The Wrap-Around setting affects the recorder’s memory storage mode. If information that happens at the very beginning of the scan is required, leave the Wrap-Around setting unchecked. This allows the recorder to stop recording when the memory becomes full, keeping it from over-writing data that has already been recorded. If the most current data recorded is required without the worry of running out of memory, use the Wrap-Around setting.
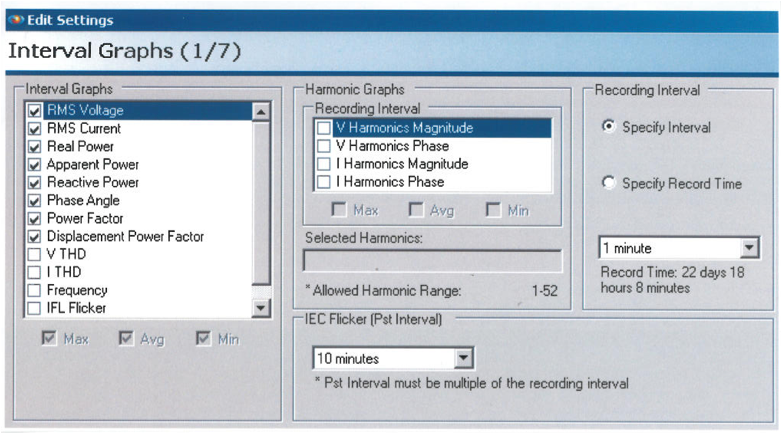
The third setting enables different recorded data options as shown in Figure 3, below. If the recorder is a voltage only unit, there are no choices to set; a voltage-type strip chart is always recorded. The options available are as follows: RMS Voltage, RMS Current, Voltage Total Harmonic Distortion (THD), Current Total Harmonic Distortion, Real Power, Apparent Power, Reactive Power, Phase Angle, Power Factor, Displacement Power Factor, Total Power, Frequency, and Instantaneous Flicker (IFL), Perceptibility (PST), Long Term Flicker (PLT). The more recordings that are activated, the more memory is required for a given amount of time. As with other settings, optimizing the memory resources is left up to the individual user and the specific job objectives.
Conclusion
This White paper is a general overview of the basic functions of an Internal Graph Recorder.
PMI recorders can be configured to be event driven or non-event driven. The focus of this paper is on the non-event driven functions, the Internal Graph Recorder modes.
If the recorder is set to non-event mode, the unit’s memory can be configured to stop when it fills up, or configured to keep recording over-write old data.
If the recorder is used in the non-wrap around mode, a time interval or recording time can be specified.
If the time interval is specified, then the recorder will estimate the recording time length for the pre-established reports.
Understanding how to configure your recorder and knowing up front what data is required for a study before initializing a recorder is a plus in collecting useful data.
The total length of the recording time is directly proportional to the amount of memory the recorder has and inversely proportional to the number of channels or data fields recorded.
Provision’s configuration supports great flexibility in allowing the customer to get the most out of their recorder.
