Abstract
The IEEE 1250 standard was developed in response to the introduction of modern electronics onto an older electrical grid. These newer electronics were not necessarily built to withstand the traditional fluctuations in voltage from a traditional grid.
The standard is broken into a few different sections covering generic terms, recommended methods of taking measurements, recommended statistical analysis and a final section wherein the role of the electric utility come into play with regard to these measurements, standards, and recommendations.
This whitepaper focuses on the first two sections of the IEEE 1250 standard: general definitions and voltage regulation recommendations for measuring and setting acceptable thresholds.
Scope of Specification
The document provides insight into voltage quality regulation by comparing standards provided through benchmarks; looking at factors that affect voltage quality and how to mitigate these factors. The depth of the document is limited to the availability of in-depth documentation in other IEEE specifications – if the subject is documented elsewhere it will not be touched in depth in this document.
Introduction and General Principles
The specification begins with a general overview of power systems. It breaks the components into a set of three generic categories (generation, transmission, and distribution) and then briefly describes the components of each of those three segments and how they come to a head at a substation.
Voltage Quality Defined
The document quickly segues into the “meat and potatoes” of the standard. It identifies two fundamental aspects of voltage quality: steady-state voltage and disturbances. Briefly, steady-state voltage is defined as the “normal” voltage supplied to a facility. Disturbances are defined as variations in the supplied voltage that occur at random – essentially “abnormal” voltage for a brief amount of time. Steady state voltage is typically adjusted with voltage regulators at a substation or at a midpoint of feeder. Power factor correction capacitors (PFCs) can also be used for voltage regulation in certain cases, at the expense of worse power factor. Disturbances are short-lived voltage changes caused by equipment malfunction, transients from switching operations, momentary faults, and customer load operation.
There are several different aspects to the quality of voltage that can (and should) be measured, including the nominal voltage and any variance from this nominal; phase imbalance (expressed as a percentage of variance from the mean of the three measured phases); frequency; voltage magnitude and phase angle (and the relation of these latter two in a multi-phase system).
Identifying Requirements
The IEEE 1250 standard lays out a series of requirements and standards through references to other recommendations, standards, and regulations. One such example is IEC 61000-2-2:2002 which outlines the compatibility requirements for varying electrical loads.
What the standard lays out in this regard is that a statistical analysis is sufficient for setting up a baseline for what steady-state voltage levels should be. That is to say, identify a “compatibility level” at which voltage must be maintained to prevent equipment malfunctions. The standard uses an example of setting a 95% threshold – i.e. “voltage will be within +/- N volts 95% of the time.” Anything outside of that threshold indicates a problem in the voltage system which would need to be adjusted or remedied to obtain that minimum quality level. Typically these steady-state RMS voltage values are measured with a 1 minute, 5 minute, or even 15 minute average. This averaging removes the effects of short-duration disturbances, which are measured separately.
Disturbance Levels
The standard defines a series of “disturbance levels” which can assist the power quality analyst in setting thresholds for different monitoring tools (such as alert levels and thresholds that, when crossed, will trigger some sort of notification to the end user that an issue has occurred which needs attention). The five levels defined in the standard are: equipment damage level, equipment immunity level, alarm level, planning level and assessed level. A brief overview of these levels follows.
The equipment damage level is defined as the voltage level at which physical damage may be caused to the equipment. Some power quality measurements to identify would be high harmonic content and harmonic resonance and neutral currents.
The equipment immunity level is defined as the level at which equipment functionality is not hindered. If, on the other hand, this level were to be exceeded, equipment malfunction is a possibility.
The alarm level is essentially the ‘notification level’. If this threshold is met (or exceeded) a monitoring system would typically issue an “alarm” or some other notification to an end user that intervention or corrective action may be necessary.
The planning level is identified as the electric utility’s “design objective.” Examples provided by the standard include setting a baseline harmonic distortion (THD) level, such as 5%.
Finally, the assessed level is defined as the measured level – the actual voltage quality as measured at any point in time within the system.
When determining these different levels, the typical loads of all customers should be taken into consideration. The standard notes that striving for “perfect power quality” would provide little to no benefit for the end user – as long as equipment functionality is not hindered, the power quality level attained is sufficient. This is a key point – the ultimate goal is compatibility between customer load requirements and the delivered voltage.
Recommended Voltage Regulation / Limits / Studies
At this point in the standard document, a series of voltage quality regulation limits and recommendations (and the studies from which they were derived) are discussed. This paper is not going to go into detail describing each, but a few select recommendations will be discussed.
Voltage Imbalance
Imbalance is essentially a measure of the variance between the phases in a 3-phase voltage circuit. A high imbalance can lead to unbalance currents in certain electrical equipment and increased harmonic current. Motors, including Variable Frequency Drives (VFDs), are especially sensitive to voltage imbalance. A large voltage imbalance will cause circulating currents to flow, with the result that motor heating increases as the square of the imbalance increase. Many modern loads, including VFDs, convert incoming AC to DC with a rectifier circuit. A voltage imbalance feeding into a 3-phase rectifier will result in increased heating for one section of the bridge and triplen harmonics (odd multiples of the 3rd).
The IEEE 1250 standard references ANSI C84.1-2006 in setting a maximum imbalance of 3%.
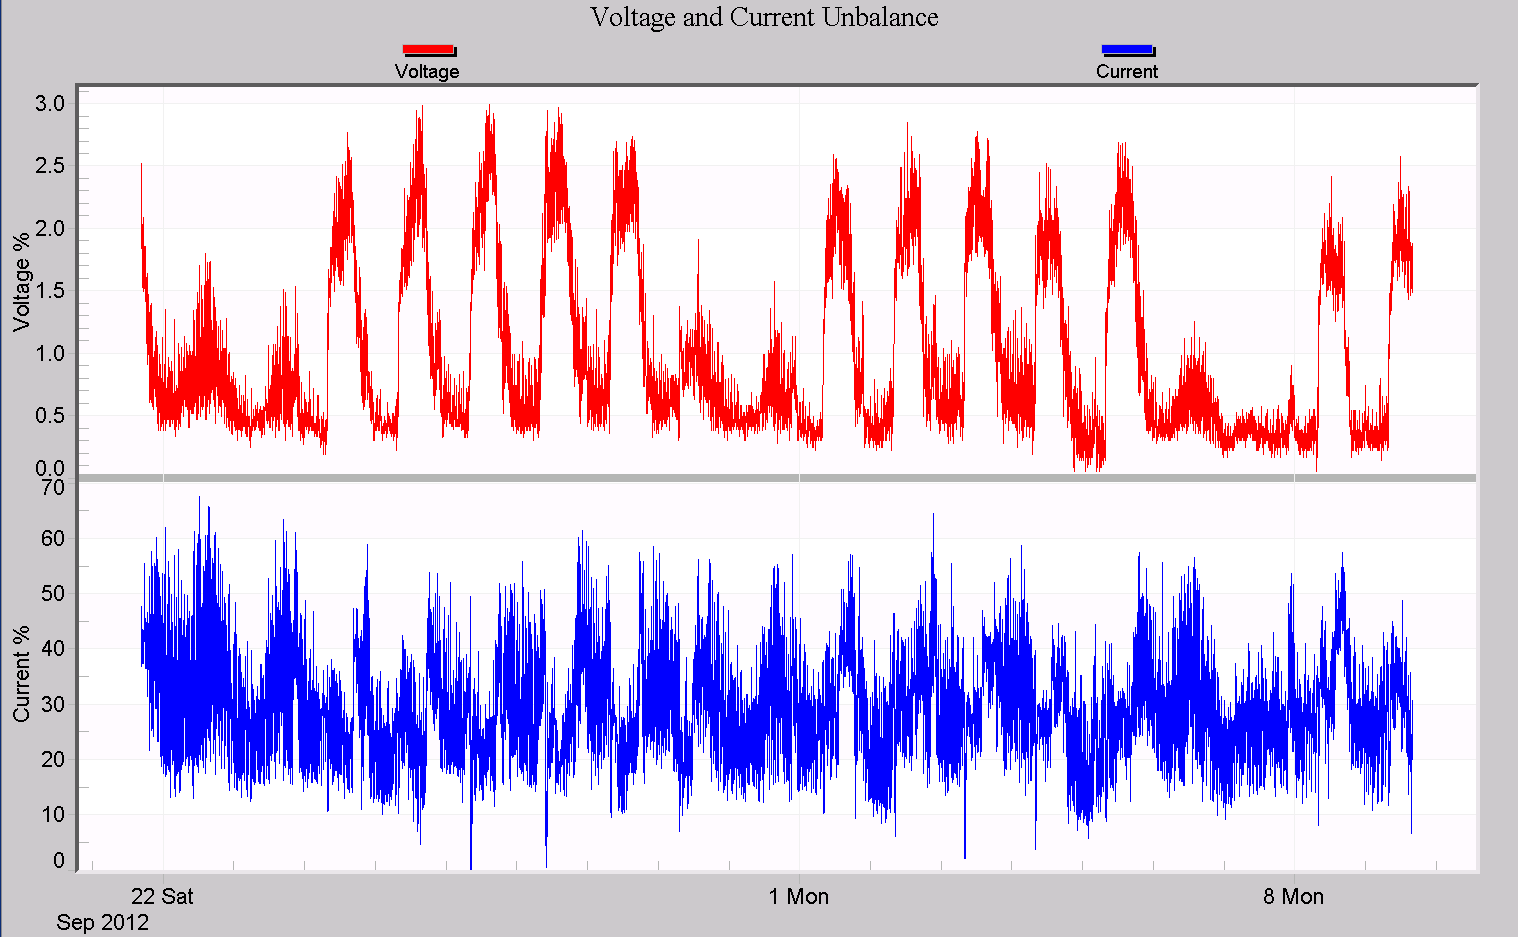
The IEC 61000-2-2:2002 standard recommends a compatibility level of 2%. Meanwhile, EN 50160-1999 requires that utilities maintain under 2% voltage imbalance for 95% of the 10 minute intervals during a week. In other words, of the 1008 10-minute periods in a week, 50 of them may have voltage imbalance over 2%. While that may seem a bit convoluted, it isn’t as bad as one might think. To make the measurement, simply select a 1 week period as a starting time frame, with a 10 minute recording interval. After downloading the recording, use ProVision to graph the voltage imbalance during this period. If the voltage imbalance remains at or below 2% for at least 95% of the time, then this standard has been met. See Figure 2 for an example of a voltage imbalance graph.
Voltage Distortion
Voltage distortion – in this particular case harmonic distortion – is an increased magnitude of one or more harmonic frequencies within a waveform (not including the fundamental). Total Harmonic Distortion (THD) is calculated as the sum of the magnitudes of all harmonics (even and odd) past the fundamental expressed as a ratio with the fundamental itself.
where Mfund is the magnitude of the fundamental, h is the harmonic number, H is the maximum harmonic number (for example 51 or 52), and Mh is the magnitude of harmonic h.
THD is expressed as a percentage and the IEEE Std 519-1992 recommends a THD of <= 5% and a level of 3% for individual harmonic components. (For an individual harmonic component, simply divide the magnitude of the component into the magnitude of the fundamental and multiply by 100 to get the percentage of distortion for the given component.)
In addition to the IEEE 519-1992 standard, the IEC 61000-2-2:2002 standard specifies that THD should be set to a maximum compatibility level of 8%. (For those interested in low-voltage network recommendations, see the IEEE 1250 standard for harmonic compatibility levels derived from IEC 61000-2-2:2002.)
ITIC Curve (Formerly CBEMA Curve)
The Information Technology Industry Council (ITIC) Curve (formerly referred to as the Computer Business Equipment Manufacturer’s Association (CBEMA) Curve) is a standard provided by the ITIC for certain IT equipment.
The specification details a dual-range pair of limits for North America (“Range A” and “Range B”). Range A essentially is the “normal range” requiring voltage to be +/- 5% of the nominal 120 V base at the facility service entrance.
Range B is your “abnormal range,” but only applies to short-duration events. These limits are set to -8.3% and +5.8%.
The full ITIC specification for the United States can be found in ANSI C84.1-2006. For a more in-depth summary the full IEEE Std 1250-2011 document can be consulted.
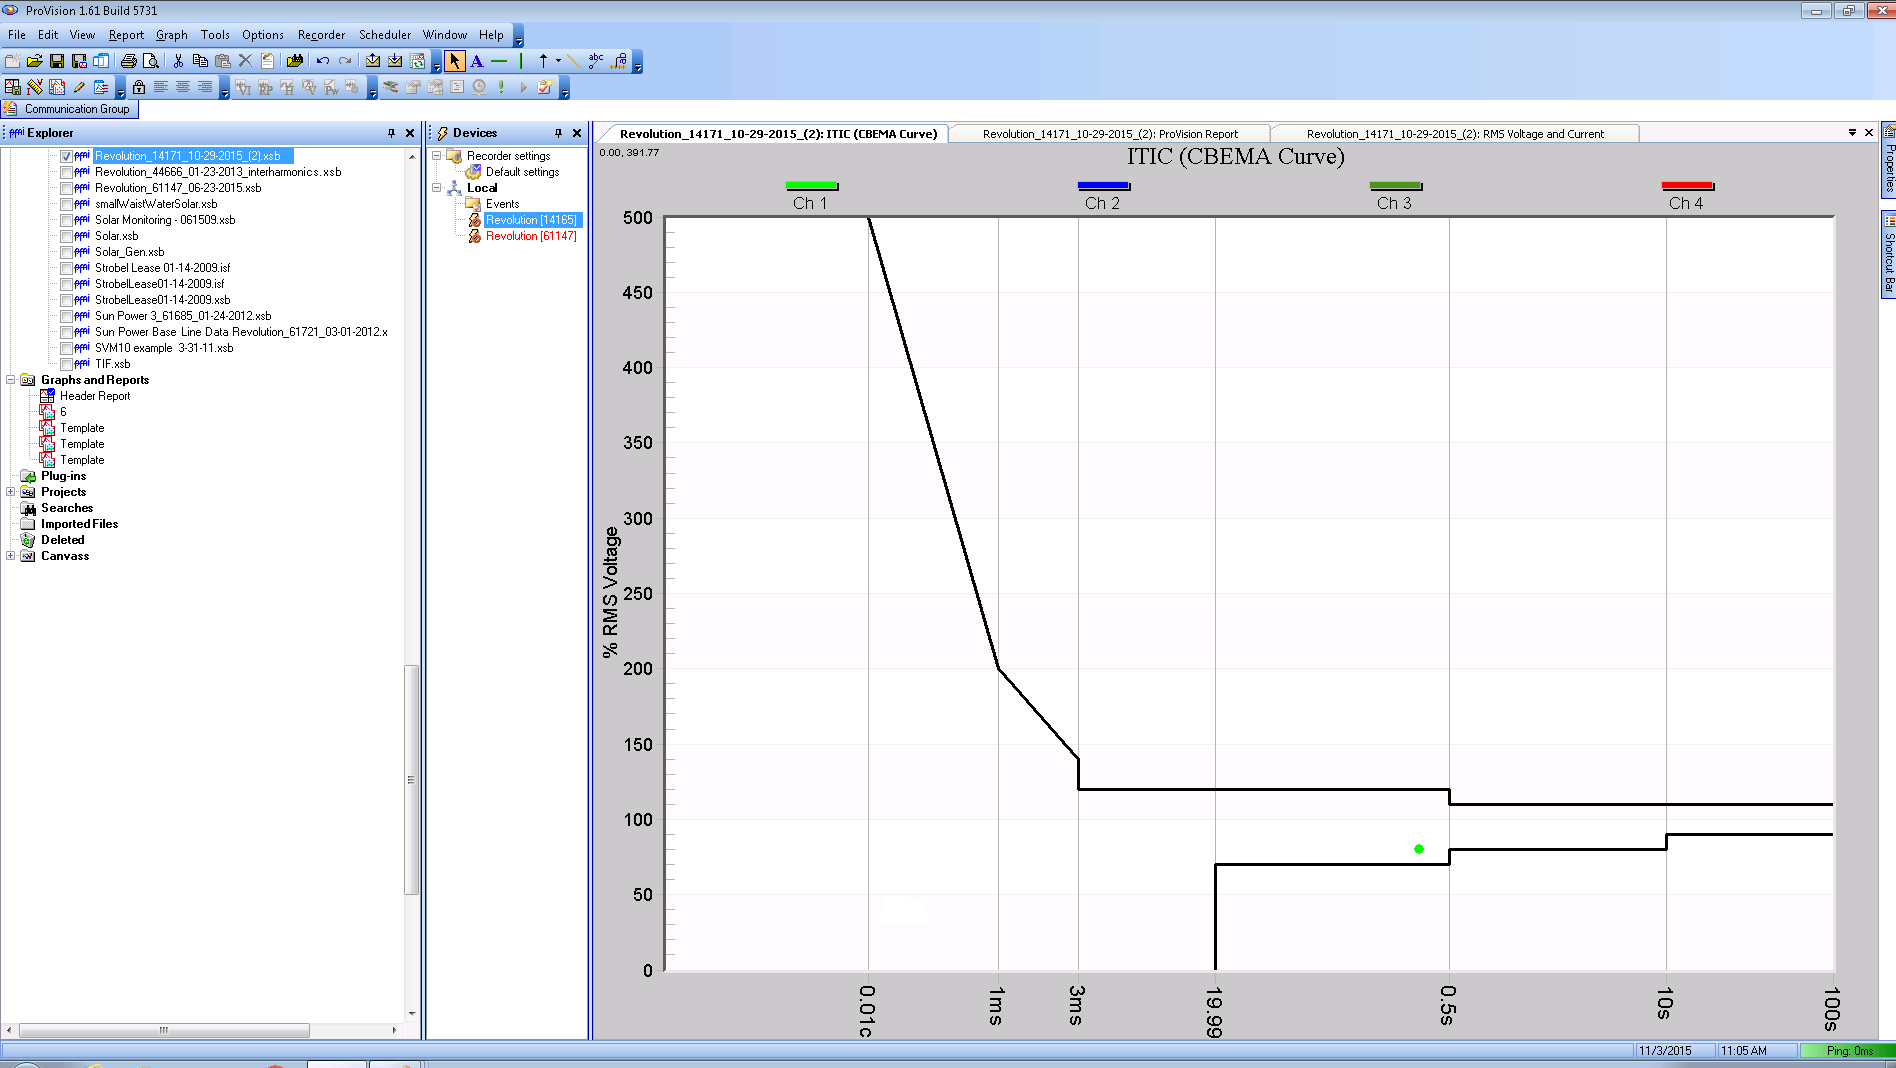
The Revolution and Guardian record ITIC events which are plotted on this curve by ProVision. An example ProVision plot is shown in Figure 3. ProVision allows customization of the curve, but it’s recommended to stay with the default standard values in most cases.
Voltage Fluctuations (Flicker)
Measuring flicker has traditionally been the means for detecting and correcting small voltage fluctuations as they translate to incandescent light flicker. As it turns out, flicker observance is a highly subjective measurement: “how annoyed is the human observer?” Essentially, the flicker standards were developed over time using different subjects and different types of lighting and then plotting the results to form a flicker curve.
The standards for flicker are discussed in-depth in IEEE Std 1453, but can be broken down into two basic parameters: the 10 minute “short-term flicker severity” and the 2 hour “long-term flicker severity”. The IEEE standard defines the “short-term” event as a “statistical analysis of ‘instantaneous flicker value’ in a way that models incandescent lamps and the observation of light intensity variations.” For the “long-term” event, the standard states that it is “calculated by combining 12 successive Pst measurements using a cubic relationship.”
The IEEE 1250 standard recommends limiting flicker to Pst = 1.0 for 95% of the measured period. A planning level of 0.7 is suggested, to allow for load increase over time that may raise the actual flicker readings.
Voltage Frequency
The standard document proceeds to define frequency in voltage systems and mentions briefly that each developed nation has a tightly controlled standard. The standard recommends referencing IEC 6100-4-30:2008 for a set of recommendations.
Voltage Sags and Momentary Interruptions
Voltage interruptions are the leading cause of disturbances in power systems. There are a series of metrics that utilities can use to quantify and qualify interruption statistics: System Average Interruption Frequency Index (SAIFI), Momentary Average Interruption Frequency Index (MAIFI), Customer Average Interruption Duration Index (CAIDI), Customer Average Interruption Frequency Index (CAIFI).
The specification defines a “reasonable” or “acceptable” SAIFI value as a range of 0.5 to 5 interruptions per year. One must, however, take into account the factors leading to the outages (weather as a factor in addition to where within the system the outage occurred).
The period or duration of an interruption for the calculation of SAIFI statistics is defined as typically being 5 minutes.
While longer term (+5 minutes) interruptions are obviously problematic for customers, short term (sometimes even of a duration of less than 100 ms) interruptions can also cause disruptions to certain susceptible equipment. The importance of these short-duration interruptions is magnified due to their increased frequency of occurrence. Many of these short-duration interruptions are caused by upstream faults in transmission and distribution circuits.
The IEEE 1250 standard recommends using the System Average RMS Frequency Index (SARFI) to measure and evaluate voltage sag performance. The SARFI index is a convenient way to express to customers how often they may expect to see some of these short-duration interruptions.
Transients
Transients are essentially oscillations in an electrical system that are caused by short-lived energy bursts. They can be caused by lightning strikes or just about any other switching event within the system. Resonances between power factor correction capacitors and inductive loads can turn simple switching event into a high voltage ringing waveform.
Protection from transients within a system is typically achieved with the use of surge protection equipment – though certain high-magnitude transients may still affect equipment. An example would be the charging of a DC capacitor in a VFD as a result of a capacitor switching transient. This specific scenario may cause equipment tripping due to the DC overvoltage situation. An understanding of how transients can affect a system, and vice-versa, is an important part of outfitting an electrical network from the perspective of the electric utility.
Conclusion
The IEEE 1250 standard provides a very strong, well-documented, researched and tested series of guidelines for maintaining voltage power quality throughout the generation, transmission and distribution systems. This whitepaper has covered some of the more useful areas outlined within the standard, as well as provided some insight into how PMI’s power quality recorders and software can help make these recommended measurements in order to stay within the standard’s guidelines.
