Abstract
Waveform capture is the highest resolution data available for PQ analysis and is often crucial in solving tricky issues. Successfully triggering on the waveform doesn’t have to be tricky, though. This whitepaper reviews the waveform capture triggers and gives suggested starting points for several different scenarios.
The key to successful waveform capture triggering is understanding how the triggering system works. There are three types of triggers for waveform capture: threshold, periodic, and cross-triggers. A threshold trigger fires when its parameter changes by more than the threshold from one 60Hz cycle to the next. Periodic triggers fire based on an internal timer and a user-settable period. The cross-trigger (available on the Revolution and Vision) fires if Event Capture or Transient capture triggers. Often just one type of trigger is needed for a particular scenario, but understanding the rules is important for capturing that crucial waveform.
Threshold Triggers
All the threshold triggers work on the same principle. For each trigger, there’s a parameter that’s measured every 60Hz cycle. Each cycle, the value is compared to the previous cycle’s value, and if the difference exceeds the threshold, the trigger is fired. For example, one trigger parameter is RMS voltage, with a threshold defaulting to 5V. With this setting, if the RMS voltage changes from one cycle to the next by more than 5V (either higher or lower), then the trigger condition is met, and a waveform is captured. If the change in RMS voltage was less than 5V, then the new RMS value is saved for the next cycle, when the comparison is performed again. Thus, the voltage could theoretically change by up to 4V per cycle and not trigger a waveform capture. For example, consider an 80% sag on a 120V nominal where the RMS voltage smoothly went from 120V to 96V in 8 cycles (133 ms). During the sag, the RMS voltage would be decreasing by (120-96)/8 = 3 volts/cycle, and with a 5V/cycle trigger threshold, a waveform would not be captured.
Figures 1 and 2 show the threshold triggers, as seen in the ProVision setup screen. All these thresholds work on the same principle described above, of detecting a change in value from one cycle to the next. Each also has separate values for each channel, and any channel that triggers a waveform capture automatically triggers it for all channels. To disable a trigger, use 0 or a very large value for the threshold.
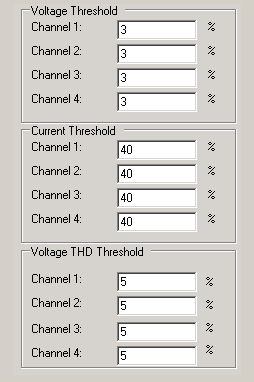
There are two types of voltage thresholds. The Percent threshold is a trigger on the percent change of RMS value from one cycle to the next. For example, the default 3% would equate to 3.6V at a 120V nominal. If the RMS voltage went from 120V during one cycle to over 123.6V or under 116.4V the next cycle, the trigger condition would be met, and a waveform would be captured.
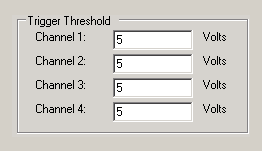
The Absolute Voltage threshold (Figure 2) uses a fixed voltage change threshold instead of a percentage. For a given nominal voltage (e.g. 120V), there’s often no difference in using the Percentage or Absolute trigger, but if the nominal line voltage isn’t known in advance, they will act differently. Unless special circumstances indicate otherwise, it’s often easier to use the Percent threshold rather than the Absolute, although there’s no harm in having both enabled.
The Voltage Percentage threshold is a relative value – it’s a percentage of the line voltage. This is appropriate since the voltage typically is regulated to a nominal line voltage. RMS current is not regulated and varies much more than line voltage. Consequently, the Current Threshold (Figure 2) is a percentage but is not a relative percentage. Instead, the percentage is of the full-scale current range used during the recording. For example, if the 100A range is selected, then the default 40% trigger threshold equates to 40% of 100A or 40A. With this setting, the current must change by more than 40A from one cycle to the next to trigger a waveform capture.
The Voltage THD threshold (Figure 1) is a waveshape trigger – rather than looking for RMS magnitude changes, this trigger is for changes in waveform shape that may not affect the RMS value much (e.g. a capacitor bank switch). The THD (Total Harmonic Distortion), measured as a percent of fundamental, including harmonics to the 51st, is computed once per cycle. If the THD changes by more than the specified percent compared to the last cycle, the trigger is met and a waveform capture is stored. For example, if the trigger threshold is 2%, and the THD changes from 1.2% to 3.5% from one cycle to the next, a waveform capture is stored. The THD trigger is available in the Revolution and Vision.
Periodic Triggers
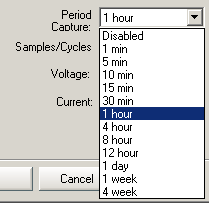
The Periodic trigger is a mechanism to automatically capture a waveform on a regular, timed basis, regardless of voltage or current conditions. This is useful for guaranteeing that some waveforms will be stored at regular intervals during a recording, and also for computing harmonics from waveform capture. Since the periodic trigger would typically miss an actual disturbance, it’s a good way to get a baseline “normal” waveform for comparison with other captures. To configure Periodic triggering, use the drop-down list to select a time period (Figure 3). If periodic capture the only waveform triggering used in a recording (e.g. for a harmonic study from waveform capture data), then the period is usually set to just fill up the waveform memory during the recording session. If a combination of periodic and triggered waveforms are expected, then the period is typically set to something larger, to avoid filling memory with periodic captures at the expense of triggered ones. If a known change in line conditions happens on a periodic basis (e.g. a large load cycling on and off), it can be useful to set the period to a value specifically to guarantee waveforms in both modes. Periodic triggers occur on even time boundaries. For example, with a 1 hour period, the trigger fires on even-hour boundaries (12:00am, 1:00am, etc.) regardless of the exact start of recording.
Cross-Triggers
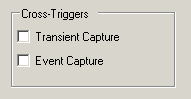
The final trigger mechanism is cross-triggering. Available for the Revolution and Vision, the cross triggers (Figure 4) will trigger a waveform capture if either Event Capture or Transient Capture records are triggered. This ensures that a full waveform capture is available at the same time as an Event or Transient, as defined by those record types. Although enabling a cross trigger is as simple as checking the checkbox, it’s important to keep in mind that with cross-triggers, other record types are now capable of interfering with waveform capture. For each enabled cross-trigger, be sure to check the settings for the corresponding record type (Event or Transient), to make sure those settings are appropriate. Casually clicking the cross-trigger checkbox without considering the settings of the other record type could result in filling up waveform capture memory with useless waveforms, overwriting legitimate waveform-triggered captures.
Waveform Capture Memory Settings
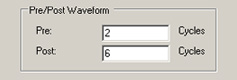
With the triggers and threshold in place, the next parameters to configure relate to waveform capture memory. The Pre and Post settings (Figure 5) control how many cycles are recorded with a triggered waveform. All waveform captures, regardless of the trigger source, are a fixed length – one cycle for the trigger, plus the Pre and Post cycles. The default 2 Pre cycles and 6 Post cycles give a 9 cycle waveform capture. Either can be set to 1 cycle, or as high as 1100 cycles, with the limitation that the minimum capture size is 3 cycles, and the maximum capture is 1100 cycles (over 18 seconds). These values may be adjusted to cover the longest expected event, or to conserve waveform memory.
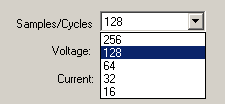
The number of samples per cycle may also be adjusted (Figure 6). The default is 256 samples per cycle and gives high resolution for waveform-based events. Halving this to 128 samples/cycle doubles the number of waveforms that will fit into memory, though, and is often a good trade-off. For RMS-based events like motor starts, etc. 64 or even 32 samples per cycle may be sufficient, and handy for getting extremely long captures (e.g. 10 seconds or more of continuous waveform data). This setting only affects the waveform capture storage rate – all other recorder calculations are always performed at the full recorder sampling rate.
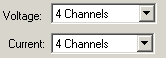
The number of voltage and current channels may also be adjusted (Figure 7). This controls the number channels recorded during a capture, and also the number of channels used for triggering. The number of voltage and current channels may be adjusted separately, and may be set to zero if not needed. This setting does not control the number of channels used for stripcharts or other data types – it’s just for waveform capture. Often only three channels are actually needed, and on a four channel recorder setting these to 3 will result in more waveform captures fitting into the available memory. It’s good to note that the recorder will automatically reduce these to at most the actual number of channels present, to avoid wasting memory. For example, if four channels are enabled, but the actual recorder only physically has three channels, the setting will be reduced to three by the recorder.
The final setting for waveform capture is the Overwrite selection (Figure 8). Checking Overwrite will enable wrap-around recording, where the oldest waveforms are deleted to make room for the newest waveforms when memory is full. If this is not checked, then waveform recording stops when memory is full. This is a separate overwrite setting than the stripchart overwrite setting. Generally, it’s better to enable overwrite, especially if the recorder will be left in place until an event happens, or a customer complaint is received. Periodic capture studies may be an exception – if the focus is on periodic capture to record baseline or waveform snapshots, it may be better to set the period, and disable memory overwrite, if the desired time period is relative to the time of installation rather than the time of removal.

The total number of waveform captures and total time (if using Periodic Capture) is displayed in the Info box as shown in Figure 9. Adjusting the Pre and Post cycles, the number of channels, sampling rate, etc. will all update the information in the Info box, so you can interactively see how the settings relate to memory usage. The recording time estimate counts only Periodic Capture waveforms – any triggered waveforms would reduce the time shown. It’s easily possible to adjust the settings to result in many thousands of available waveform captures, or just one. For example, one voltage channel, 1 Pre and Post, 128 samples/cycle is a possible single-phase periodic capture setup, allowing 4047 waveforms (and lasting 2 weeks with 5-minute captures). On the other extreme, 30 Pre, 1000 Post cycles, 64 samples/cycle, and 4 voltage and current channels give just a single waveform capture, albeit an 18-second long one! This might be a motor start configuration.
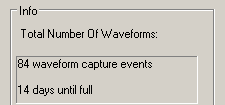
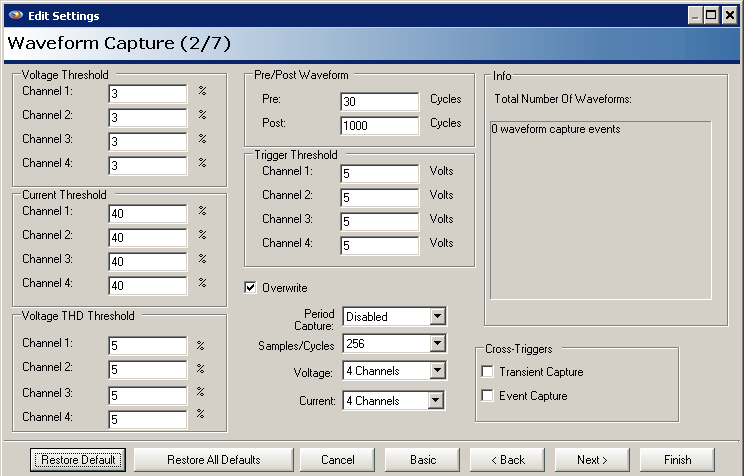
Figure 10 shows all the default Waveform Capture settings on the ProVision settings wizard. If a connected recorder doesn’t support some options, they will appear grayed out in the form. The default settings in Figure 10 are a good starting point for a generic PQ recording, but different types of monitoring needs can benefit from some fine tuning.
Motor Start Settings
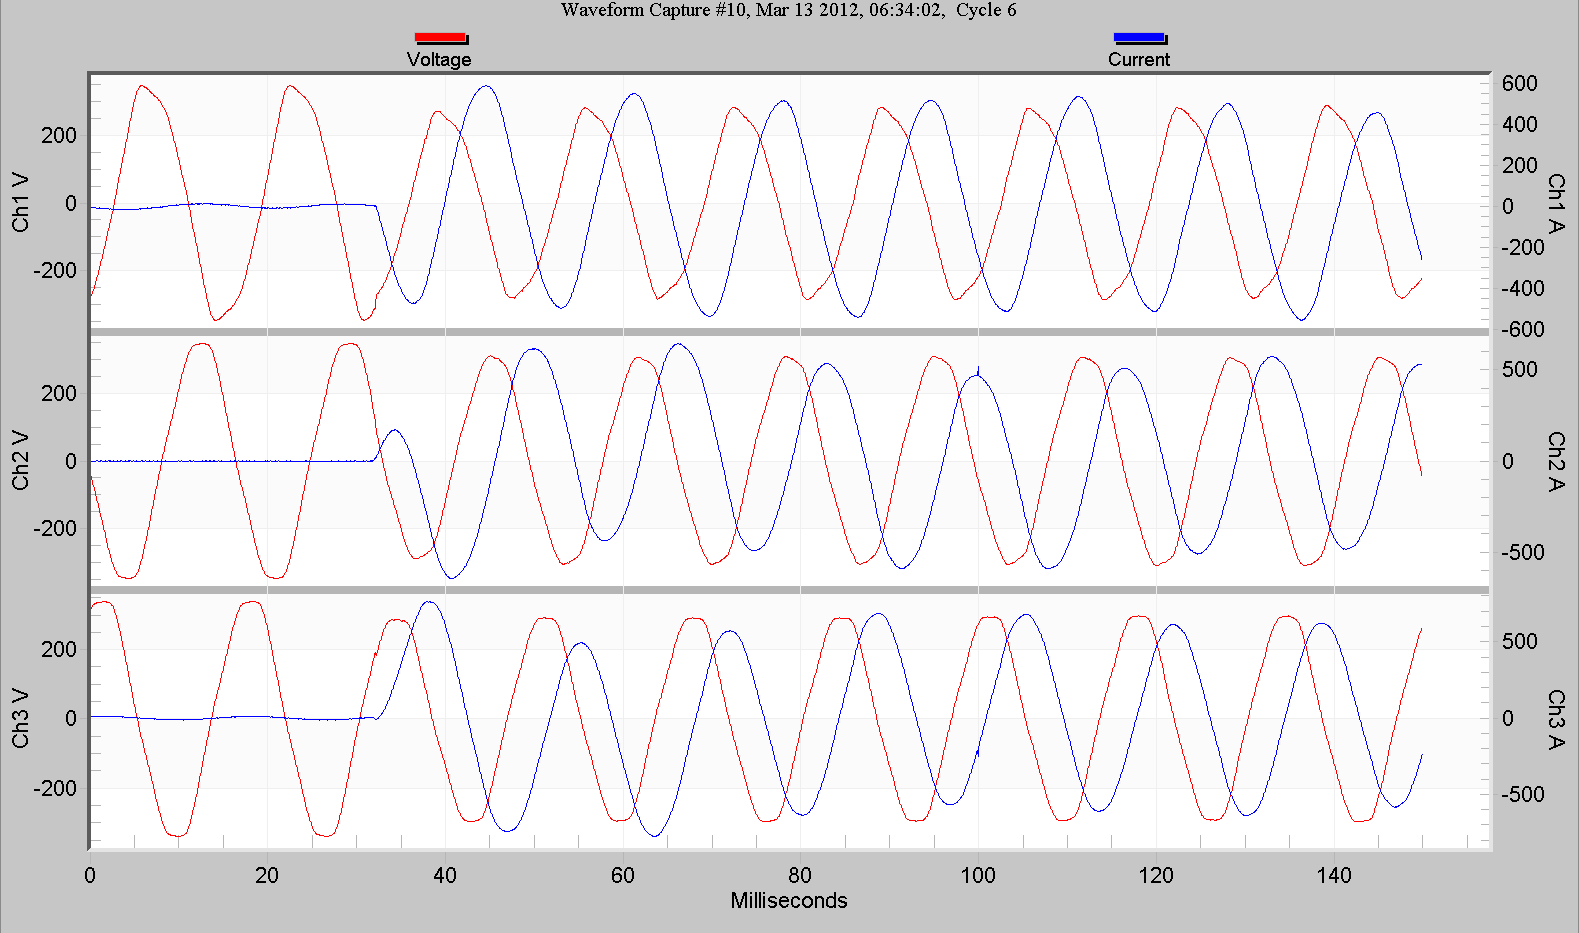
For a motor-start study, typically the recording is completed while on-site in a short session. During the recording, the motor is started and/or stopped on demand, and the recording is ended. This may also be applicable to generator testing, or transformer switching, where the recording is very short and the event is produced on demand. In this case, only a few waveforms are needed, and it can be useful to extend the Pre and especially Post cycles. For motor starts, usually only the continuous RMS voltage is needed. A full 256 samples/cycle isn’t needed for good RMS computations – this can be reduced to 128 or even 64 samples per cycle, which allows for very long waveforms. A 6 to 10-second waveform length can be useful to capture a full motor ramp-up, and is easily possible with 128 or 64 samples/cycle. In this case, it’s easiest to trigger on the current, especially if the motor is the only load. The voltage triggers may be disabled, and the current set to a relatively low value (e.g. half the motor running current). Cross triggers and periodic triggers should be disabled, and only the minimum number of channels enabled. Setting the stripchart to a 1 cycle interval may also be useful. A typical motor start is shown in Figure 11. Here, the starting current continues past the capture window – the Post cycles should have been lengthened.
Settings for Voltage Sags
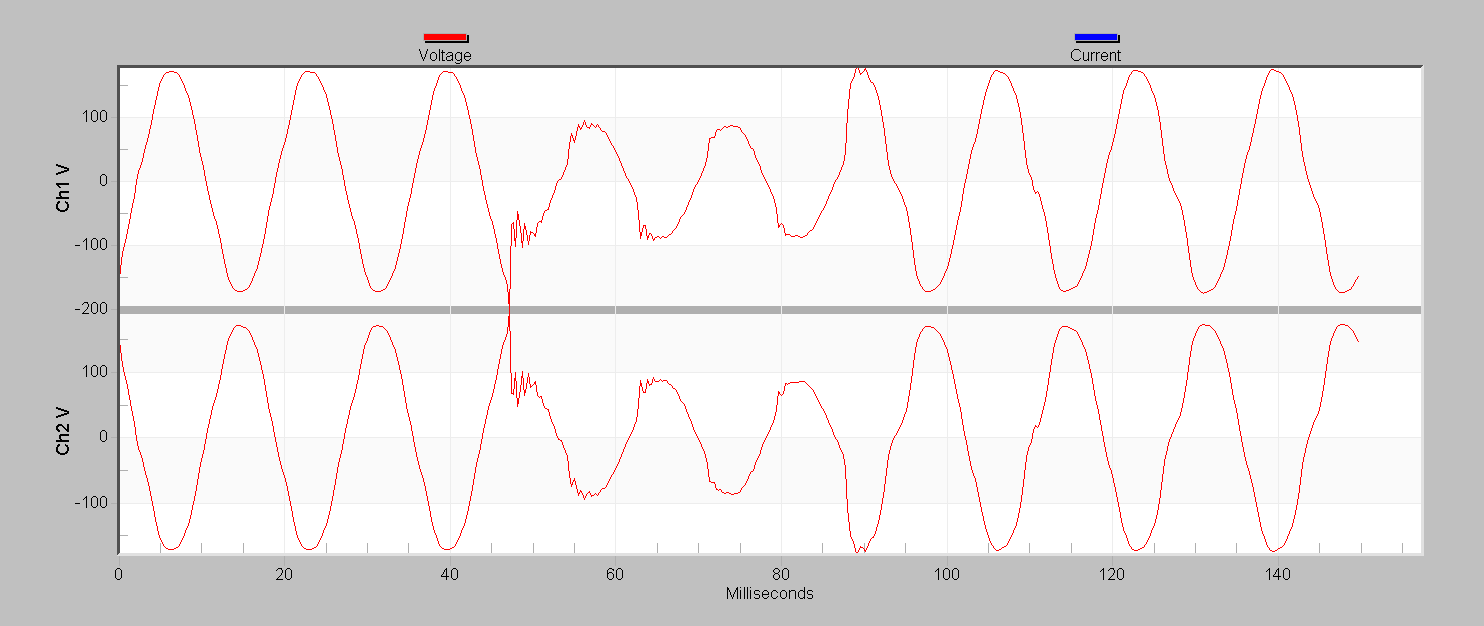
For capturing voltage sags, the settings are much different. Here the goal is to maximize waveform capture memory and reduce false triggering while not missing actual sags. If the monitored load is a possible source of sags, set the current threshold to a value related to the load (or to a value expected to sag the voltage given the stiffness of the source at that point). Values of 20 to 40% of full scale are good starting points, assuming the full-scale current is correctly chosen for the system (e.g. 100 or 200A for a residential service, or 1000A for a larger commercial service). The default voltage thresholds and Pre and Post values are good starting points, although the voltage percent could be lowered to 2% if the system is believed to be relatively clean, and the Post value could be reduced by a cycle or two to boost memory. The sampling rate can be reduced to 128 samples/cycle if needed for more captures. Periodic capture isn’t helpful for sags, but setting it to something high (e.g. every 12 or 24 hours) doesn’t affect the memory too much, and can be helpful if nothing else triggers, to see a baseline. The Event Capture cross-trigger may be useful, but don’t enable this until you’re sure the Event Capture settings are also good. The Voltage THD and Transient cross-triggers aren’t generally useful for catching voltage sags. Figure 12 shows a typical deep but short sag, likely caused by an upstream fault or inter-tie switch.
Settings for Waveshape Events
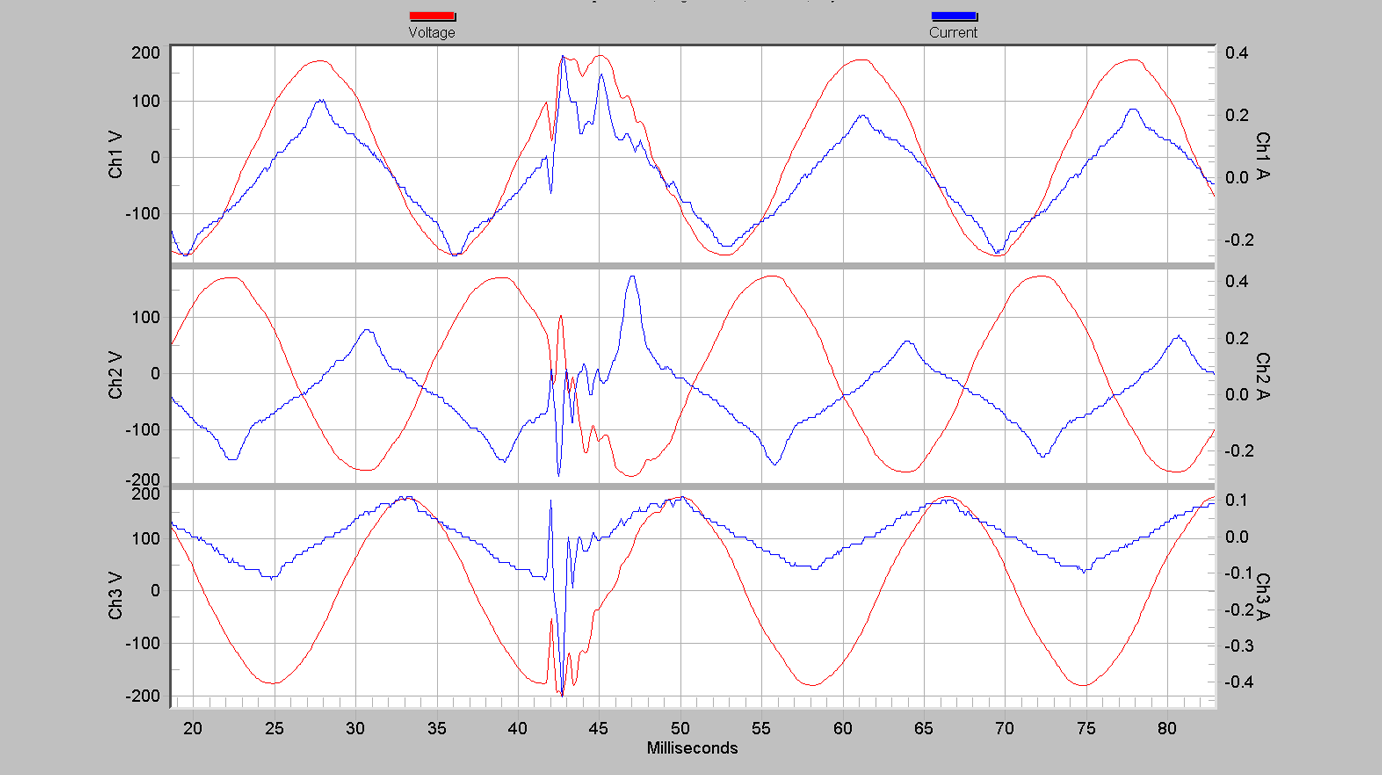
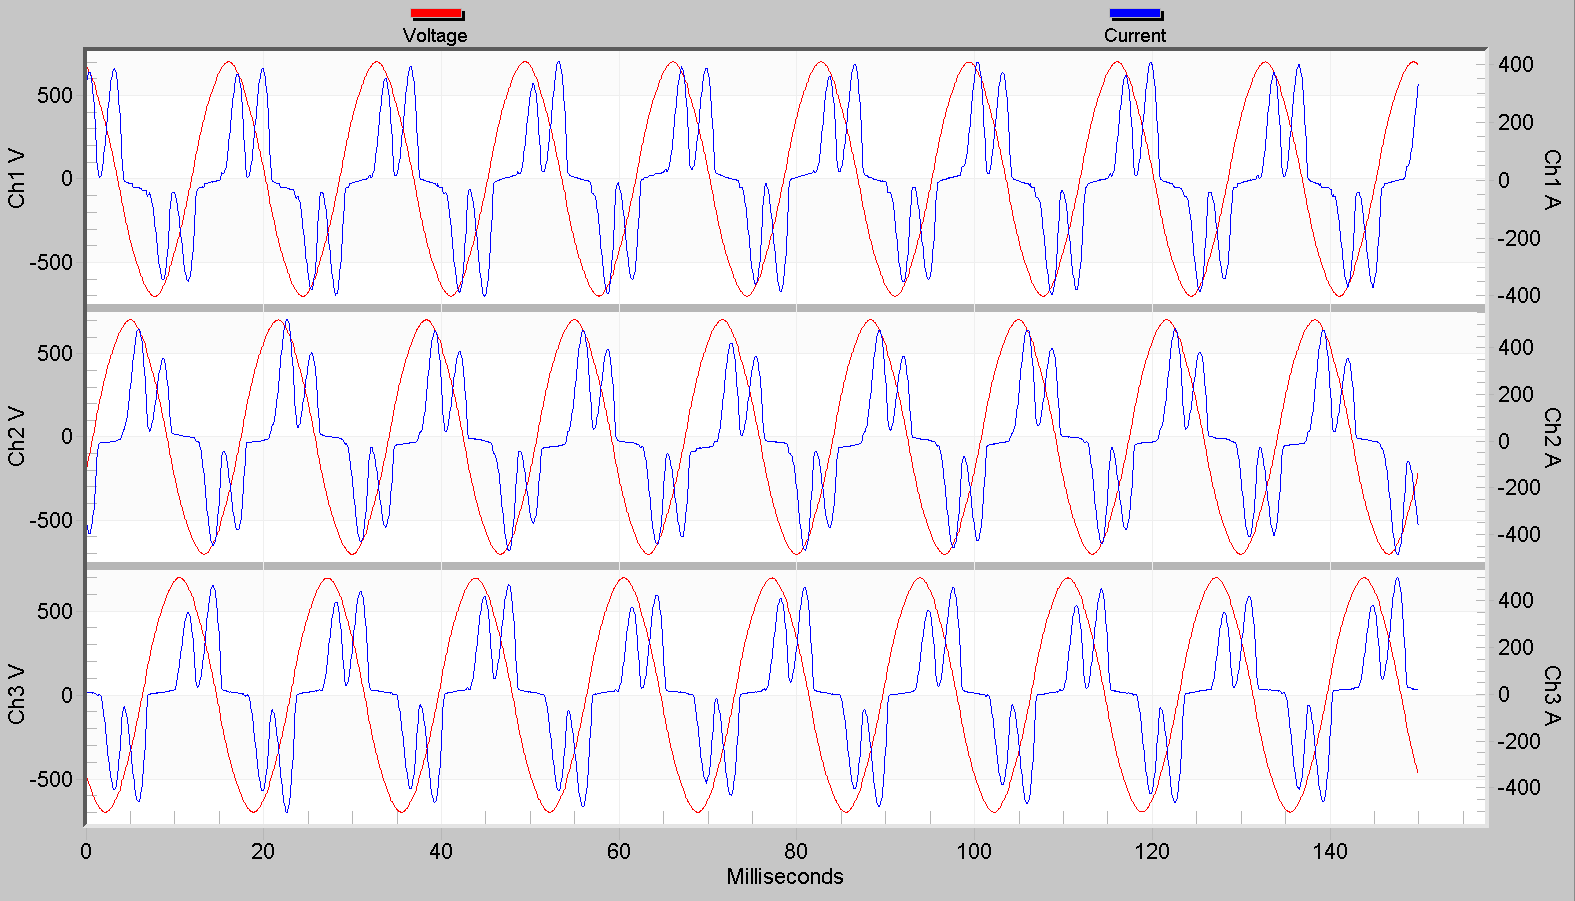
For capturing waveshape events such as cap bank switches, inter-tie changes, generator switchovers, etc. the best trigger is the Voltage THD threshold. The THD threshold can be set to 3% for more sensitivity, or even down to 2%. These events are typically only a few cycles long, so the Pre could be set to 1, and Post down to 3 or 4 to increase memory. Often current or four channels aren’t needed, so be sure to adjust the number of channels if needed to get more waveforms (helpful if you lower the threshold down to 2%). The voltage thresholds aren’t likely to be useful for capturing waveshape events, but if you’d still like to catch any deep sags, leave these enabled, but consider increasing the thresholds to 4% or higher, or more than 5V. The Transient cross-trigger is good to have, although be sure to double-check the Transient trigger setup (there’s whitepaper on this too). Event capture isn’t useful for waveshape detection, so this cross-trigger may be disabled. These waveforms often contain oscillatory events (ringing, etc.), so it’s helpful to have the full 256 samples per cycle. A typical waveshape change event is shown in Figure 13. Despite the distorted voltage waveform, the RMS value never changed by more than 5V, although the THD changed by more than 9.9%.
Settings for Harmonic Studies
For harmonic studies, periodic capture is required. There’s a whitepaper on the topic of using periodic waveform capture for harmonic analysis with more detail, but in general, the triggered thresholds should be disabled, and the periodic setting adjusted to span the entire recording setting with the waveform capture memory. Pre and Post cycles may be set to 1, and the sampling rate set to 256 or 128 samples/cycle. Be sure to reduce the voltage and current channels to the minimum needed for harmonics. Figure 14 shows a typical periodic capture from a harmonic study – 65% THD on the current, resulting in about 1.5% THD on voltage.
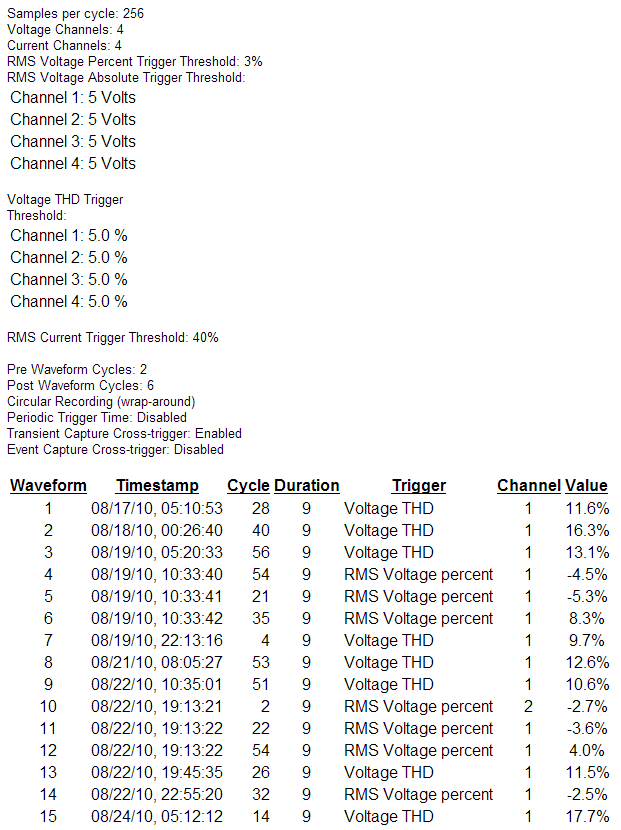
It’s helpful to look back at the settings after a recording is complete and compare them to the captures. The Revolution and Vision also show the trigger source and magnitude in the waveform report (Figure 15) – this can be invaluable in fine-tuning settings for future recordings.
Conclusion
Although the default waveform capture setting is good for general-purpose PQ monitoring, changing them is straightforward once the different trigger mechanisms are understood. It’s especially useful to configure waveform capture when monitoring for specific scenarios or events. Be sure to save your fine-tuned settings as templates to use later, or for sharing.
