Abstract
This white paper describes how to select the proper hardware for high resolution current monitoring with PMI Recorders.
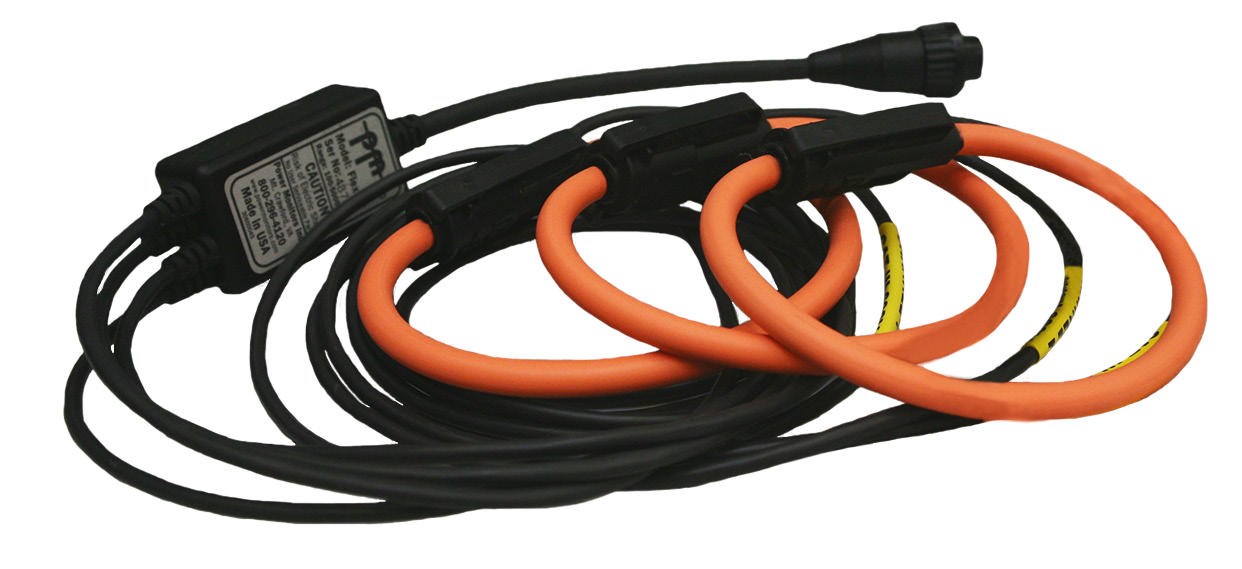
Most of PMI’s recorders offer the ability to measure current via user selectable iron core TLAR clamps (Figure 1) or Flexible CT’s (Figure 2). In order to fully understand the differences between these devices, it is necessary to review their specifications. Table 1 outlines the complete specifications of the TLAR (Iron Core Clamps). Table 2 contains the specifications for Flex CTs (Flexible, Multi Length Clamps).
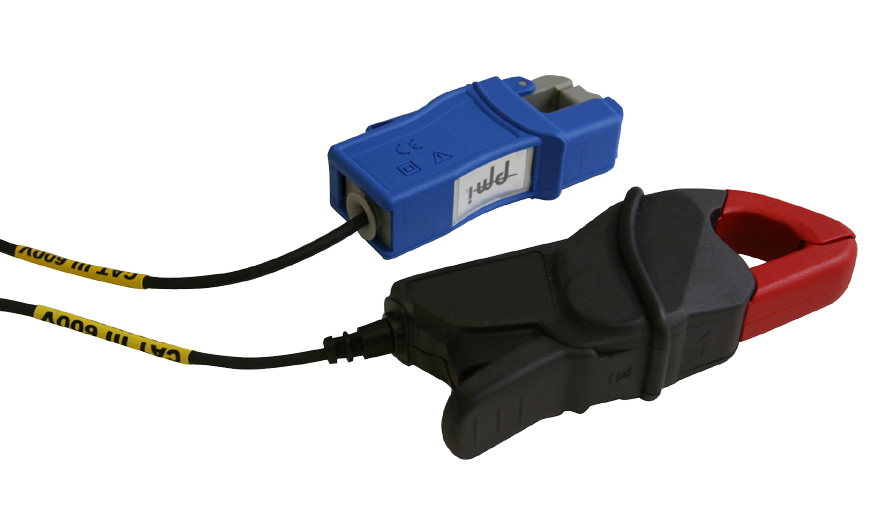
A review of the specifications of the Flex CTs and TLARs helps to define the possible applications for each type of probe. The main difference between the two is the full scale current range for which each device is rated. The full scale range of the TLAR is 200A; for the Flex CT it is 5000A. This is a huge difference in terms of amperage, but the main difference is in application. Both devices serve the same function, but the TLARs are better suited for data resolution at lower current levels.
Full Scale Value (Also Known as A/D Counts)
To fully understand the operation of the each device, it is necessary to address the theory behind Analog to Digital (A/D) converters.
The full scale value of an A/D converter is purely dependent on the hardware of the data processing device. The full scale value of an A/D converter is directly proportional to the resolution of the processed signal (higher full scale value equals higher resolution). In order to take advantage of the full scale value of the A/D converter in PMI products a hardware device known as gain controller is used.
Table 1. Specifications for TLAR Iron Core Clamps
| TLAR Specifications | |
|---|---|
| Current Ranges | |
| Current Ranges | 20A, 200A AC |
| Electrical Specifications | |
| Operating Limit | 200A Continuous |
| Frequency Range | 40 to 10kHz |
| Working Voltage | 600 VAC max |
| Influence of conductor position in jaw | 0.5% of reading at 50/60Hz |
| Influence of adjacent conductor | 1.50% |
| Influence of frequency | 40Hz to 1kHz: 3% of reading, 1kHz to 10kHz: 12% of reading |
| Phase Shift | 1-20A: ≤ 3°; 20-80A: ≤ 2°; 80-200A: ≤ 2.5° |
| Accuracy (20A scale) | 1 to 20A: 1.5% of reading ±0.1A |
| Accuracy (200A scale) | 1.5% of reading ±0.5A |
| Safety | |
| Rating | UL 61010B-1, IEC 61010-1, 600V CAT III |
| PMI Recorder Capability | 10A range only with iVS-3/600E and ViPs with SNs lower than 61000, otherwise adjustable 20A/200A range |
| Environmental | |
| Operating Temp | 14 to 131° F (-10 to 55° C) |
| Operating Relative Humidity | 10-35° C 85% RH |
| Case Protection | Probes – IP40, Enclosure – IP65 |
| Physical Dimensions | |
| Maximum Conductor Size | 0.78 in (20 mm), bus bar 20 x 5 mm |
| Probes | 5.47 x 2.00 x 1.18 in (139 x 51 x 30 mm) |
| Enclosure | 2.36 x 1.38 x 0.67 in |
| Weight | TLAR+200/3 – 0.75 lb, TLAR+200/4 – 1.00 lb |
| Probe Leads | 4 ft, 600V rating |
| Output Cable | 9 in, 600V rating |
Gain Controller
The gain controller is a proprietary device designed by Power Monitors Inc. that allows the user to take full advantage of the resolution of the TLAR and Flex CT. Gain is the amplification of a signal to a certain level over a fixed range. Much like a water pump that controls the speed but not the quantity of water, increased gain does not affect the input signal; however, the higher the gain, the larger the output signal. This is very important in data acquisition because the signal gain must be optimized to take full advantage of the signal measuring A/D converter.
NOTE: The higher the full scale of the A/D converter, the higher the resolution of the measured signal.
Data Resolution
Data resolution is equal to the number of data points taken to recreate a desired signal over a fixed period of time. The number of data points that are measured is proportional to the resolution of the measured signal (more data equals higher resolution). Data resolution is comparable to the resolution of a digital image taken from a camera where the higher the pixel rate per inch, the clearer the image (more pixels per inch equals more detail per inch). The same is true for the TLAR/Flex CT. The more data taken over a short range, the better the signal looks on the computer screen (more data equals more detail per unit). The closer the signal is to the full scale value of the A/D converter, the better the resolution of the measured signal.
The theory behind A/D converters and signal recreation is central to defining the applications of the TLAR and Flex CT. As previously mentioned, the primary difference between the TLAR/Flex CT is the full scale range of the current they can measure. There are many different applications for current monitoring in electrical systems. For instance, sometimes it is necessary monitor current on distribution lines via step down current transformers; while other situations may necessitate monitoring current at the service transformer. Whatever the case may be, it is important to select the best device for the application.
Table 2. Specifications for Flex CTs (Flexible, Multi-Length Clamps)
| Flex CT Specifications | |
|---|---|
| Electrical Specifications | |
| Switchable Ranges | 1 to 100A, 1 to 1000A, 1 to 5000A |
| Operating Limit | 1 to 5000A |
| Controls | Range is chosen from the recorder, PC, or PDA software |
| Power Source | Power is supplied by connection to PMI recorder. No external battery or other power source is required |
| Linearity | ±0.05% |
| Phase Shift | ≤ ±0.5% at 50 to 60 Hz |
| Frequency Range | 8Hz to 10kHz |
| Crest Factor (mid range) | 100A and 1000A scale: 3.0, 5000A scale: 1.6 |
| Position Sensitivity | ±1.5% 1 in from connector |
| Recorder Capability | iVS-3/600E may require firmware upgrade |
| Accuracy | ± 1% of full scale |
| Mechanical Materials | |
| Sensor Jacket | Polyurethane UL94V0 |
| Connector | FR Polypropylene UL94V0 |
| Cable Jacket | Polyurethane UL94V0 |
| Environmental | |
| Operating Temperature | -20 to 135° F (-29 to 57° C) |
| Altitude Operating | 0 to 2000m, derated above 2000m |
| Case Protection | Sensor and Module IP65 per IEC 529 |
| Min. Bending Radius | 1 in (25.4 mm) |
| Physical Dimensions | |
| Sensor Diameter | .310 in (7.9 mm) |
| Connector Diameter | 1.07 in max (27.2 mm) |
| Sensor Output Cable Length | 48 in (1.2 m) |
| Working Voltage | |
| Sensor | 600V AC to earth |
| Module | 600V AC to earth |
| Safety | |
| Insulation | Double Insulated |
| Sensor | 600V CAT IV |
| Module | 600V CAT III |
| Pollution Degree | 2 |
Low Current Monitoring
Low current monitoring is very common in electrical systems when the load is very small or the current is stepped down to a smaller value by use of metering CT’s (most practical cases are 5A secondaries). In this case, the current could be very small and very hard to measure without the proper equipment. The full scale current measurement for the TLAR is 200A; for the Flex CT it is 5000A. Even though these values are the full scale maximum for each device, that doesn’t mean that this is the optimum resolution setting. In the case of the TLAR, the device can be set to the 20A/200A current range by use of software controlled gain settings. In the case of the Flex CT, the device can be set to the 100/1000/5000A current range by use of software controlled gain settings.
For example, when monitoring the secondary of a high current metering CT, where the full scale is 5A on the secondary, the current would be low and the highest gain setting would be necessary to optimize the resolution of the current being measured. The TLAR is capable of being set to the 20A current range; this would be the best fit for this application. Being a 5A full scale secondary, the nominal current could be in the 1A or so range. If the TLAR were set to the 20A range, the maximum current measured (5A) would be 25% of the full scale value of the A/D converter. This application would provide the highest resolution even at very low currents.
NOTE: Use the lowest possible current setting to obtain highest resolution recording.
High Current Monitoring
High current monitoring is probably the most common in electrical systems due to the fact that metering CT’s are expensive and not installed at every location. In this case, the current could be in the hundreds to thousands of amps and fluctuating frequently. This can be a very tricky metering point because the nominal current of the load isn’t always clear. In order to achieve the highest resolution recording it is necessary to choose the proper current probes. Remember from our previous discussion about the selectable current range of the TLAR and Flex CT. The TLAR might be a better fit in a residential application on the 200A current range; whereas the Flex CT might be a better fit in an industrial environment with the current range set to 1000A or even 5000A.
For example, when monitoring at the meter base of a residential customer where the meter base is 200A it could be argued that the Flex CT would work on the 1000A range which is true, but using the TLAR set to the 200A range would give you the highest resolution. Monitoring a 200A meter base with the TLAR set to 200A would be 100% of full scale, where the Flex CT on the 1000A scale would be 20% of full scale (much lower signal resolution).
The TLAR is limited in that it can only monitor up to 200A but has much better resolution at lower current levels than the Flex CT. For the case of higher current measurements in the 1000 to 5000A range, the Flex CT must be used. When using the Flex CT in higher current applications it is still necessary to choose the right current range to have the best resolution. For example, when monitoring 1000A the Flex CT wouldn’t be set to the 5000A scale. To optimize resolution, the 1000A scale would be chosen.
NOTE: Use the lowest possible current setting to obtain highest resolution recording.
Conclusion
The resolution of data is very important when analyzing power quality issues. Reproducing higher resolution data can show greater detail and make the data look more professional. Taking the time to choose the right equipment for the job is well worth the time and effort. The few extra steps in initializing a recorder to monitor with a specific current range will provide higher resolution and a better representation of the data.
