Abstract
Analyzing interharmonic data is a complex process, due to the large amount of information recorded. ProVision 3D graphs help for quickly identifying specific interharmonics that merit a closer look, but analyzing individual interharmonics requires a custom graph template. This whitepaper presents a series of pre-built graphs for all 600 interharmonics, along with harmonic and interharmonic groups and subgroups. They can be invoked directly, to quickly examine every recording interharmonic, or used after isolating specific ones from the 3D graphs for more detailed analysis. These graph templates are especially useful when combined with other stripchart data.
Interharmonic Combinations
IEC 61000-4-7 defines a procedure for measuring the frequency spectrum of voltage and current signals. The spectrum is divided into 5-Hertz bands, and the magnitude of the signal is computed in these bands, from 5 Hertz up to 3115 Hertz. These raw interharmonic values can be recorded individually, but can also be combined into interharmonic groups and subgroups. In addition, they can be used to compute harmonic groups and subgroups, with a harmonic defined as an interharmonic frequency that is an integer multiple of 60 Hz.
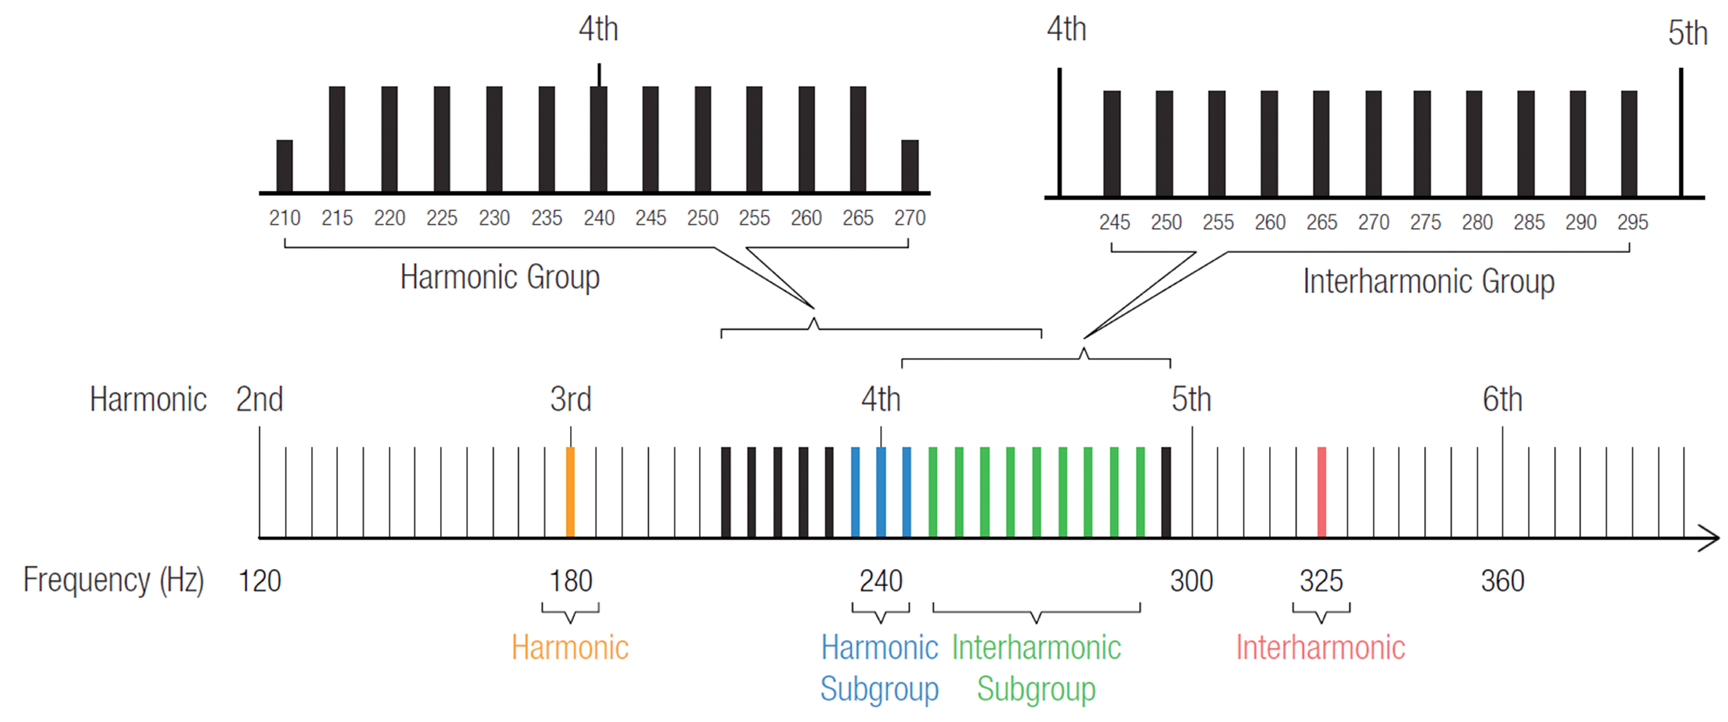
Figure 1 shows the different group and subgroup combinations. For harmonics, a harmonic group is the combination of the harmonic, plus adjacent interharmonics on either side, ± 30 Hz. A harmonic subgroup is the harmonic, plus just the two adjacent interharmonics. An interharmonic group is the combination of all interharmonic values between two specific harmonics. Finally, an interharmonic subgroup is similar to an interharmonic group, but excludes the interharmonics immediately adjacent to actual harmonics. It’s rare that each of these combinations is used at the same time, but there are specific situations where a particular one is more useful. Graph templates for all these combinations are presented in this whitepaper.
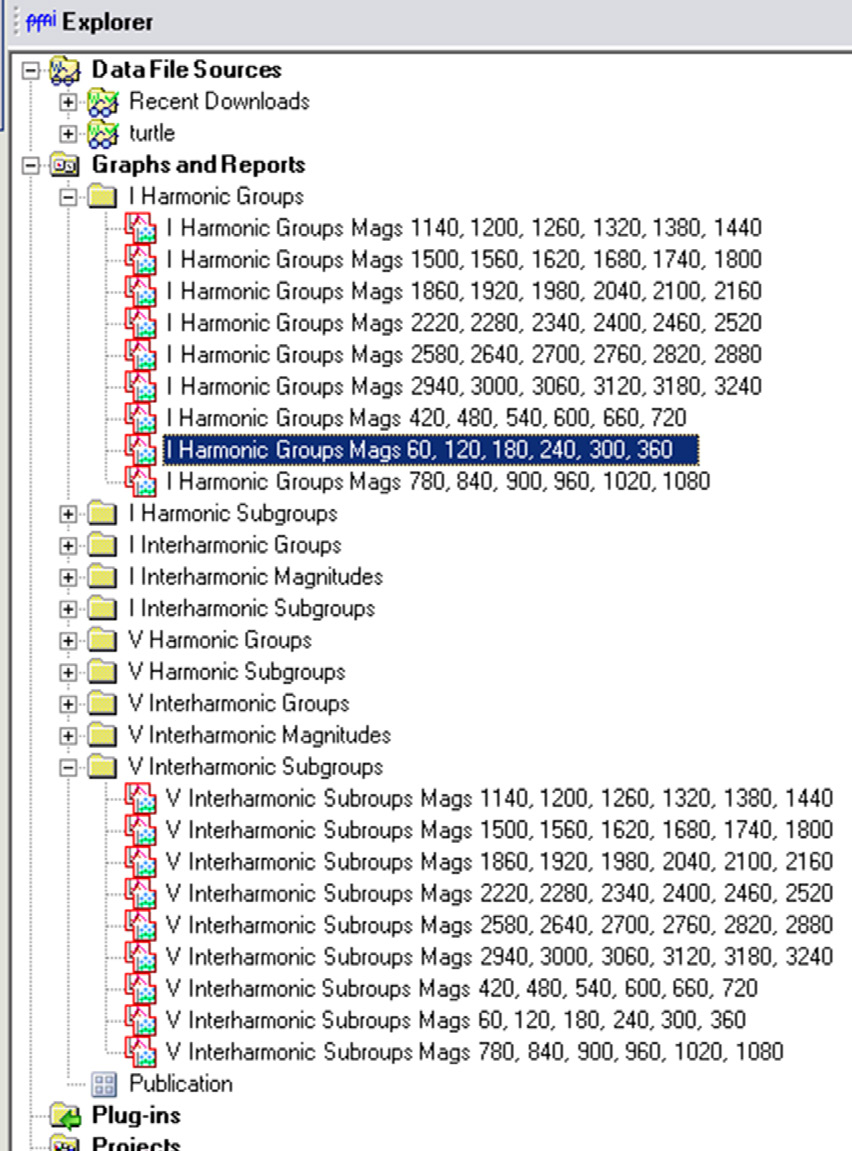
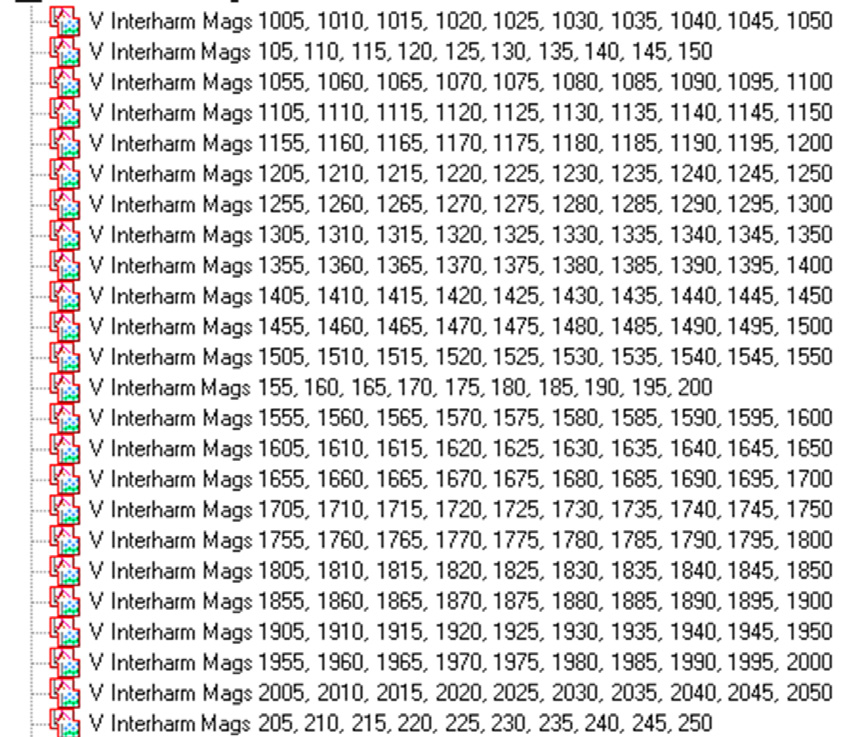
These new interharmonic graph templates may be downloaded and imported into ProVision by clicking here. After the file is downloaded, double-click it in Windows Explorer, or chose File, Open in ProVision to import the new graphs. After the import, they’re available as graph and report templates (Figure 2), and can be used on any existing recording with the required data. To launch a graph, simply open a ProVision data file, then either double-click the graph in the Graphs and Reports Tree, or select Graph, Custom Graph from the menu. To view the data in tabular report format, select Report, Custom Graph Reports from the menu. There are 198 new graph templates in this package — to help organize the new templates, it may be helpful to create an Interharmonics folder, and subfolders for the different graphs types, as shown in Figure 3.
These are stripchart graphs of individual voltage and current interharmonic magnitudes. The points are the averages, over the selected stripchart interval period defined when initializing the recorder. The average was picked instead of the max or min values, since interharmonics are most meaningful as steady-state values (in the short term).
Individual Harmonic Templates
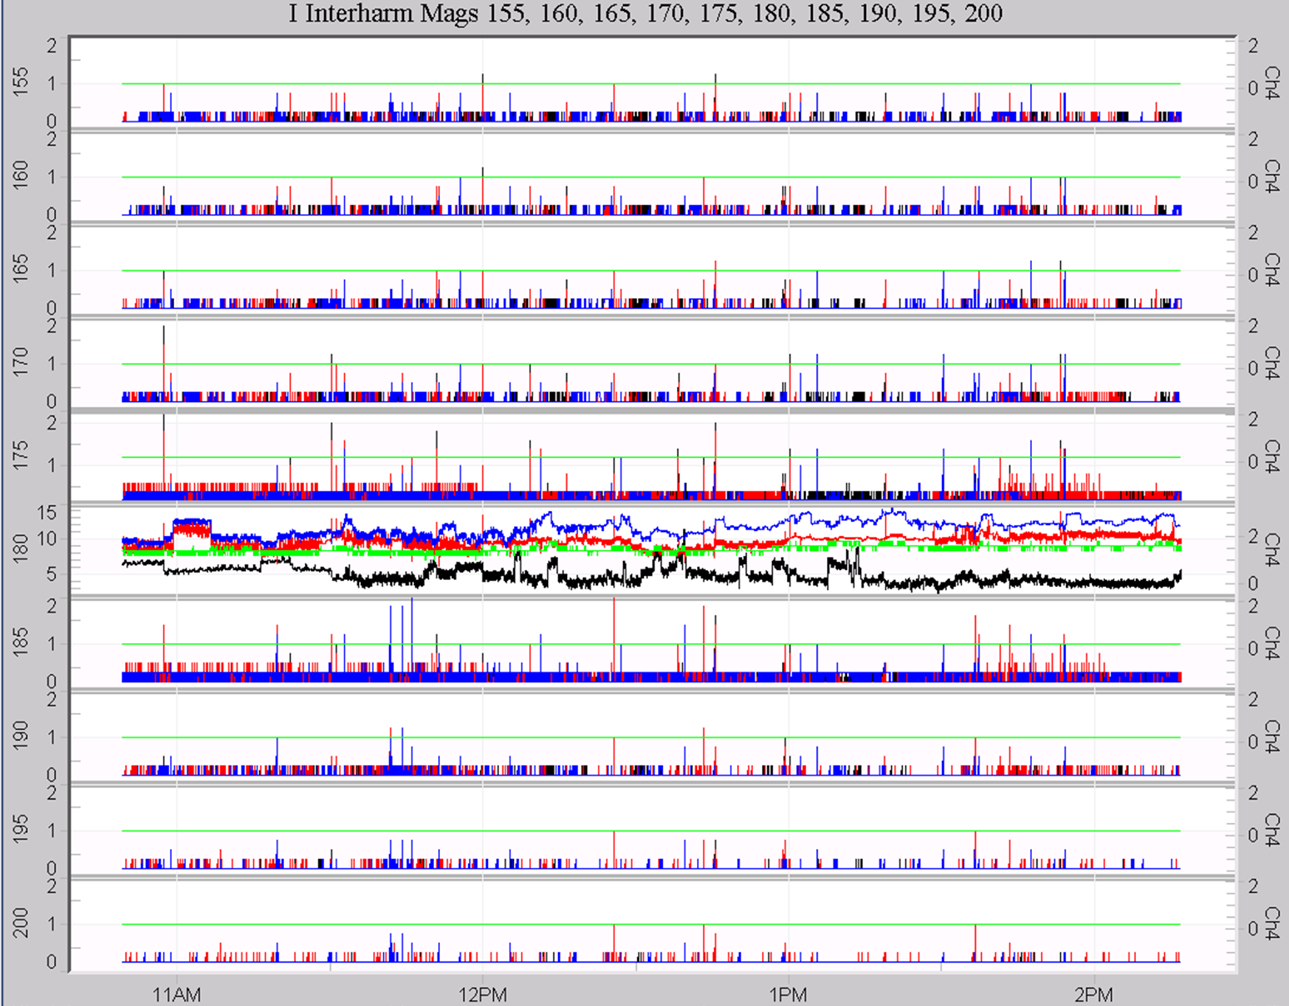
The individual interharmonic templates are all defined in the same pattern; an example is shown in Figure 4. Because there are over 600 interharmonic frequencies (every 5 Hertz, from 5 Hz to 3115 Hz), the templates include 10 interharmonics per graph – this reduces the total number of graphs to a more manageable number. Still, there are 62 separate graph templates for voltage, and another 62 for current to cover all the individual interharmonics. Each graph features one interharmonic per plot, with the interharmonic frequency on the left axis. Channels 1, 2, and 3 use the left y-axis for scaling, while channel 4 is on the right y-axis. The color scheme is black, red, blue, green, for channels 1, 2, 3 and 4, respectively. This is the same convention used for the harmonic templates. With 10 plots per graph, maximizing the plot area is important, so no legends were added at the top of the graph, and the y-axis labeling is truncated. Even with 10 interharmonics per template, there are still over 62 templates required to cover from 5 Hz to 3115 Hz.
Group and Subgroup Templates
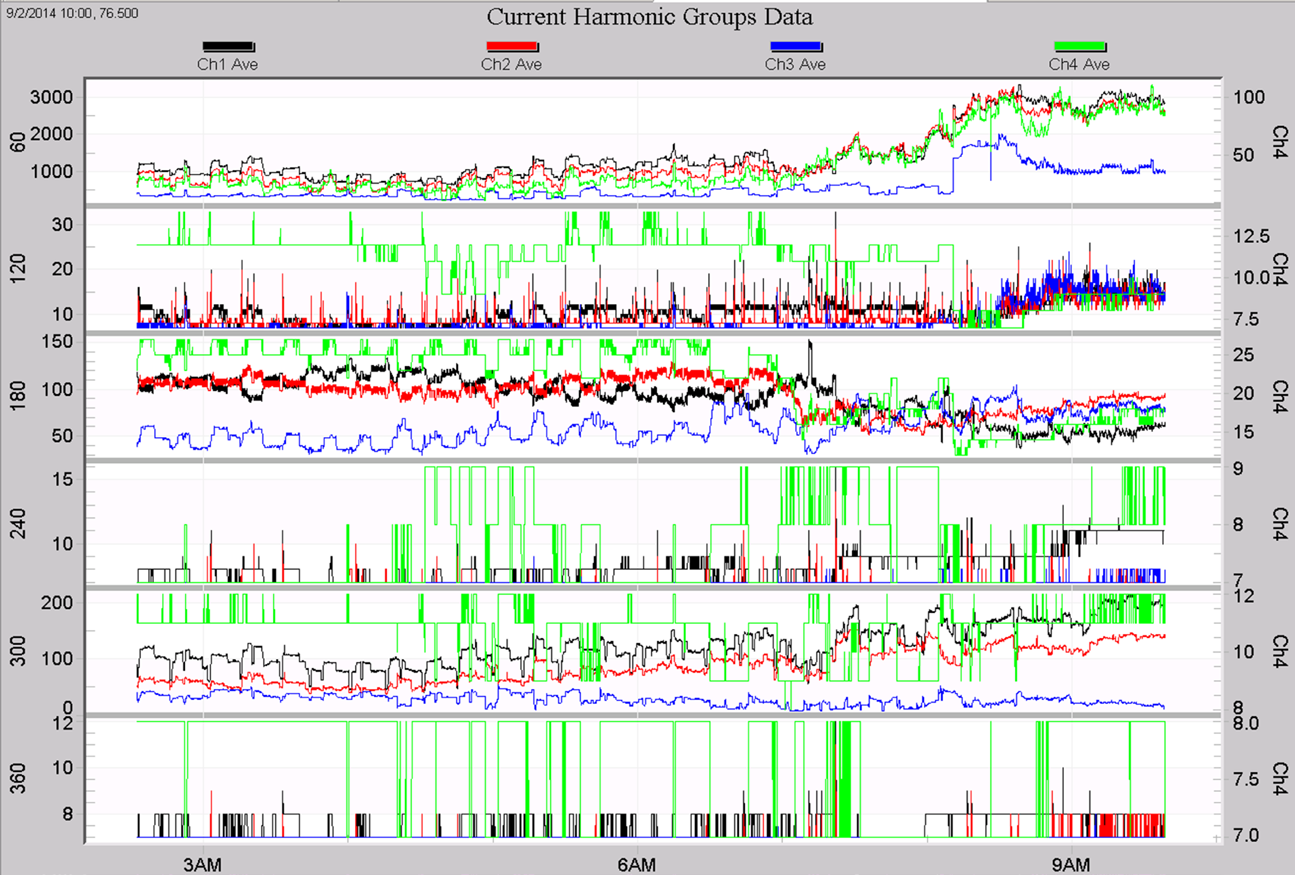
In addition to the individual interharmonics, each group and subgroup aggregations for harmonics and interharmonics have their own graph templates, for both voltage and current. The plot format is the same as the interharmonics – channels 1, 2, and 3 on the left y-axis, and channel 4 on the right, with black, red, blue, and green trace colors. Each plot shows a single group or subgroup. Each group or subgroup is identified by the frequency of the nearest harmonic, for consistency with the method of recorder initialization. Figure 5 shows a sample graph of harmonic group data, from the 1st through the 6th harmonic. Each template includes 6 groups or subgroups, without skipping even or odd harmonics. The formats of the harmonic and interharmonic group and subgroup graphs are identical.
Mixed Graphs
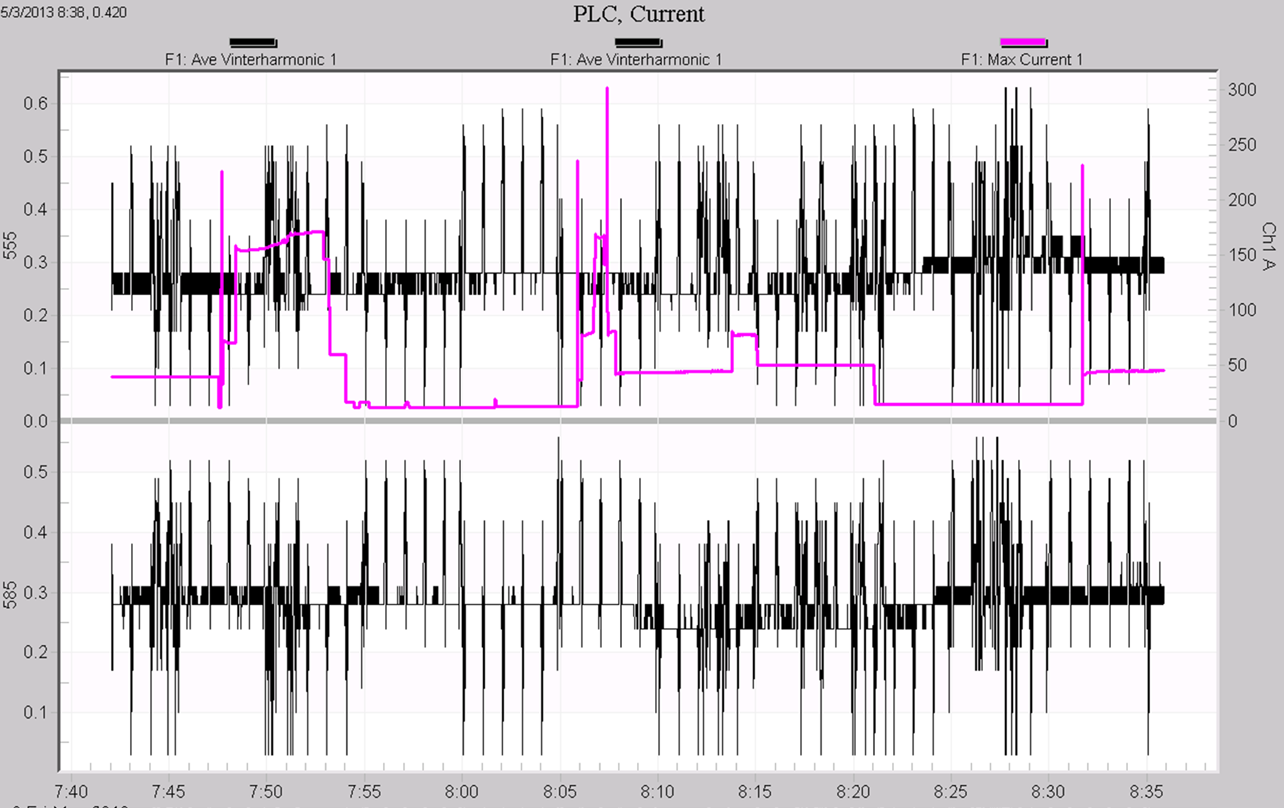
If an interharmonic, group, subgroup, or channel wasn’t recorded, those traces simply do not appear in the plot. There is no need to record all interharmonics for all channels to use these graphs – if any applicable data is available, they will be graphed from the template, but if any data is not recorded, it simply is not graphed. These graph templates may be combined with other existing ProVision graphs for more advanced analysis using the graph mixer. For example, some PLC/AMI systems operate with outbound carriers at 555 and 585Hz, which are exact interharmonic frequencies. In Figure 6, these two interharmonics are shown graphed with RMS current, which can be useful in troubleshooting. The two interharmonics are black (since they are channel 1 readings from the template), and the current is light purple. Here, the 0.5V carrier levels seem unaffected by the load current. These mixed graphs may be saved as templates for re-use later. Using the new interharmonic templates is a quick way to mix interharmonics with other built-in ProVision graphs, and to create new custom templates, combining interharmonics with any other stripchart data.
Conclusion
A complete collection of custom graph templates has been created for easier and more advanced data analysis of interharmonic trend data. These templates allow for easy graphing of specific interharmonics, groups, and subgroups, and can also be used as starting point for creating even more customized graphs with interharmonics and other data types.
