Abstract
Power Monitors, Inc. Canvass, our web based electrical data analysis software, has recently been upgraded with many new features. New features include: A new menu window, a Canvass message inbox, support for graph printing, CSV data export, a graph point trace table, a streamlined recorder selection process, a new recorder alerts interface, and the ability to retrieve and send settings from and to Boomerangs. Those new features will be described below.
New Menu Window
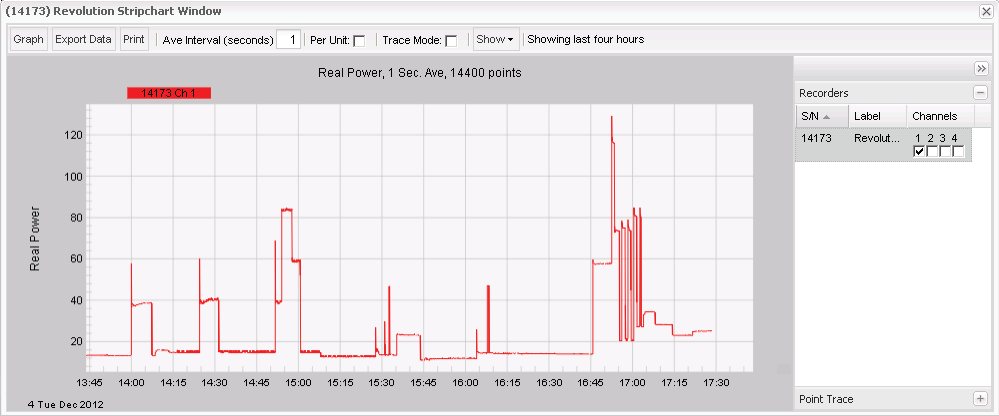
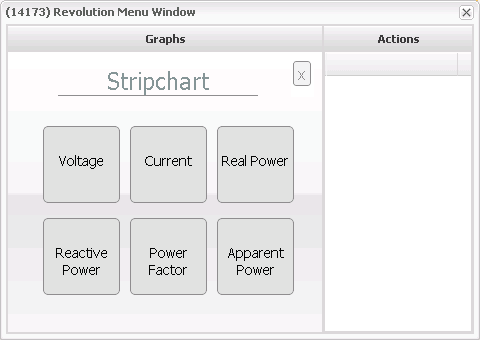
Menu windows, the windows that open when you click on a map marker or select a recorder from the recorders list, have been completely redesigned in Canvass. Clicking on the stripchart, histogram, or daily profiles buttons now opens a submenu with the different graph choices for your Boomerang. For instance, clicking on the “Stripchart” button for a multi-measure Boomerang will open a submenu with buttons for voltage, current, and real power stripchart graphs. Boomerangs and Canvass-enabled PMI recorders that measure current and power are now supported, and can generate power stripcharts, daily profiles, and histograms (Figure 1 and 2). A single phase Boomerang will only have a button for a voltage stripchart graph. On the right side of the menu window is a group of buttons for extra recorder actions. A Boomerang, for example, has a button to open a recorder stats window and a burst mode window.
Canvass Message System
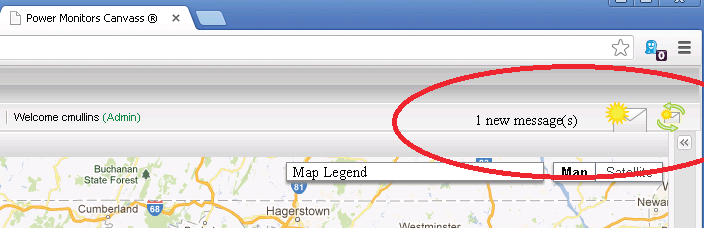
Canvass now features a messaging system. When you start a long running process, such as exporting graph data to a CSV, that process is completed on a separate thread so that you can continue to use Canvass uninterrupted while the task completes. After the task has finished, you will receive a new message in your Canvass inbox. To check your inbox, click on the letter icon on the upper right hand corner of the Canvass interface (Figure 3). This will open the messages window. Unread messages appear in bold text. Click on the message title to read it. To delete messages, check the checkbox next to the message(s) you wish to delete and click “Delete Messages”. Canvass is set to check for new messages every minute. To force Canvass to check for new messages, click on the refresh icon next to the letter icon.
Additions to Canvass Graphs
Several new features have been added to Canvass’s graphs, including support for printing, exporting graph data to a CSV file, multiple recorder selection at once, and a point trace table.
The most recent upgrade to Canvass gives you the ability to print graphs. To print a graph, click on the “Print” button on the graph window’s toolbar. Your web browser will open a new window and a printing dialogue. Generally, printing a graph will take as long as it did to load the graph. You can also save a printed graph to your computer. To save a graph in Internet Explorer, go to the new window that the printing action opened containing the graph image. Right click on the image and choose “Save Picture As”. All other browsers support saving the graph in this way, though the option to save will likely be labeled “Save Image As”.
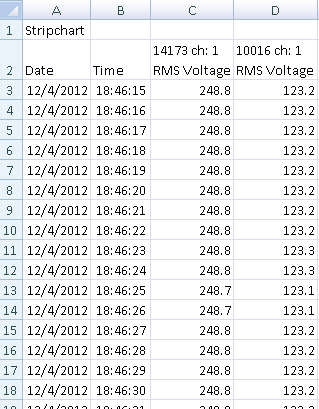
CSV data export allows you to do analysis on raw graph data (Figure 4). The data is exported in a way that allows a spreadsheet program like Excel to organize the data into rows and columns. First, on the graph window’s toolbar, click on “Export Data”. The time it takes to export your data depends on how large of a time-span and how many recorders you have graphed. Once your CSV file is ready, you will receive a message in your Canvass inbox. Open the message and follow the link to download your CSV data file.
A handy new feature that has been added is the ability to select multiple recorders before requesting graph data. In previous versions of Canvass you had to add recorders to a graph one at a time and wait for all of them to load before you could add more. Now, simply hold down the shift key while selecting recorders on a graph and release the shift key to load them all at once.
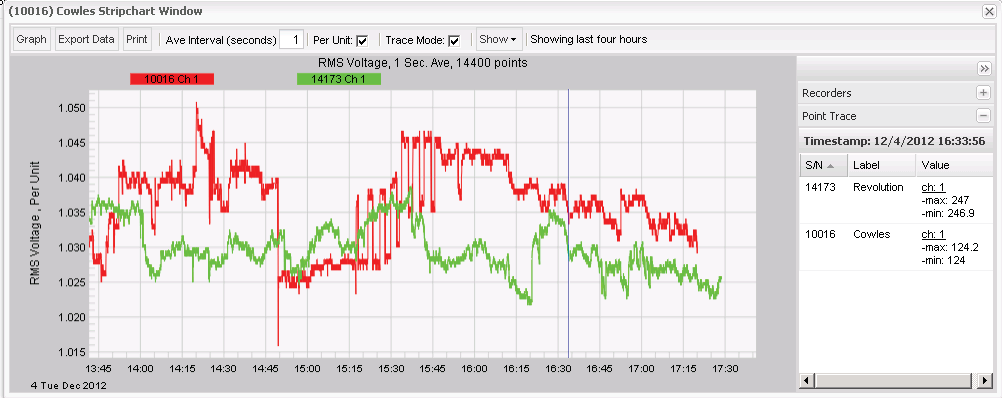
To make analyzing graphs in Canvass easier, we have added a point trace table. To enable point trace mode, click the “Trace Mode” checkbox on the graph’s toolbar. Once point trace mode is enabled, a blue bar will appear when you click on a point on the graph. To see the values of all graphed traces at that point, expand the point trace table, which is located on right hand side of the graph (Figure 5).
New Alerts Panel
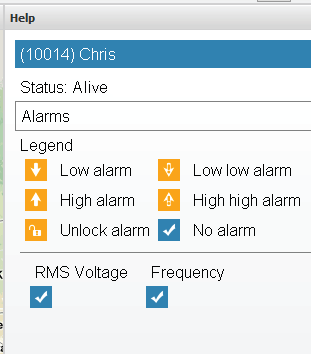
The way device alerts are displayed has been upgraded in Canvass. When a device is in an alert state, its map marker will still turn orange. Details about the recorder’s alert state are now shown in the help panel on the right hand side of the Canvass interface. Open the help panel and hover over a recorder’s map marker or its entry in the recorders panel on the left side of the Canvass interface, and you will see a detailed list of the devices, alarms and the state of those alarms (Figure 6).
New Settings Window
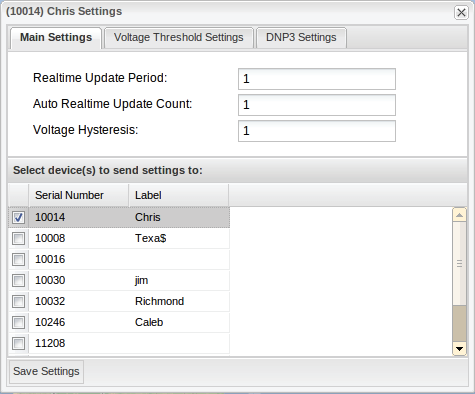
You can now use Canvass to get and send settings to Boomerangs. Click on “Administration” on the main toolbar and then click “Configure Devices”. A window will open with a list of Boomerangs in your account. Click “Edit” next to the name of the Boomerang you wish to edit to open the edit settings window. Canvass will attempt to retrieve settings from the Boomerang. If the attempt is successful, an edit settings window will open (Figure 7) and you will see the editable settings in the window’s forms. Edit the settings you wish to change, and select the recorder(s) that you wish to send the settings to in the list under the settings form. When you are ready to send settings to the selected devices, click “Save Settings”. You will receive a message in your Canvass inbox explaining whether the settings upload was successful or not. If it was successful, the Boomerang(s) will have to reset and will be unavailable for settings retrieval and upload for about a minute.
Conclusion
Power Monitors, Inc. Canvass is an advanced web based electrical data analysis package that continues to receive new features and upgrades. Canvass has recently received several new upgrades that make it more powerful and robust.
