Abstract
ProVision offers a wide variety of reports and graphs for displaying various types of power quality data. One of these is the power consumption report. Newly added to this report are measurements for net metering. The report now separately computes net, positive, and negative power consumption and peak power values over the entire recording, or any part of the recording captured by stripchart data. The separate positive and negative values allow for quick determination of peak generation and consumption values for photovoltaic or other distributed generation situations. This whitepaper serves as an overview and explanation of the new power consumption report available in ProVision.
Note that the power consumption report referenced in this whitepaper contains changes introduced in build 5079 of ProVision. These changes will be carried forward in all subsequent builds. It is recommended to upgrade to build 5079 to take full advantage of all the new features of the power consumption report. ProVision updates can be downloaded HERE at no cost.
Configuring the Recorder
The power consumption report utilizes certain data that must be present in the recording file. Therefore, the recorder must be initialized to record these data before being deployed. Since the power consumption report is computed from the stripchart data of real, reactive, and apparent power, these stripcharts must be recorded. To do this, first open the initialization dialogue by right-clicking the desired recorder and, from the resultant context menu, selecting the “Initialize” option. On the “Interval Graphs” tab, ensure that the checkboxes for Real Power, Apparent power, and Reactive Power are all checked, in addition to other initialization options. Note that initializing the recorder will clear any data on it, so ensure that the recording has already been retrieved prior to initialization. Note that recordings downloaded with prior versions of ProVision initialized to record these stripcharts will contain enough information, including negative values, to properly display the upgraded power consumption report.
Opening the Report
In order to generate power consumption reports, select the recordings for which to create reports for by ensuring the checkboxes next to them in the Explorer Tree are checked. Then, from the reports menu, select “Power Consumption Report”. For each recording, this will open a date selector in which the date range for the generated report can be specified. By default, the date range is from the earliest date in the recording to the latest. Modifying the date range can be useful when wanting to exclude certain regions of the recording or focus on a specific portion. Note that when modifying the date range, ProVision will always ensure the starting date falls before the ending date. Furthermore, if either date falls outside the range of the recording, ProVision will only use as much information as it has available. Once the date range has been finalized, select “OK”. This will open an individual report for each selected recording.
Parts of the Report
The report is divided into three primary regions: net, positive, and negative. The net region displays the difference of the positive and negative regions. The net values include the combined effects of any positive (power delivered to customer) and negative (power supplied by customer) power flow past the recorder. The positive region displays only power consumed, and represents power supplied by the utility and consumed by the load. Any negative power is not included in the calculations for the positive values. The negative region displays negative power consumption, representing power supplied by the “load”, and delivered back to the utility. Any positive power is not included in the negative power summation. If the local power generation is equal to the local load, then no net power is flowing to or from the utility, even though there is power flowing from the local generation to the local load. In each region, the totals for that region are broken down into power consumed, peak power, and peak timestamps.
In the power consumed section, each measurement is taken by tallying the appropriate data for that type of measurement. For example, when calculating channels of Real Power, every average point of Real Power data in the recording specific to that channel is analyzed. The tallies for net sum all of them, while the tallies for positive and negative only summate the respective positive and negative values. Each channel of data is calculated this way. Three-phase is done similarly, with the added step that channels one, two, and three are summed to produce this value. Note that tallies for apparent power are only done for positive and net consumption, and not for negative, since apparent power is always positive.
The next two sections detail net peak power. While each data point is summed when creating the values in the power consumed section, ProVision also monitors which one has the greatest magnitude, and the time at which it occurred. These values are reported in the peak power and peak time sections respectively. Peak power can be useful when determining the magnitude of the greatest power consumption for each region, while peak time is useful for going back to the stripcharts to see what else was occurring at the time of peak power.
Analyzing the Data
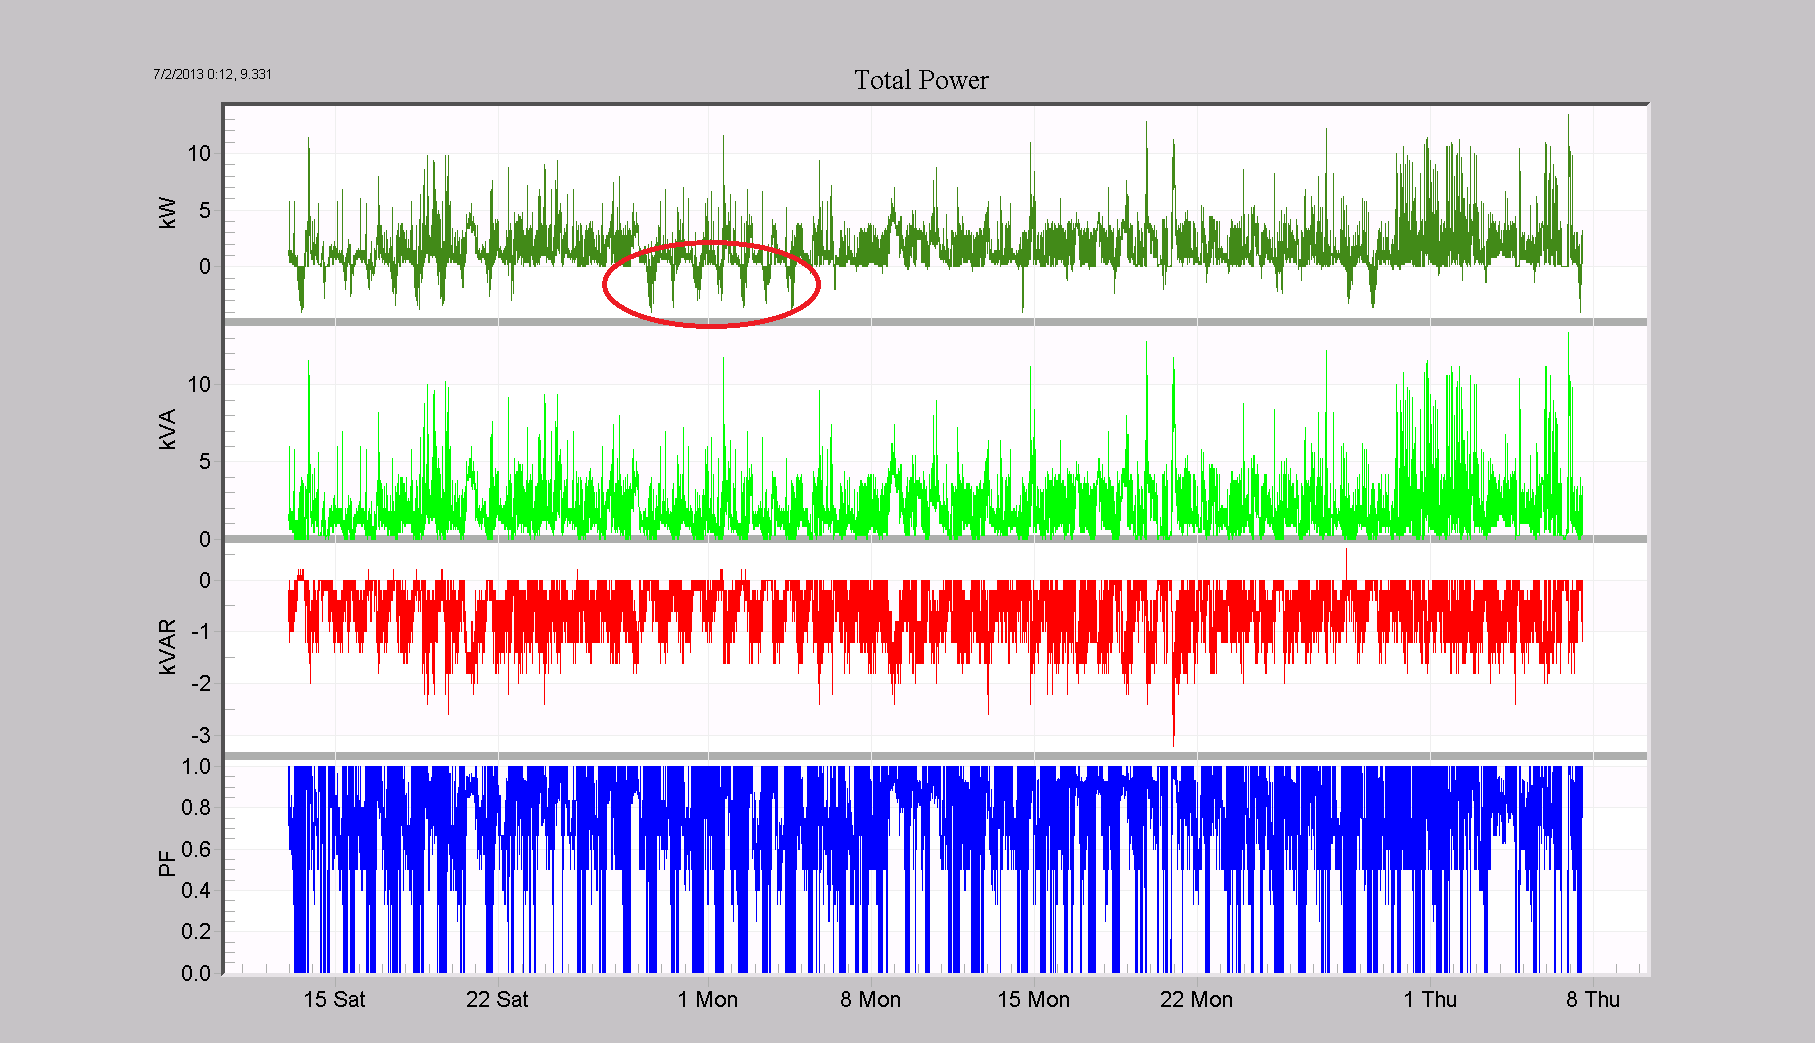
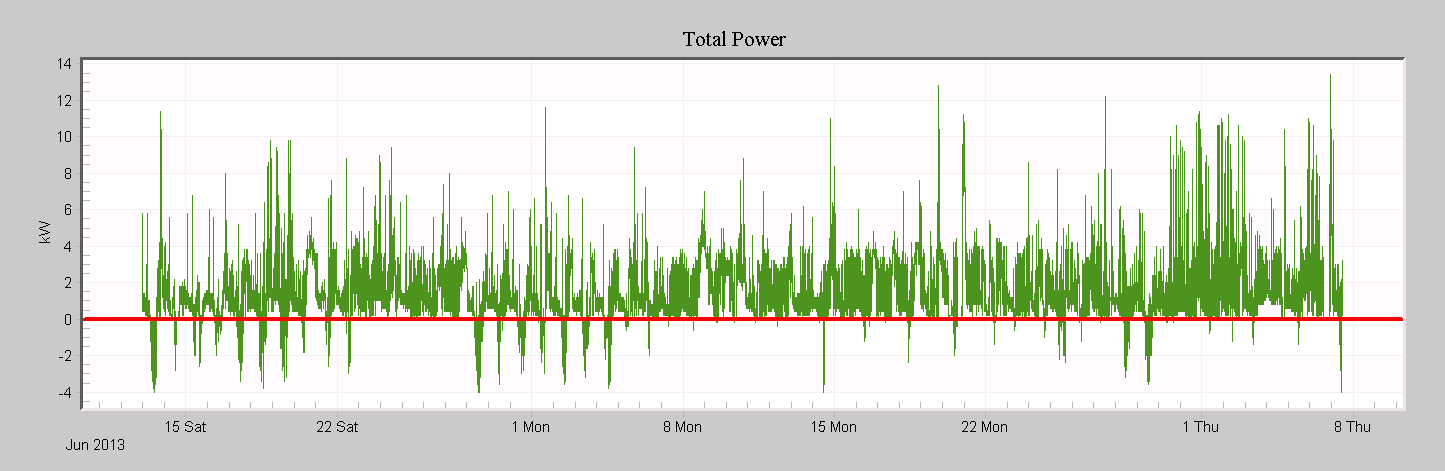
To illustrate the report, a single phase residential file will be used. A solar panel is installed at this house, which supplies power back to the utility and also powers loads in the home. An Eagle 440 was used to record power at the service entrance. In Figure 1, the Total Power Graph is shown, covering about 6 weeks of time. The total real power trace (top, darker green) shows several instances where the power was negative, indicating power flowing towards the utility. Zooming in on one day shows the power flow as the sun rises.
In Figure 2, a single day is examined, and the power goes negative, reaching a value close to -4kW. The smooth curve generated from the sun rising is punctuated by loads switching on inside the house (one load switch is marked on the graph). If a load consumes more power than is generated by the PV system, the power will become positive again, as the utility supplies the remainder needed by the load.
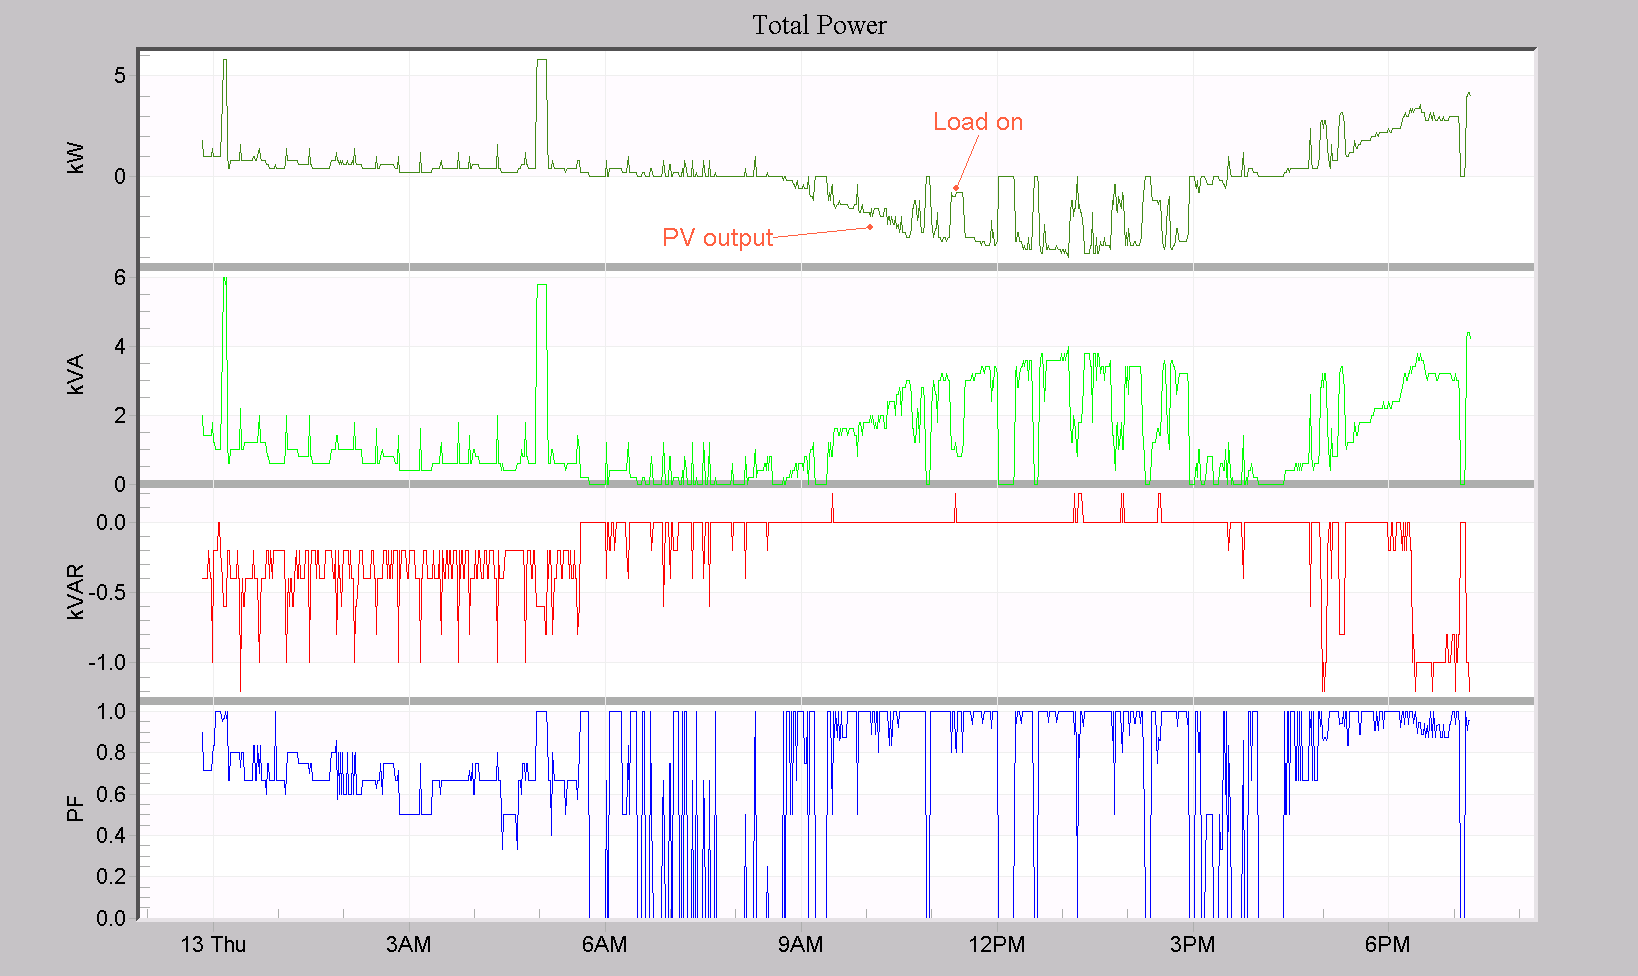
The interval here was set to 1 minute, and 1 minute averages are displayed. Within the 1 minute averaging period, positive and negative power are averaged together, resulting in a net value. These net values are fed into the Power Consumption report. Because the interval time is small compared to the length of time most loads are on or off, these “net” values are still suitable for computing positive and negative power in the Power Consumption report. With a longer interval, such as 15 or 30 minutes, this may no longer be true.
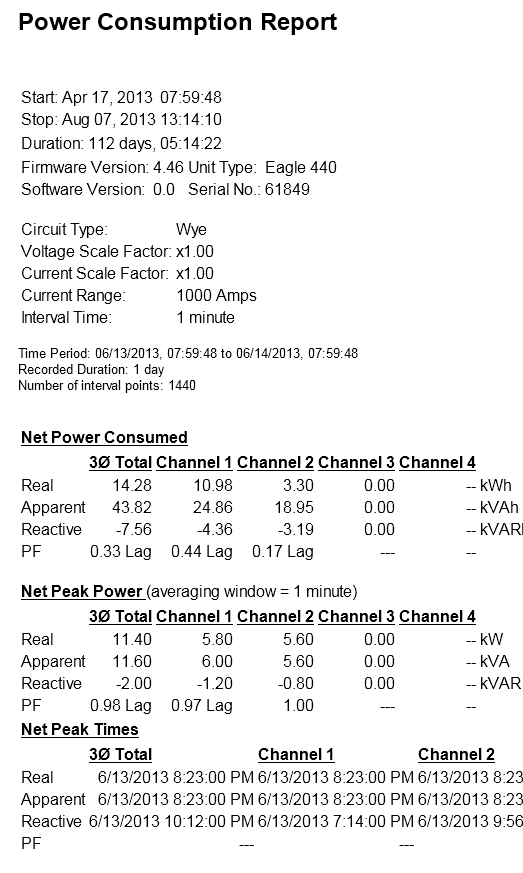
To view the Power Consumption Report, choose Report, Power Consumption from the main menu. A date form will appear, allowing a custom time range for the report to span. This defaults to the entire recording session. The beginning of the report is shown in Figure 3. Here, the June 13th day shown in Figure 2 is analyzed. After the report header, the Net Power Consumed section shows the net power, net peak power, and net peak power times for each channel, and the total. Also given are values for apparent and reactive power, and power factor. Here the total power in this 24 hour period was 14.28 kWh, with a peak value of 11.4 kW (5.8 kW on channel 1, 5.6 kW on channel 2). This peak occurred at 8:23pm.
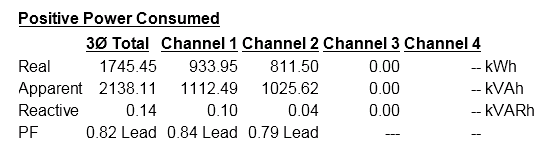
The lower section of the report, where positive and negative values are displayed, is shown in Figure 4. The total positive power consumed in this 24 hour period is 27.06 kWh, and the negative power was -12.78 kWh. During this day, 27 kWh was supplied by the utility, and during that time 12.78 kWh was given back to the utility, for a net of 14.28 kWh. The peak positive power was 11.4 kW, and the peak negative power was -4.0 kW.
In this location, the utility must be prepared to accept up to 4 kW of generation from the customer, and this customer is capable of supplying over a third of their own power over a 24 hour period.
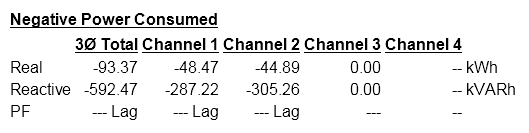
Running the report again for the entire duration (55 days), the total positive power (Figure 5) and negative power (Figure 6) are seen. 1745 kWh was consumed, while 93.37 kWh was delivered back to the utility. This ratio of positive to negative power is much less than in the 1 day example.
In Figure 7, the total real power stripchart for this timespan is graphed, with a red horizontal annotation marking the boundary between positive and negative power. There are several days in the first half where the power goes negative, but during the latter half this happens much less often – likely overcast weather reducing the PV output.
Conclusion
The revised Power Consumption report allows for separate analysis of positive and negative power consumption over specific timestamps. This feature is very useful for net metering applications, where power may be generated by the customer.
