Abstract
ProVision has a multitude of graphs available that are great for analyzing the various aspects of motor startup and the PQ issues that arise while operating these devices. Using an RMS Interval chart to find motor start events, we will discuss how to use waveform captures for detailed analysis and how to use reports to find motor starts hidden by high trigger thresholds or memory wrap around. This whitepaper aims to give an overview of the graphs that are available and to demonstrate the usefulness of each for analysis of motor startup characteristics, and also to tie together multiple types of graphs and reports in ProVision.
Capturing Motor Start Information
For a basic motor startup monitoring session it is good to set the recorder to capture RMS Voltage and Current Interval data, with the interval set as fast as possible. Ideally a one cycle or 1 second average, but in any case the interval should be faster than the normal ON time of the motor. Voltage and Current waveform data should be configured to trigger when the motor starts (typically by setting the current trigger level a bit higher than the motor running current), and the significant change threshold should also be set. The default settings for waveform capture and significant change are a good starting point for most motor start events. Knowing the power requirements of the motors being monitored will help to fine tune the settings to capture only the information necessary. For further information on initialization and setup please see the related whitepaper Techniques for Analyzing Motor Startups.
RMS Voltage and Current Interval Graph
RMS Voltage and Current stripchart graphs display single-cycle or time-averaged min/ave/max samples for voltage and current covering the duration of a recording session. The high level view provided by this graph is great for identifying motor starts and run durations. To access this graph, use the main menu and click (Graph > RMS Interval > RMS Voltage and Current) and a new graph will appear. Motor start/stop times can be identified by looking for high/low patterns in the trace that represents current (Max I, Min I, Avg I). This pattern is demonstrated in Figure 1.
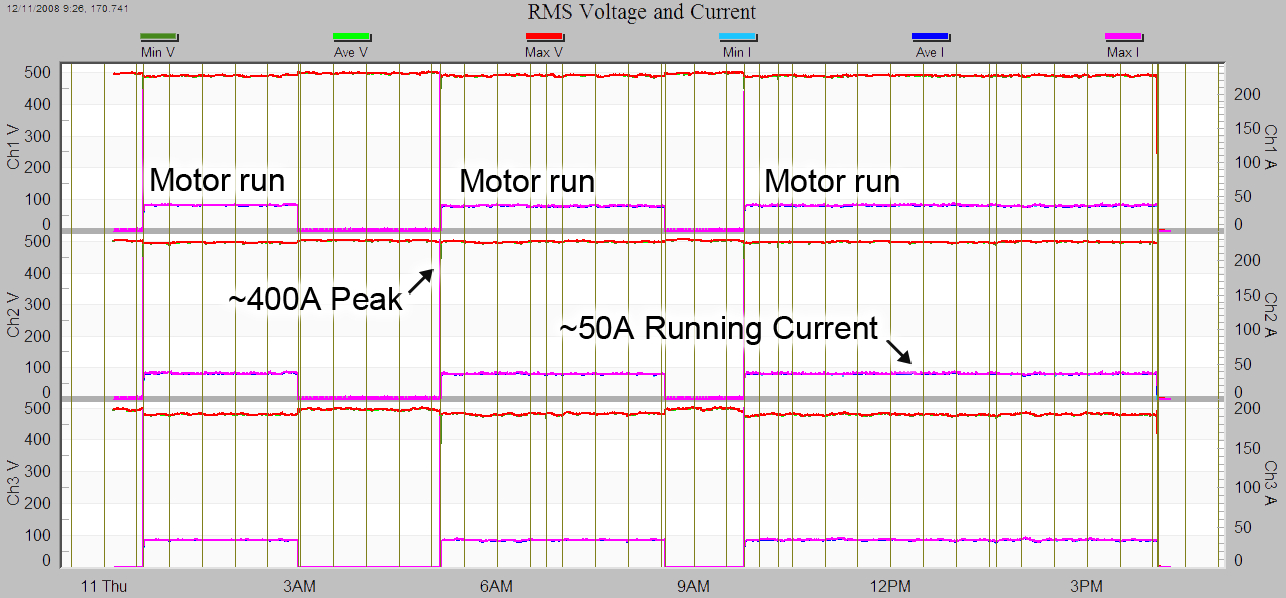
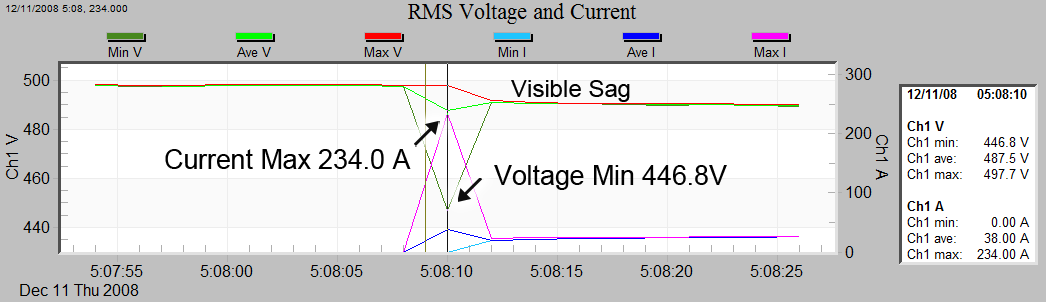
Since one of our main interests in evaluating a motor startup lies in how the inrush current is affecting the voltage at that time, we can zoom in on the event start to reveal a higher level of detail. (Figure 2) Doing so reveals a spike in the current (Max I) causes a corresponding sag in the voltage (Min V). While zoomed to this level of detail, the exact values represented in the graph can be discovered by using the point table. Use the “t” button to toggle the Point Table, click on the trace at the point of interest, and the values at that point will appear in the side table. Upon closer inspection, this voltage sag is almost certainly due to voltage drop in the distribution and building wiring, distribution transformer, and connections caused by the motor current.
When using RMS Voltage and Current Interval graphs it is important to keep in mind the length of time the recording interval was set to. In many instances the interval is set to a longer span of time to conserve recorder memory. Doing this can obscure important details of the motor startup events. To gather data for the interval chart, the recorder collects the absolute maximum, absolute minimum, and calculates an average value over the duration of the specified time. A short duration, such as 1 cycle or 1 second, provides the best detail on complex interactions and good idea of how long it took for the motor to reach steady state. When a longer duration is specified, the min and max could have occurred at any time in the interval and what actually happened becomes less certain. The worst-case cycle is still recorded though, so the sag depth is always correct.
Voltage and Current Waveform Capture
Since RMS Interval graphs provide only RMS data, it is impossible to see raw waveform distortions and details of other effects caused by a motor startup. Voltage and Current Waveform Capture provide a way to view data generated from raw waveform sampling. PMI’s Revolution, Eagle, and Guardian PQ recorders can be set to trigger a waveform recording when voltage or current pass a specified threshold setting. The waveforms in the following examples were triggered by using a 3% Voltage and a 40% Current threshold setting.
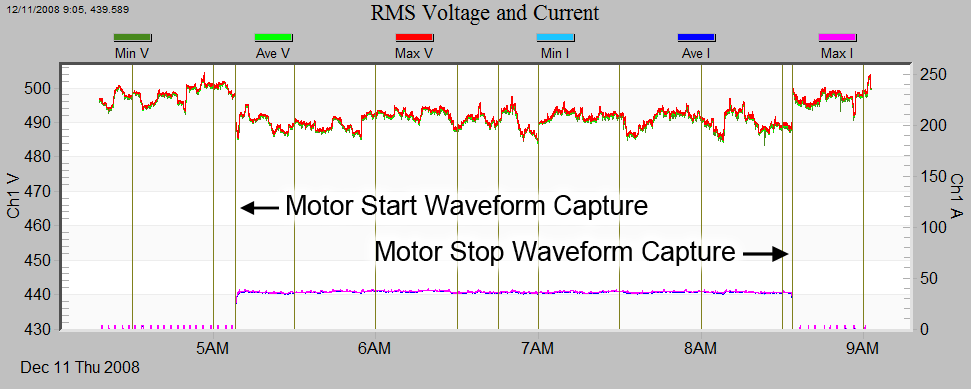
The Voltage and Current Waveform Capture can be found two different ways. First is to use the main menu and navigating to (Graphs > Waveform Capture > Voltage and Current) and selecting a waveform from the list. The second method uses the event links provided in the RMS Interval graphs to jump directly to an event. As seen in the figures above, each vertical line is associated with a waveform capture event. To launch the waveform capture simply find a vertical line that correlates to a motor start event and use the mouse button to click (see Figure 3). The waveform capture of interest will then be displayed. Once displayed, the page up and page down keys can then be used to move to the previous and next waveform capture.
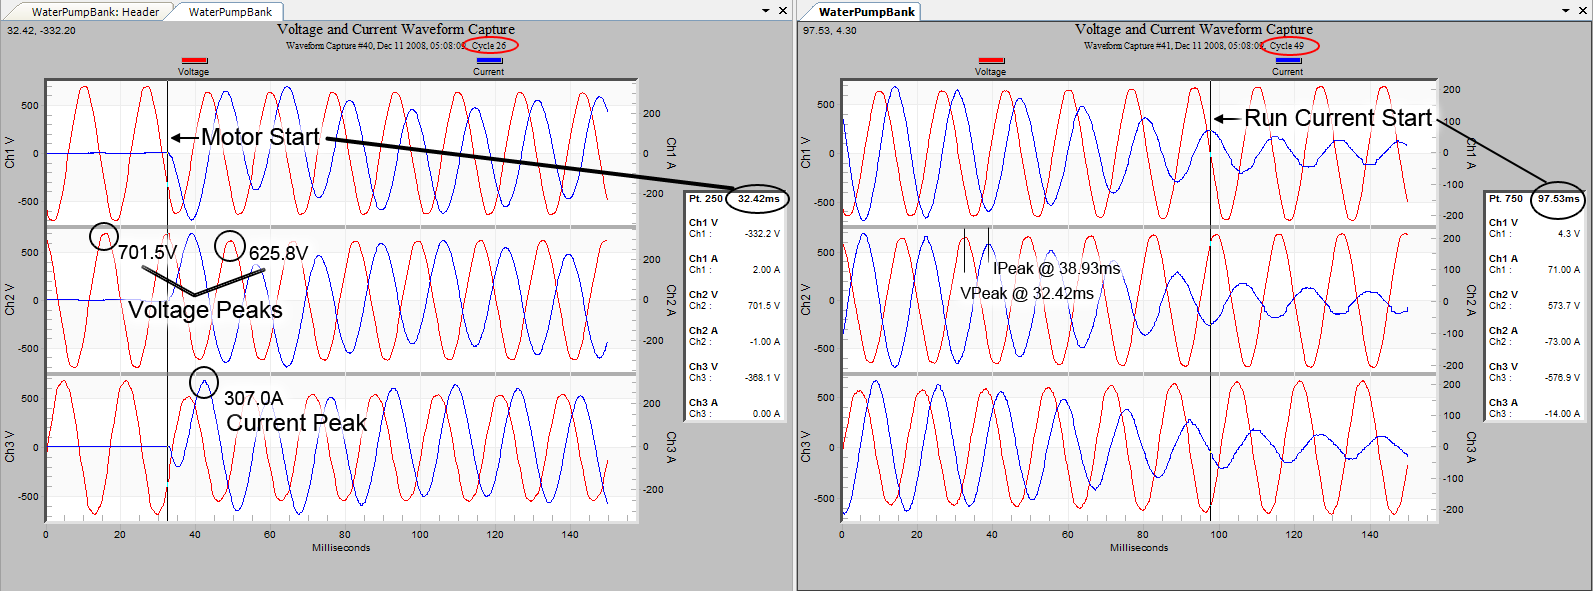
Using the waveform capture and the Point Table, we can obtain the following data for use in further analysis (as seen in Figure 4):
- Voltage and Current peak values
- The duration of the motor start and any subsequent sags
- Current lead or lag times
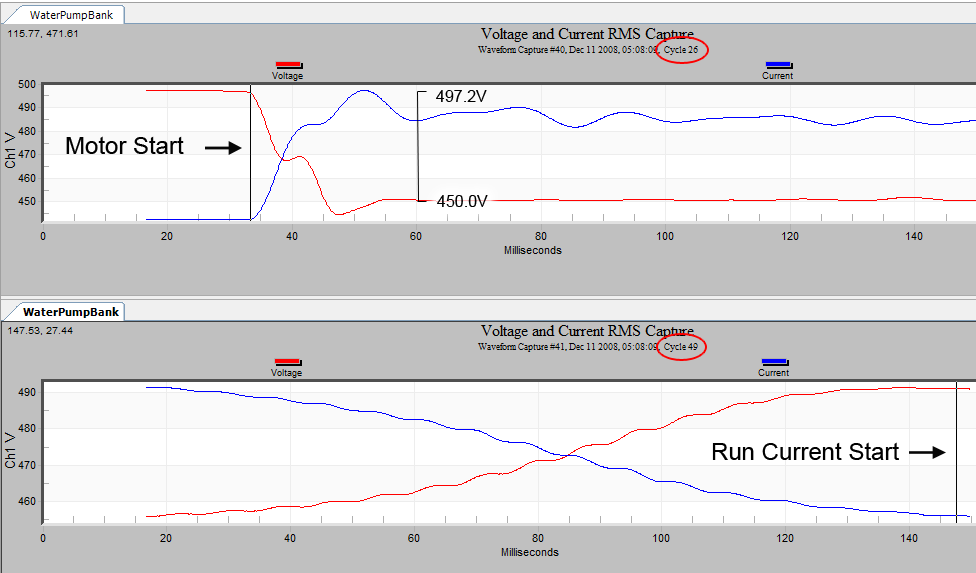
The voltage and peak values are easily calculated by inspecting the several peaks and doing manual calculations, but the duration of the motor start can sometime be longer than the post recording cycle length that was set on the recorder. In this case it is possible to use multiple back-to-back waveform captures if they are close to the same time. Using the Motor Start time and the Run Current Start time along with the cycle information derived from Figure 4 we will calculate this duration. Please note that both waveform capture graphs have the same time stamp down to the second but have different start cycles. We can calculate the duration by finding the end time (Run Current Start time (ms) + the Cycle Offset (ms)) subtracted from start time (Motor Start time (ms) + the Cycle Offset (ms)). ((97.5ms + 49 cycles × 16.6ms) − (32.4ms + 26 cycles × 16.6ms)) → (910.9ms − 464.0ms) = 446.9ms. Divide by 16.6ms/cycle to reveal that this motor startup event lasts for ~27 cycles.
Additionally, the waveform capture is great for viewing other PQ anomalies. For variable frequency drive controlled motors, the current pulse shapes and timing can indicate problems due to voltage unbalance, impending rectifier failure, or changes from a baseline reference waveform. Arcing, insulation breakdown, or other problems during motor starts may also be visible here.
Voltage and Current RMS Waveform Capture
Another method for viewing motor startups is the Voltage and Current RMS Waveform capture. This graph is especially good at revealing the inverse relationship of the voltage to the current and makes it easy to see, at a glance, the total voltage and current change. This is the best graph to quantify the voltage sag caused by motor starting current. A continuous, sliding RMS calculation is applied by ProVision to the raw waveform data, giving a 1 sample (65 μS) resolution to the RMS voltage seen by other loads. Measuring the length and depth of a voltage sag is much easier here than with the sinusoidal raw waveforms, due to scaling issues with the peak-peak nature of a sine wave. Deviations from the sine wave shape are hidden here, so be sure to check the raw waveforms too for unexpected waveshape issues.
Figure 5 shows a marked up version of this graph detailing the voltage and current changes that were found using the Point Table. To access one of these graphs choose (Graph > Waveform Capture > RMS Capture) from the main menu. Select a waveform from the list whose number corresponds to the motor start event found in the previous step. Once the graph is displayed, the page up and page down keys can be used to change between the waveform captures in the data set.
Significant Change Report
There are times when the information about a motor start is not available from the RMS Interval data or from Waveform Capture due to data wrap around, large quantities of other events, or coarse stripchart or waveform capture settings. The Significant Change Report provides information about voltage changes and can be compared to what is known about the motors downstream from the recorder. The reporting mechanism allows a change threshold to be specified (see Figure 6). Every time the voltage changes more than the threshold from the last triggered value, a new event is added to the list and that value is used as the reference for reporting the next significant change. To view a Significant Change Report choose (Report > Significant Change) from the main menu.
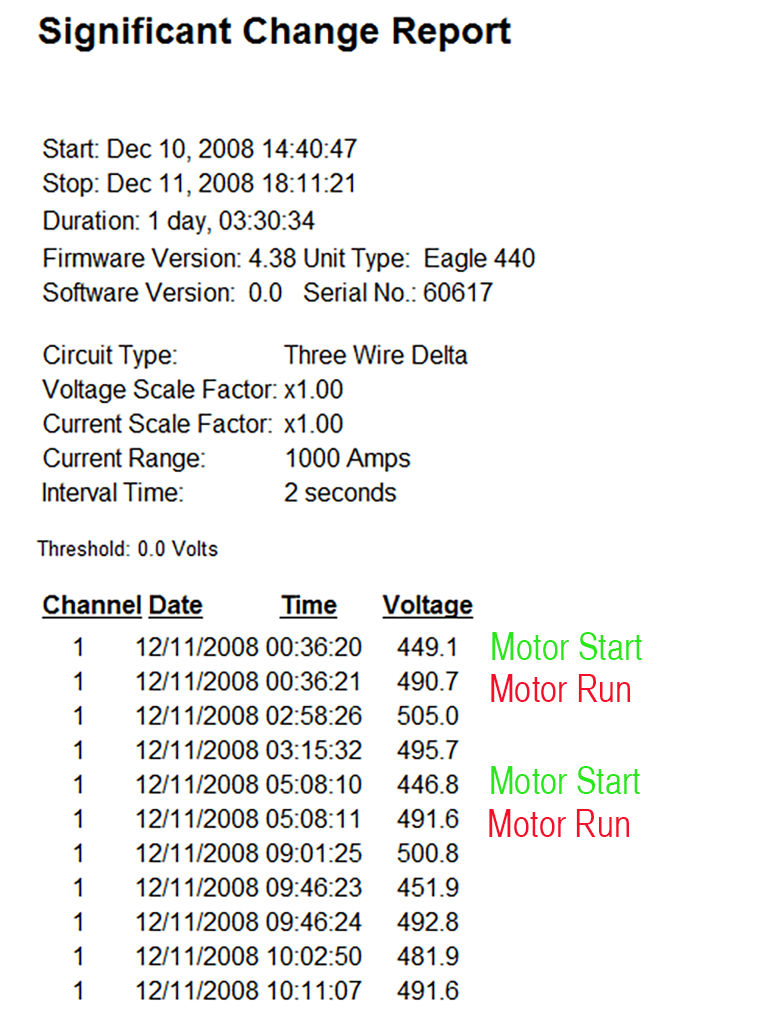
Motor startup events can now be detected knowing that the voltage drop experienced elsewhere was around 50V. Looking through the report reveals each of these events characterized by a voltage that remains steady (within 3V) followed by a 50V drop in voltage for 1 second and quickly returning to the motors running voltage of 490V. When the motor is shut off the change event is also logged and the voltage returns to nominal ~500V peak. These excursions are 1-cycle RMS values, giving high resolution for the worst-case sag depth.
Event Change Table Reports
The Event Change table provides very detailed text-based information about voltage events and can be used to fully characterize a sag due to a motor start. An Event Change record is triggered when the voltage crosses any of a series of thresholds ranging from 0 to 600V. When it is triggered, the event duration (in cycles) as well as the min/max RMS voltage and current during the event are recorded. In addition, the RMS current 1 cycle before and 1 cycle after the event are also logged. An example is shown in Figure 7. In this event, a pump motor start lasts seven cycles. The 332 Amp starting current pulled the voltage down to under 200 volts, from a nominal of 240. The running current of 56 Amps is seen in the Post-event column in Figure 7.
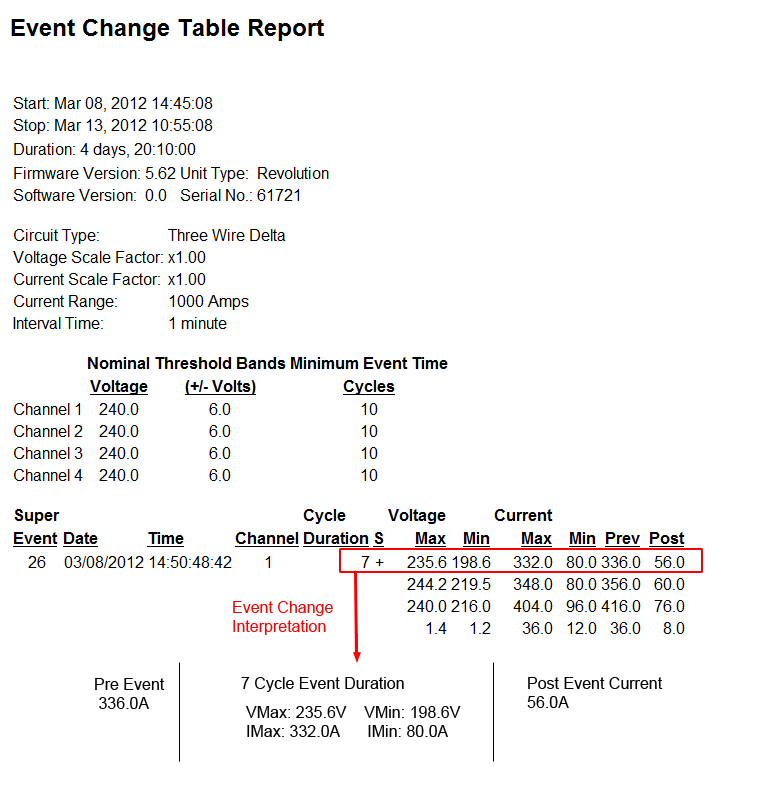
By examining the pattern of voltage and current changes, it’s possible to determine if the load being monitored was the cause of the sag. For a typical motor start, the current will be small in the cycle before the event, very large during the event, and smaller again in the cycle after the event where the post-current event represents the motor’s normal running current. This pattern indicates that the high current was the cause of the voltage sag. If the current falls when the voltage sags, or remains roughly the same, the load is likely not the cause of the voltage sag. This relationship is easier to see graphically with the RMS Capture waveform view, but the Event Change report provides the same essential details, is useful for quantifying the event, and is available in cases where RMS Capture is not.
Conclusion
There are many ways of looking at motor startups that may not be immediately evident due to the sheer quantity of reports and graphs that are available in ProVision. When preparing a recorder for monitoring, it should be set to include RMS Voltage and Current intervals, waveform captures, and Significant Changes. Furthermore, if the motor start event wasn’t captured in a waveform, or is not accessible due to a large number of other PQ events, it is still possible to infer motor startups and the Voltage and Current conditions surrounding the event by examining alternate reports.
